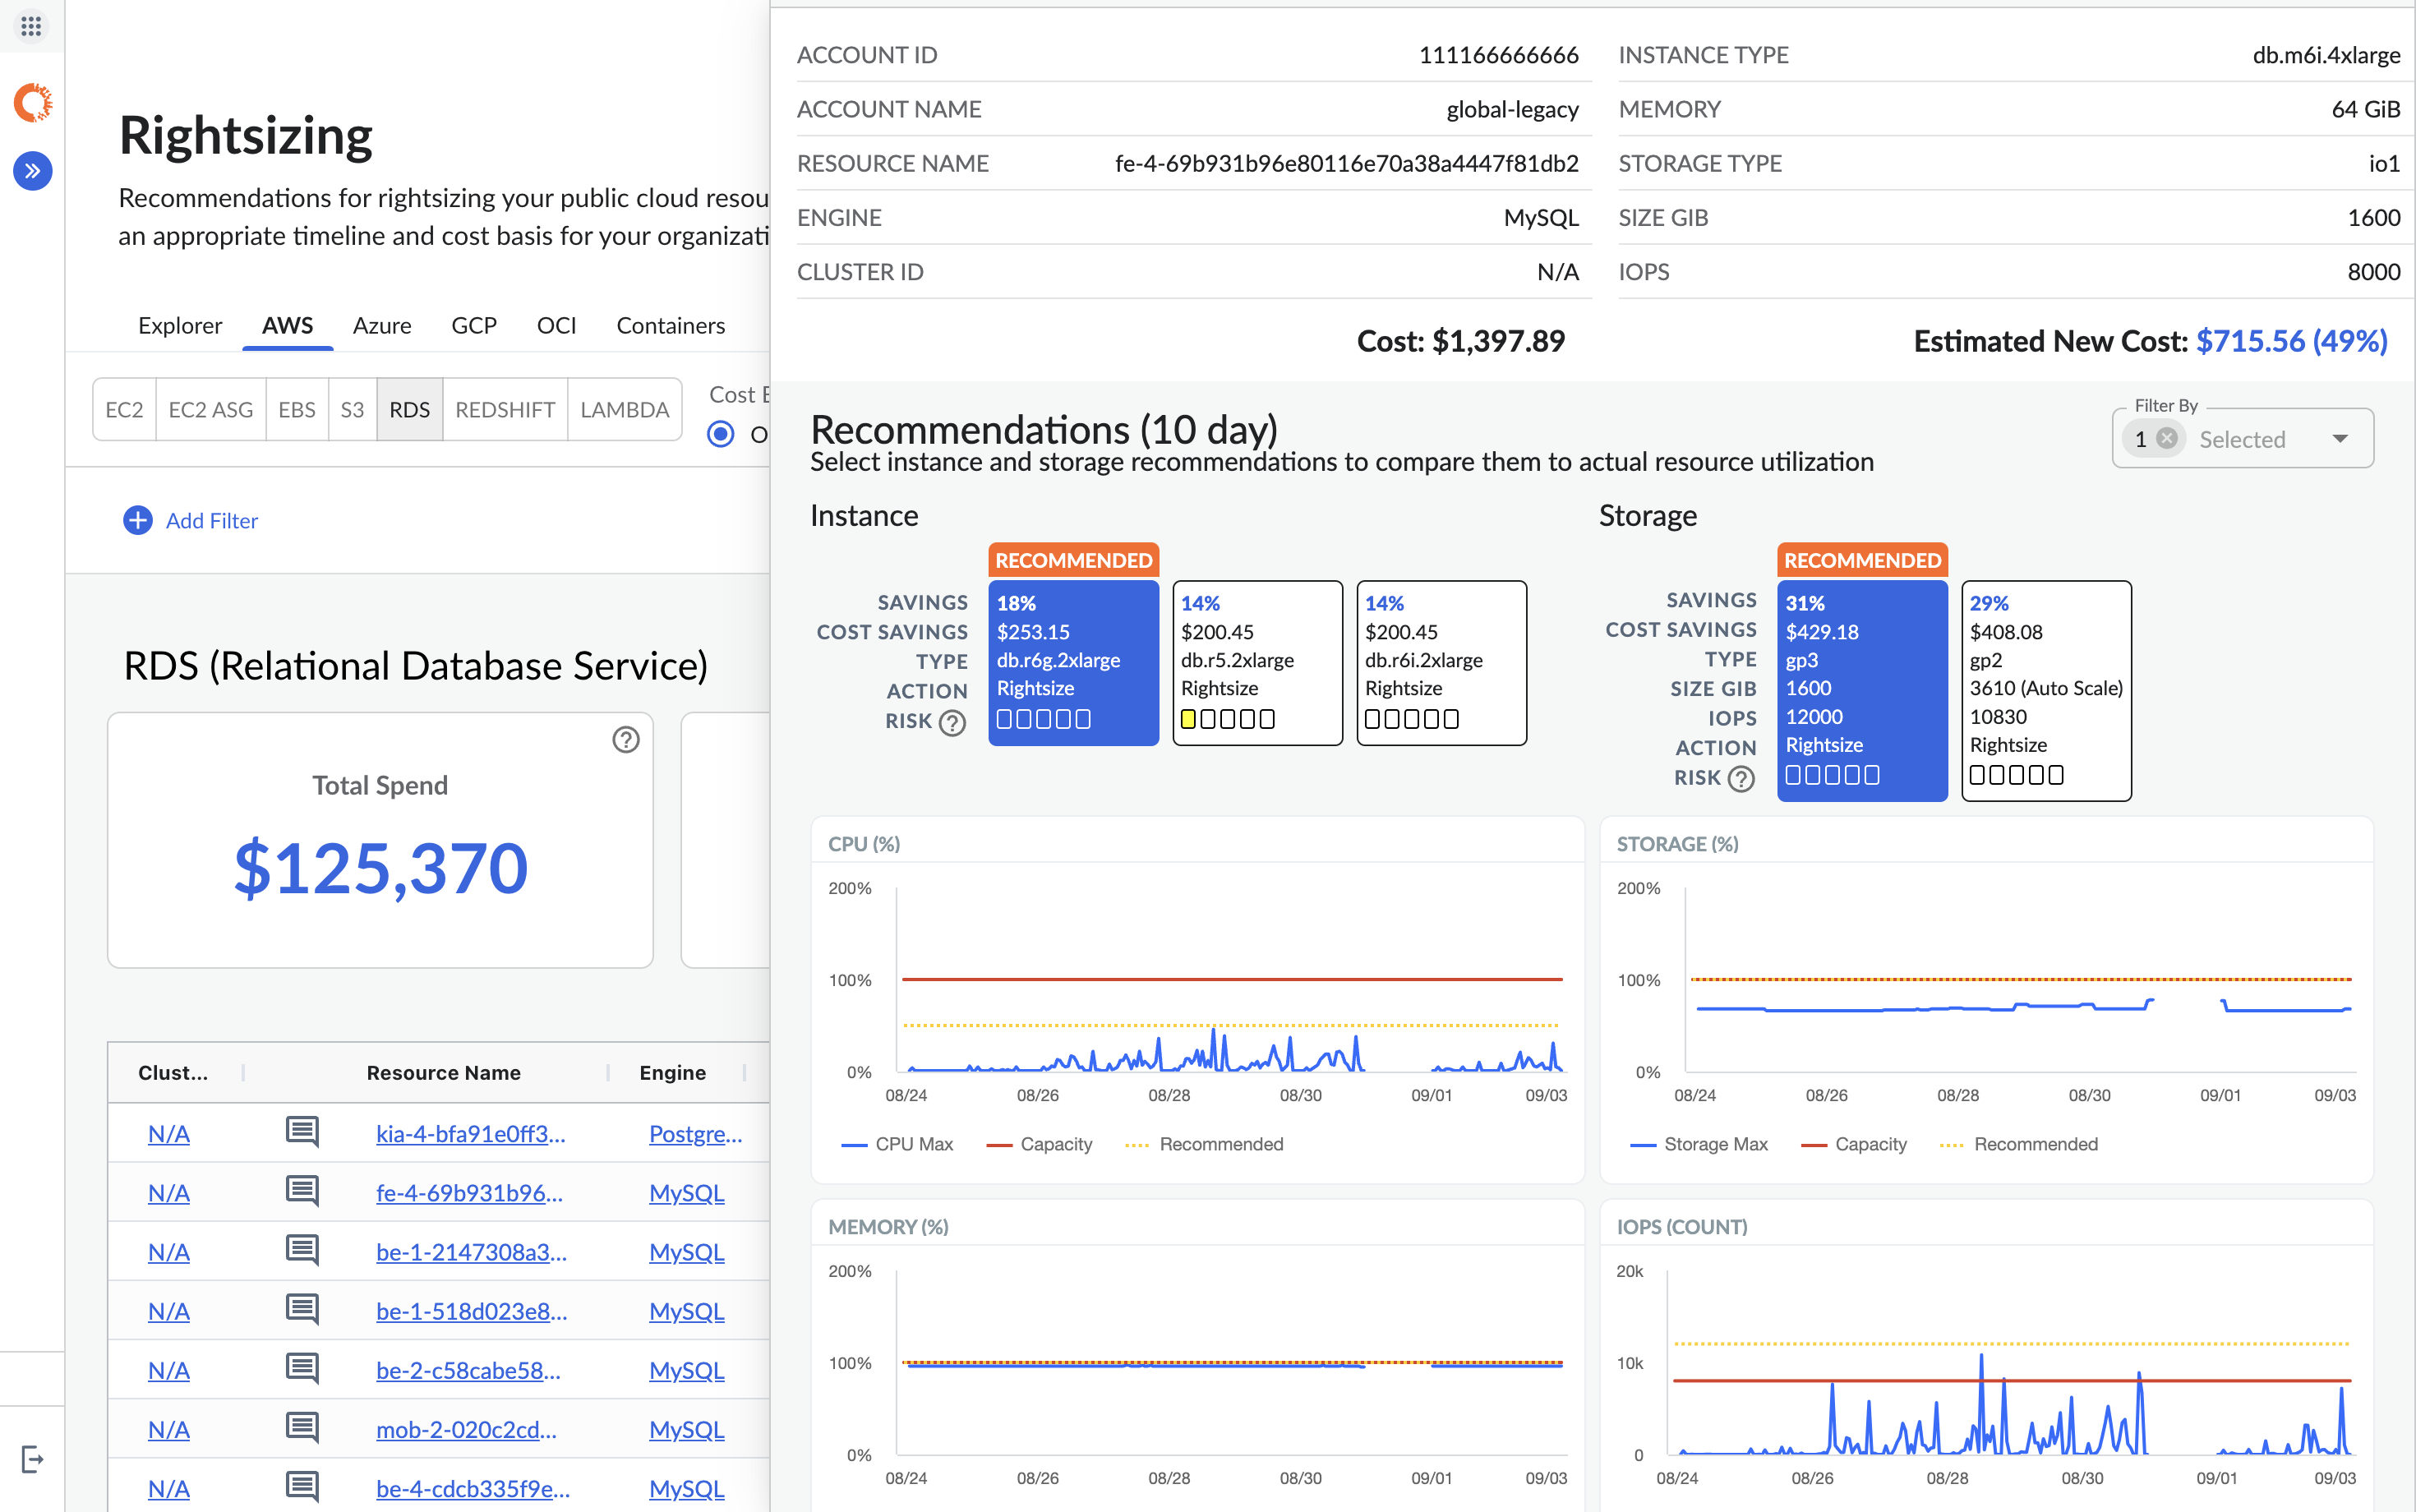
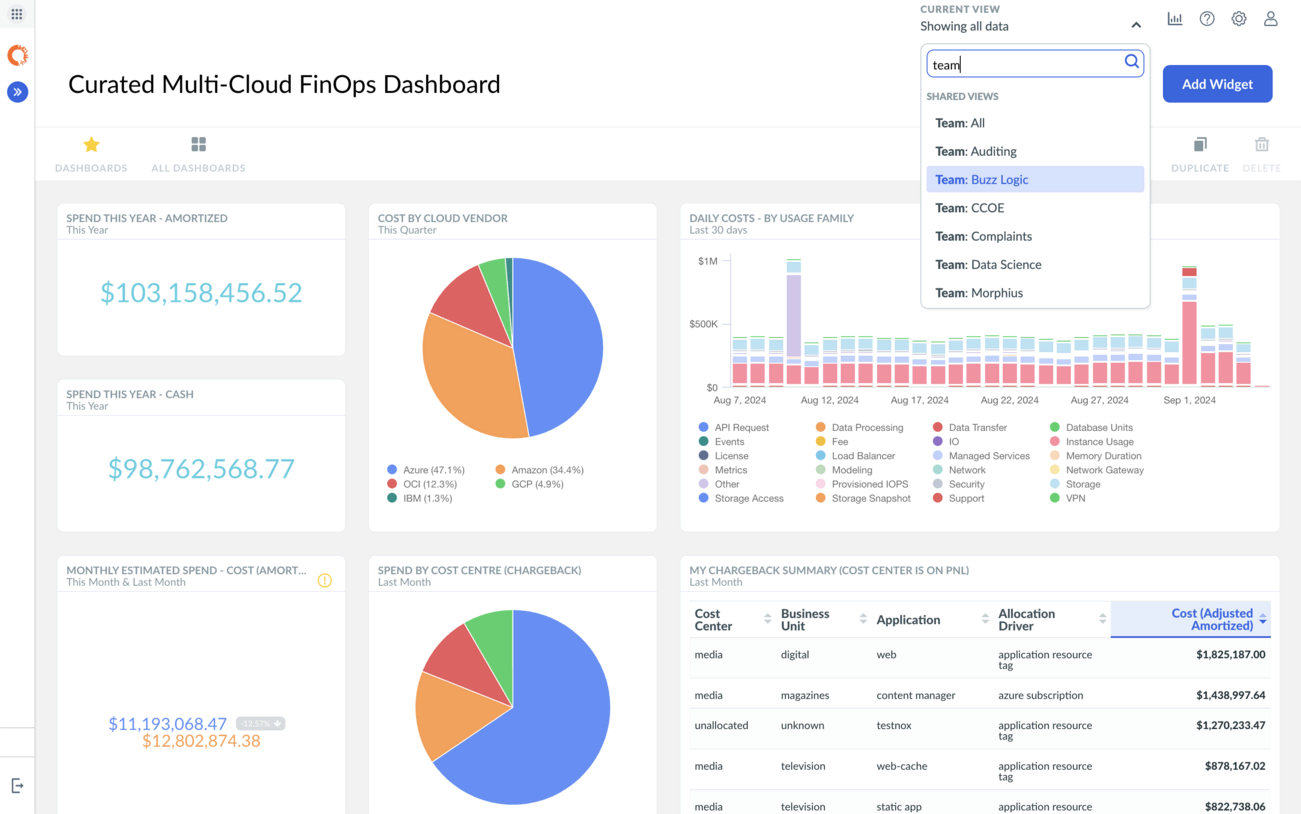
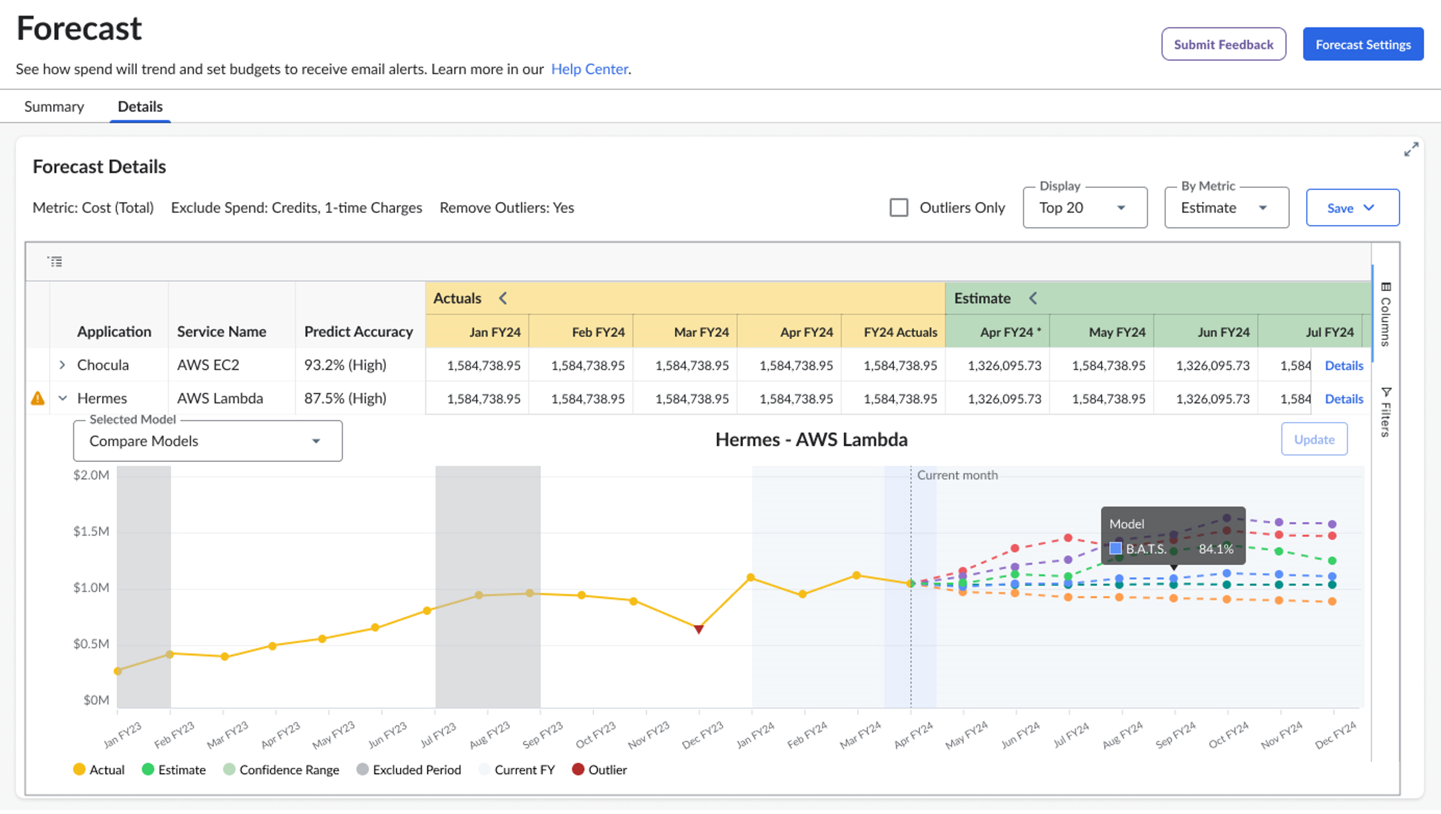
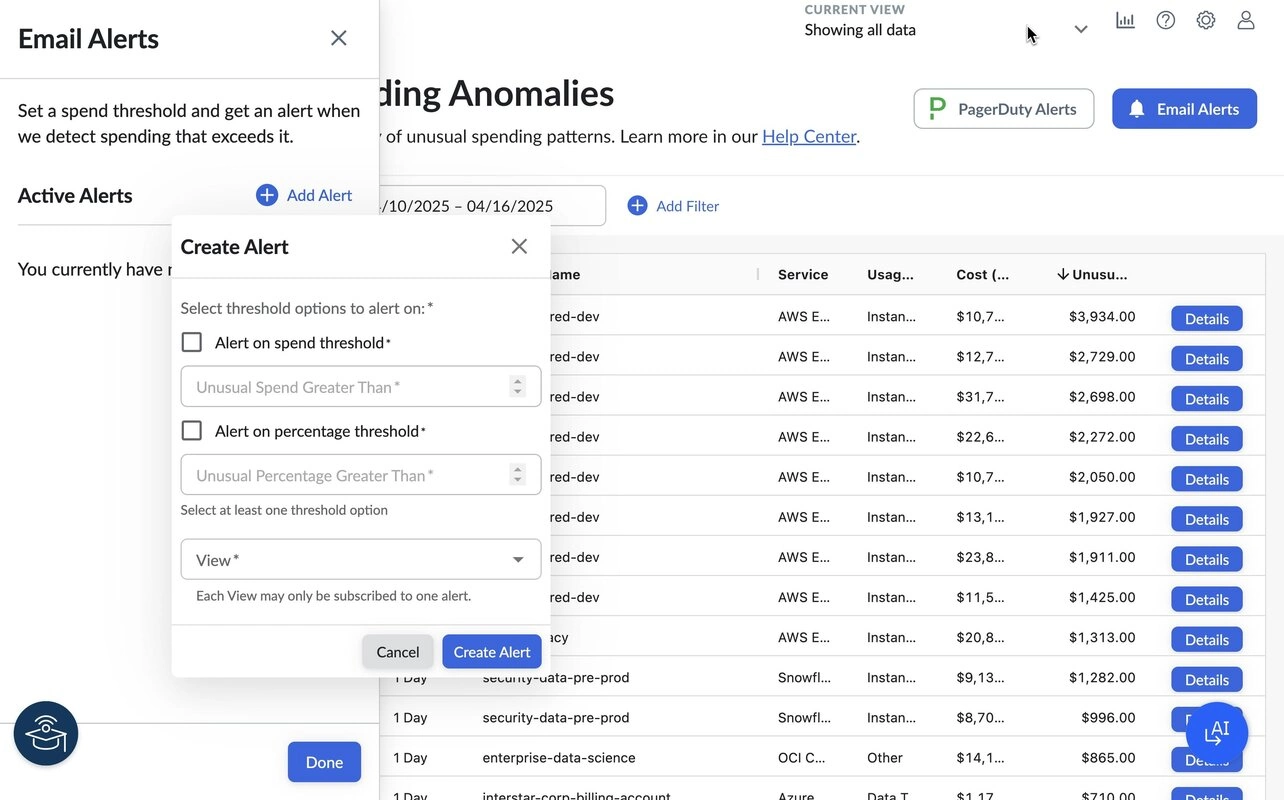
IBM Cloudability is a cloud cost management and optimization (FinOps) tool that enables IT, finance, and business teams to optimize their cloud spend across all cost sources, all maturity levels, and for all stakeholders.
N/A
ScienceLogic SL1
Score 8.8 out of 10
Enterprise companies (1,001+ employees)
ScienceLogic is a system and application monitoring and performance management platform. ScienceLogic collects and aggregates data across and IT ecosystems and contextualizes it for actionable insights with the SL1 product offering.
N/A
Pricing
IBM Cloudability
ScienceLogic SL1
Editions & Modules
No answers on this topic
No answers on this topic
Offerings
Pricing Offerings
IBM Cloudability
ScienceLogic SL1
Free Trial
Yes
No
Free/Freemium Version
No
No
Premium Consulting/Integration Services
No
Yes
Entry-level Setup Fee
No setup fee
Required
Additional Details
—
ScienceLogic SL1 offers four tiers:
SL1 Advanced – Application Health, Automated Troubleshooting and Remediation Workflows
SL1 Base – Infrastructure Monitoring, Topology & Event Correlation
SL1 Premium – AI/ML-driven Analytics, Low-Code Automated Workflow Authoring
SL1 Standard – Infrastructure Monitoring – with Agents, Business Services, Incident Automation, CMDB Synchronization, Behavioral Correlation
To get pricing for each tier, please contact the vendor.
I don't have much exposure to the tool. I mean, I'm relatively new to using it as a platform, but I haven't really seen the benefit, especially with the actual renewal talks at the company. I'm not seeing what AWS native solutions are, how probability improves on that as opposed to just using AWS and just, I don't know. I'm not seeing the benefit, at least in my eyes.
For Windows, the issue is in higher resource consumption related to WinRM monitoring, which provides better options then the SNMP monitoring, which on the other hand is less resource intensive. The problem is also with support for OS with other than English language.
For me, it is a lot of anomaly detection and I think there's a lot of improvement that can be made to show anomalies that happen over time because if it's just day to day or week to week, you may not see the change. But if you see the trend over a period of time, show me something that has grown 40%, 50% over the past three months and maybe you can do those things and we just haven't figured them out yet. So we are very new to the product, but I think anomaly detection for me is one of the bigger things.
Dashboards are quite old and are of Iron age. Need to have AP2 dashboards only instead of AP1 and consistent new design across all functionalities.
Reporting is not improved since Y2020 and need to revamp completely. Need to integrate Dashboards and Reporting. PowerBI Like functionality to be given OOTB. Reports should be extracted in Excel, PDF, HTML and should be heavily automated.
Create and Open APIs for basic and advanced monitoring data extraction.
Topology based Event Correlation and Suppression should be improved drastically. Need to identify critical network interfaces based on Topology and monitor them. Basic customization of Dynamic App and/or Powerpack to exclude/include certain metrics/events to be permitted OOTB instead of customizations.
Integration with ServiceNow to be improved and to be taken to next level. Automation Powerpack should be made available OOTB as part of base product and to be priced attractively.
Take product to next level where we can monitor actual impacted IT or Business Service instead of metrics and events BSM and Topology map to be auto discovered and identify the network dependencies and alternate paths automatically instead of manual creation of BSM.
Cloudability has been one solution for almost all of our FinOps needs. Except for Data transfer costs, we have covered all use cases and have made significant savings across our cloud infrastructure. Reporting has provided management a deeper analysis into their spending and helped them forecast their budgets for next year
It is simply because of all the best possible autonomy solutions it is providing and getting better day by day. Using AI and Devops along with handy automation, The monitoring and Management of devices becomes much easier and the way it is growing in all the aspects is one the best reasons too. Evolution of the SL1 platform in the autonomy monitoring and management is quite appreciable.
I gave the IBM Cloudability a 7/10 because it is good, but it could improve in some places. It is easy to get data uploaded and ready to view, but it is only up to a certain point in time, and not live data. As for how it looks, the interface is good for viewing, however navigation could be a little better, maybe supported with a roadmap.
The core functions are there. The complexity is due to the complexity of the space. The score is based on comfort (I no longer notice the legacy UI) and the promise that I see in the 8.12 Unified UI (a vast improvement). It is also based on the fact that with 8.12, you can now do everything in the new UI but you still have the legacy UI as a fallback (which should now be unnecessary for new installations)
SL is always there and online when you need to get info from it. The only times when SL was not available in our own data center, was when network links from out side of the data center was down and those links were not in our controll. Having a central database and people accessing it all over the world, may put a bit of constarin on the performance of the dashboards when reports gets generated, but that is far and few n between.
SceinceLogic SL1 architecture helps the platform to give a top-notch performance in every respect, Data collection to reporting happens very smoothly. With the new user interface pages load much faster. Individual appliances carrying the individual task ensure things are working without lag. Integration with ticketing tool(SNOW) is well managed by the ScienceLogic, no issue or much delay has been observed while interacting with an external tool.
While there have been few support cases where the experience was good. But in multiple support cases it's firstly delayed and even after weeks or months of time, team is not able to provide us with the RCA of the issue. All they are claiming is the issue is now fixed which I still see coming back after few days or weeks as we've never identified and addressed the root cause.
So far, it's good as part of my overall experience, except for a couple of use cases. The support team is well knowledgeable, has technical sound, and is efficient. When support escalates to engineering, the issue gets stuck and takes months to resolve.
It was good, Do the online training first and understand it and you will get the most out of the in-person training that way. This also takes you to an advanced level which is very good and the training as been overhauled once again along with new product coming in such as Zebruim / Skylar, worth going through again if it a while back that you first did this.
Training was adequate, but the real learning begins when you start using the product, like most things. All major functions were covered so as an entry point, was a good introduction to the product. The training pace was good as well, the areas were covered in decent depth, without being too much of an information overload.
There are a lot of educational materials and courses on the SL1 training site (Litmos university). However the recording quality is sometimes not very good - screen resolution is low. There is a lack of professional rather than user-oriented documents and there are mistakes in documentation and education is not well structured.
Implementation is smooth if we are to just support the out-of-the-box features available in ScienceLogic. For any custom requirement, having to go to SL1 Professional Services is the worst part of procuring this suite. And more often than not, SL1 Professional Services also ask to raise feature request. So, you subscribe to Professional Services to only hear back from them that "This feature is not supported and needs to have a separate feature request". At times frustrating.
Before Apptio we extensively used the cloud native and in house automated and developed cost optimization tool using python , powershell and leveraging the various cloud native services like AWS systems manager , Azure Functions and Azure automation run books.
Science logic SL1 is so user friendly and it's really easy to navigate between function. I would recommend Sciene logic SL1 to all of them who are looking for really useful monitoring tool and expecting easy way of managing it.
Our deployment model is vastly different from product expectations. Our global / internal monitoring foot print is 8 production stacks in dual data centers with 50% collection capacity allocated to each data center with minimal numbers of collection groups. General Collection is our default collection group. Special Collection is for monitoring our ASA and other hardware that cannot be polled by a large number of IP addresses, so this collection group is usually 2 collectors). Because most of our stacks are in different physical data centers, we cannot use the provided HA solution. We have to use the DR solution (DRBD + CNAMEs). We routinely test power in our data centers (yearly). Because we have to use DR, we have a hand-touch to flip nodes and change the DNS CNAME half of the times when there is an outage (by design). When the outage is planned, we do this ahead of the outage so that we don't care that the Secondary has dropped away from the Primary. Hopefully, we'll be able to find a way to meet our constraints and improve our resiliency and reduce our hand-touch in future releases. For now, this works for us and our complexity. (I hear that the HA option is sweet. I just can't consume that.)
Once a powerpack is developed and configured for a device for one customer, it is easy to deploy the same powerpack on a second customer estate and configure specifically for that customer without having to reinvent the powerpack. This saves time and therefore money.
Once the customer estate tuning is complete, the Operations team have come trust the alerts. This is especially true when transient or self-correcting alerts are automatically cleared without ops team involvement, but a record is still available for audit and debugging purposes. This saves time and therefore money.
When setup correctly, it provides good visibility into applications, devices and whole customer estates. This saves time and therefore money when issues arise.