Looker vs. ThoughtSpot

Overview
ProductRatingMost Used ByProduct SummaryStarting Price
Looker
Score 8.3 out of 10
N/A
Looker is a BI application with an analytics-oriented application server that sits on top of relational data stores. It includes an end-user interface for exploring data, a reusable development paradigm for data discovery, and an API for supporting data in other systems.N/A
ThoughtSpot
Score 8.5 out of 10
N/A
ThoughtSpot is an Agentic Analytics Platform for enterprises where users ask data questions using natural language and get answers with AI. Code-first for data teams and code-free for business users, ThoughtSpot can handle large, complex cloud data at scale.
$50
per month (billed annually) per user (25-1000 users)
Pricing
LookerThoughtSpot
Editions & Modules
No answers on this topic
Thoughtspot Analytics - Pro
$50
per month (billed annually) per user (25-1000 users)
Thoughtspot Analytics - Enterprise
Custom
Offerings
Pricing Offerings
LookerThoughtSpot
Free Trial
YesYes
Free/Freemium Version
NoYes
Premium Consulting/Integration Services
NoNo
Entry-level Setup FeeRequiredOptional
Additional DetailsMust contact sales team for pricing.
More Pricing Information
Community Pulse
LookerThoughtSpot
Considered Both Products
Looker
Chose Looker
Looker seems friendlier and more accessible.
Chose Looker
Looker was the most customizable option for our business and cost wise made the most sense. They do have a free tier option that some of the other weren't offering to us at the time. Looker has a great- mobile app solution while tableau is a desktop-based platform. Tableau also …
Chose Looker
The biggest advantage that Looker Studio has is that it's really easy to use and to distribute to other use. You can have a really complex report set up in a couple of minutes with an extract data source that enables Looker to update really fast.
Chose Looker
Looker is less complex to use and links directly to google suite which we use across the business and personally think is a better user experience than microsoft.
Chose Looker
We have not used any other products; we've only ever needed to use Looker Studio and didn't need to demo anything else because it provided everything we needed.
Chose Looker
Looker stacks up well against other data providers for usability and friendly interfaces, plus the ability to customise. We actually integrate Looker with other analytics tools in the same sphere (power bi, dreamdata and others) so that we can have one comprehensive dashboard …
Chose Looker
In my opinion, Looker is no Power BI. It is good, but I think Power BI is amazing. That said, in my experience, Power BI is nowhere near as easy to setup and report on Google services as Looker is. We plan to continue using Power BI for c-suite and corporate reporting, …
Chose Looker
Looker is a free and easier analytics and dashboard tool. It provides enough data and features to get things done and analyze marketing data. The other tools have more advanced features and are more suited for other things besides marketing.
Chose Looker
Tableau provides additional visual functionality and is great for more in-depth visuals or further data exploration, but it is costly and an extremely robust solution for simple data reporting. Looker can't be beat when it comes to integrating with other G-Suite tools. All in …
Chose Looker
Looker is a lot less overwhelming and lets you take the data that you have in Google analytics to make it understandable, focused and specific to the audience that is viewing the content. I haven’t used any other tools, but feel because of the ease of accessibility and cost, …
Chose Looker
I prefer agency analytics as it has a lot more agnostic integration options and is much speedier but does come at a cost. I would recommend this over Looker studio for sure. It has great templates to use too and allows for more customisation and racing benchmarks which is a …
Chose Looker
We'll still use Semrush's reporting for some clients - depending on the metrics which are important for them and whether they have an interest in live reporting or simply monthly PDF reports.
Chose Looker
If you company is using Google suite products, Looker is a no-brainer. Tableau is probably the most flexibly but as a result it has the least governance capabilities. Power BI is kind of old-school in terms of how it feels to use it. I think in general, Looker brings a lot of …
Chose Looker
Better in terms of data configuration with slight harder learning curve, available help material is not that much and we usually have to connect with Looker Help with chat for our data and analysis questions. While Looker offers a wide range of visualization options, there were …
Chose Looker
Looker Studio, you can easily report on data from various sources without programming. Looker Studio is available at no charge for creators and report viewers. Enterprise customers who upgrade to Looker Studio Pro will receive support and expanded administrative features, …
Chose Looker
It takes forever sometimes to have data ready in tableau dashboard, and also it takes effort to maintain each dashboards. We do not have so many efforts to maintain all. Also, we need to be able to see data faster and therefore take actions and work faster. With Looker we might …
Chose Looker
Looker gives you options to integrate external APIs with great ease. Our data analytics team is able to easily use multiple data sources as input to the Looker dashboard, and everything is consolidated in one single Dashboard. You also have an option for Shared folders to be …
Chose Looker
I chose Looker because can incorporate multiple sources, mostly which are Google owned. The data can sync automatically, and the graphs are visually appealing.
Chose Looker
Looker Studio is not as robust as Tableau or Microsoft BI. So it does not provide quite as much insight or depth and it has more limitations overall then the other major reporting products. However, it is also free and connects perfectly with other Google products. Plus, all of …
Chose Looker
Technically, Power BI is much more complete and powerful, but it's like an ocean liner. I didn't need all that equipment. In my case, I needed to move more quickly, like on a speedboat, to build a page with several data sources in a single source of truth that could be easily …
Chose Looker
Looker is a free tool to use on the basic level, which can't really compare apples to apples since all of the other services are paid services. Looker already has a leg up because of that. The other platforms definitely have more features and capabilities off the bat because it …
ThoughtSpot
Chose ThoughtSpot
Great ease of use for business users and self-service capabilites
Chose ThoughtSpot
It stacks up well against these modern BI tools. These are the most popular tools and its ability to perform well with live connections gives it an advantage. However, having more control over formatting/customization would allow it to go further. Plus, developing a stronger …
Chose ThoughtSpot
I think PBI was terribly slow and clunky. UI was outdated. Solution was expensive for what we needed. ThoughtSpot was worlds different (in a better way).
Chose ThoughtSpot
They’re for different use cases. When I want a dynamic way to quickly obtain the data I need, I’d go with ThoughtSpot.
Chose ThoughtSpot
It is more flexible and PowerBI, easier work online, and share information with many users. Also the dashboards and beautiful, and the user experience is better. Performance used to be faster.

We use Looker for different use cases but, when it comes to reporting and sharing …
Chose ThoughtSpot
ThoughtSpot's user friendly interface, faster and accurate results, low-code support for building insights and vast availability of native charts, AI powered dashboards helps in faster decision making and helps in driving better business results. The mobile APP that ThoughtSpot …
Chose ThoughtSpot
It is more cost effective when compared to Tableau and more easy to use. ThoughtSpot integrates well with modern cloud data platforms like Snowflake, Google, and Bigquery, making it easy to analyze large datasets in real time. Sync insights into cloud tools. Users can sync …
Chose ThoughtSpot
ThoughtSpot provided a twist on the typical Analytics / report builder interface. The natural language query building is just so much easier to use.
Chose ThoughtSpot
ThoughtSpot is easy to build charts and it is probably the easiest tool to build things quickly. The quality of the charts is middle if not lower pack compared to others. The dbt integration is wildly oversold and does not add any value.
Chose ThoughtSpot
ThoughtSpot can handle large datasets A LOT better.
Chose ThoughtSpot
ThoughtSpot was much easier from an end-user perspective. Looker and Tableau allowed for more customization and detailed dashboards.
Chose ThoughtSpot
Thoughtspot is a fairly new tool when compared to Tableau. I'll just list the benefits of each one of threse below -
Tableau -
1. Much more customizable the Thoughtspot
Chose ThoughtSpot
Have not used as much, tried ThoughtSpot out for the first time for evaluation and testing purposes to see if this type of software would be helpful.
Chose ThoughtSpot
we were looking for something which provides self service capabilities and something which very eay to use from users perspective.
Chose ThoughtSpot
I liked thought spot because of the ad-hoc capabilities and their search functionality.
Chose ThoughtSpot
ThoughtSpot is more powerful of a tool than something like QlikView or QlikSense with the correct training.
Chose ThoughtSpot
ThoughtSpot is my top choice from the above two as the UI is the most modern and user-friendly as well.
Chose ThoughtSpot
ThoughtSpot is the leader in embedded analytics and is much easier to work with massive volumes of data. None of the other tools listed had both of those functionalities, which were most important to us. There are other features that they have such as easier drill down, …
Chose ThoughtSpot
much more extensible and much easier to embed
Chose ThoughtSpot
Compare to Kibana, which was we used previously, ThoughtSpot is definitely better in terms of UI, visualizations, usability, and the SpotIQ/ML components. The only disadvantage for ThoughtSpot is the lack of drill-down function/click-on filters.
Chose ThoughtSpot
The main reason for selecting Thoughtspot was to share reporting with other external vendors and ease of doing business.
Chose ThoughtSpot
We have been using tableau as the enterprise reporting tool and felt sending data to external people had few restrictions hence we tried with ThoughtSpot.
Chose ThoughtSpot
ThoughtSpot can similarly generate tables, visuals, and dashboards in Tableau, but in a faster and easier way.
Chose ThoughtSpot
We liked the support we were getting in the sales process (this has continued to be fantastic), I personally knew several people in the company. In the pilot we ran, our devs enjoyed working with ThoughtSpot.
Features
LookerThoughtSpot
BI Standard Reporting
Comparison of BI Standard Reporting features of Product A and Product B
Looker
7.5
Ratings
9% below category average
ThoughtSpot
7.3
Ratings
11% below category average
Pixel Perfect reports6.50 Ratings6.00 Ratings
Customizable dashboards8.30 Ratings8.20 Ratings
Report Formatting Templates7.50 Ratings7.70 Ratings
Ad-hoc Reporting
Comparison of Ad-hoc Reporting features of Product A and Product B
Looker
6.9
Ratings
15% below category average
ThoughtSpot
7.5
Ratings
7% below category average
Drill-down analysis6.50 Ratings8.40 Ratings
Formatting capabilities6.70 Ratings7.10 Ratings
Integration with R or other statistical packages5.70 Ratings5.80 Ratings
Report sharing and collaboration8.80 Ratings8.70 Ratings
Report Output and Scheduling
Comparison of Report Output and Scheduling features of Product A and Product B
Looker
8.0
Ratings
2% below category average
ThoughtSpot
8.2
Ratings
0% above category average
Publish to Web7.70 Ratings8.20 Ratings
Publish to PDF7.90 Ratings8.50 Ratings
Report Versioning7.90 Ratings7.90 Ratings
Report Delivery Scheduling8.40 Ratings8.30 Ratings
Delivery to Remote Servers00 Ratings8.00 Ratings
Data Discovery and Visualization
Comparison of Data Discovery and Visualization features of Product A and Product B
Looker
6.6
Ratings
19% below category average
ThoughtSpot
7.3
Ratings
9% below category average
Pre-built visualization formats (heatmaps, scatter plots etc.)7.70 Ratings7.50 Ratings
Location Analytics / Geographic Visualization7.50 Ratings7.20 Ratings
Predictive Analytics4.60 Ratings7.50 Ratings
Pattern Recognition and Data Mining00 Ratings6.90 Ratings
Access Control and Security
Comparison of Access Control and Security features of Product A and Product B
Looker
7.4
Ratings
14% below category average
ThoughtSpot
8.1
Ratings
5% below category average
Multi-User Support (named login)7.60 Ratings8.20 Ratings
Role-Based Security Model7.30 Ratings8.00 Ratings
Multiple Access Permission Levels (Create, Read, Delete)7.30 Ratings7.70 Ratings
Report-Level Access Control7.40 Ratings7.90 Ratings
Single Sign-On (SSO)00 Ratings8.70 Ratings
Mobile Capabilities
Comparison of Mobile Capabilities features of Product A and Product B
Looker
5.3
Ratings
37% below category average
ThoughtSpot
7.3
Ratings
6% below category average
Responsive Design for Web Access5.10 Ratings7.10 Ratings
Mobile Application5.00 Ratings6.80 Ratings
Dashboard / Report / Visualization Interactivity on Mobile5.90 Ratings6.80 Ratings
Application Program Interfaces (APIs) / Embedding
Comparison of Application Program Interfaces (APIs) / Embedding features of Product A and Product B
Looker
-
Ratings
ThoughtSpot
7.2
Ratings
7% below category average
REST API00 Ratings7.10 Ratings
Javascript API00 Ratings6.70 Ratings
iFrames00 Ratings8.10 Ratings
Java API00 Ratings7.00 Ratings
Themeable User Interface (UI)00 Ratings7.20 Ratings
Customizable Platform (Open Source)00 Ratings7.10 Ratings
Best Alternatives
LookerThoughtSpot
Small Businesses
Yellowfin
Yellowfin
Score 8.6 out of 10
Yellowfin
Yellowfin
Score 8.6 out of 10
Medium-sized Companies
Reveal
Reveal
Score 10.0 out of 10
Reveal
Reveal
Score 10.0 out of 10
Enterprises
Kyvos Semantic Layer
Score 9.5 out of 10
Kyvos Semantic Layer
Score 9.5 out of 10
All AlternativesView all alternativesView all alternatives
User Ratings
LookerThoughtSpot
Likelihood to Recommend
8.3
(0 ratings)
8.5
(0 ratings)
Likelihood to Renew
9.2
(0 ratings)
10.0
(0 ratings)
Usability
8.8
(0 ratings)
8.2
(0 ratings)
Availability
10.0
(0 ratings)
9.0
(0 ratings)
Performance
6.0
(0 ratings)
8.0
(0 ratings)
Support Rating
8.8
(0 ratings)
8.0
(0 ratings)
In-Person Training
-
(0 ratings)
5.0
(0 ratings)
Online Training
-
(0 ratings)
4.0
(0 ratings)
Implementation Rating
10.0
(0 ratings)
7.0
(0 ratings)
Configurability
10.0
(0 ratings)
8.0
(0 ratings)
Ease of integration
10.0
(0 ratings)
9.0
(0 ratings)
Product Scalability
10.0
(0 ratings)
8.0
(0 ratings)
Vendor post-sale
10.0
(0 ratings)
8.0
(0 ratings)
Vendor pre-sale
10.0
(0 ratings)
9.0
(0 ratings)
User Testimonials
LookerThoughtSpot
Likelihood to Recommend
When data drives potential for new orders, Looker earns its place in our tech stack. If, on the other hand, we are hoping for pipeline generation, Looker is useful if you are willing to repeatedly go check customer utilizations .... it is not appropriate if you are hoping to automate data analysis for this purpose.
Read full review
By using the power of cloud platforms like bigquery or snowflake, ThoughtSpot can deliver performance at scale ensuring that even the largest organization can quickly analyze and visualize data. The ability to seamlessly share live dashboards fosters collaborations, ensuring everyone in the organization is working from the same data source and aligned in decision making.
Read full review
Pros
  • It is very easy to start a new dashboard and configure what you want to display by just selecting/dragging from the list of available columns.
  • It is intuitive, mainly if you use other Google services like Google Sheets.
  • The look and feel is modern and nice.
  • It it very useful to have an immediate visual overview of the data in a spreadsheet.
Read full review
  • Beautiful visualizations. The visuals are distinct, clean, and easy to discern from one another.
  • Intelligent querying functionality. When looking to manipulate the data, the search function makes it easy to manipulate the features in the data, along with aggregating them in the way you'd like.
  • Embedding! It has been a smooth process thus far for our product & technical teams to work with ThoughtSpot and bring it into our product.
Read full review
Cons
  • I wish I could get more granular in the Google ad data, such as down to the campaign type, instead of having to see only all campaigns.
  • The setup can be time-consuming if you're not using the product regularly.
  • Editing the dashboard requires a few logins; I wish it was more seamless.
Read full review
  • It would be great if ThoughtSpot can add the feature to filter by clicking on visualizations. i.e if I click on a particular data point in the chart if the full dashboard can filter just for that particular data point.
  • Color coding the heatmap with different colors like green to orange to red.
Read full review
Likelihood to Renew
We are very haooy with Looker, it provides us with all the funciomalities we need for both the day to day oerformance tracking and longer periods reporting. It is easy to use for account managers, configurable and customizable for soecialists and what is most imoortant, our clinets generally really love it
Read full review
We have had success with the initial use cases and there are more use cases that can receive return on investment. I don't give it a 10 because other products like Tableau are building functionality that may start to compete in the coming years.
Read full review
Usability
Looker is relatively easy to use, even as it is set up. The customers for the front-end only have issues with the initial setup for looker ml creations. Other "looks" are relatively easy to set up, depending on the ETL and the data which is coming into Looker on a regular basis.
Read full review
The tool is easy to use if you know what you are doing and looking for. I know as they work towards improvements and simple language it will become even easier, but as of now they are doing a great job but there is room for improvement.
Read full review
Reliability and Availability
No objections
Read full review
it's available unless there is a server or system update etc. sometimes the timing of this is bad (for example during a month end close)
Read full review
Performance
Somehow resources heavy, both on server and client. I recommned at least 50Mbs data rate and high performance desktop comouter to be abke to run comolex tasks and configure larger amount of data. On the other hand, the client does not need to worry when viewing, the performance is usually ok
Read full review
It does what it is supposed to. Would be nice to have a bit more insights
Read full review
Support Rating
Never had to work with support for issues. Any questions we had, they would respond promptly and clearly. The one-time setup was easy, by reading documentation. If the feature is not supported, they will add a feature request. In this case, LDAP support was requested over OKTA. They are looking into it.
Read full review
I give it this meeting because the team is not only help able to help us in the current solutions but also amazing and taking feedback and feeding it back to their development team which includes more products and features into ThoughtSpot
Read full review
In-Person Training
No answers on this topic
inhouse in-person training. Took a bit to long to get the basics.
Read full review
Online Training
No answers on this topic
poor instructions
Read full review
Implementation Rating
Very satisfied, easy to implement
Read full review
Understand use case and model and design accordingly
Read full review
Alternatives Considered
In my opinion, Looker is no Power BI. It is good, but I think Power BI is amazing. That said, in my experience, Power BI is nowhere near as easy to setup and report on Google services as Looker is. We plan to continue using Power BI for c-suite and corporate reporting, especially for internal databases, but will gladly use Looker for our marketing information for AdWords, Analytics, Search Console, and YouTube.
Read full review
It is more flexible and PowerBI, easier work online, and share information with many users. Also the dashboards and beautiful, and the user experience is better. Performance used to be faster. We use Looker for different use cases but, when it comes to reporting and sharing information, ThoughSpot is much better.
Read full review
Scalability
No answers on this topic
Because it is very reliable, inside the situation, we need strong internet connection to access a lot of data but easily never had any downtime except during the upgrades
Read full review
Return on Investment
  • Other than some people not liking the numbers, I don't see any negative impacts; we haven't experienced that.
  • The reports help us unravel the story of our users and how they are sifting through our pages.
  • Our clients enjoy seeing the numbers to understand better what stands out on their sites.
  • The reports have helped us see what campaigns are working and where we need to tweak things.
  • The reports have enabled us to have better conversations with stakeholders about how their web pages should be modified, edited, etc., to reflect the data.
Read full review
  • Time to market ROI is massive vs hiring the full-time dedicated team to build and maintain a frontend multi-tenant SaaS data viz product.
  • It will be interesting to see over time how the advanced features play out in terms of usability and end value, such as Natural Search, which we are very excited about, and the machine learning tools.
Read full review
ScreenShots

Looker Screenshots

Screenshot of a Looker dashboard with a geo chart.

ThoughtSpot Screenshots

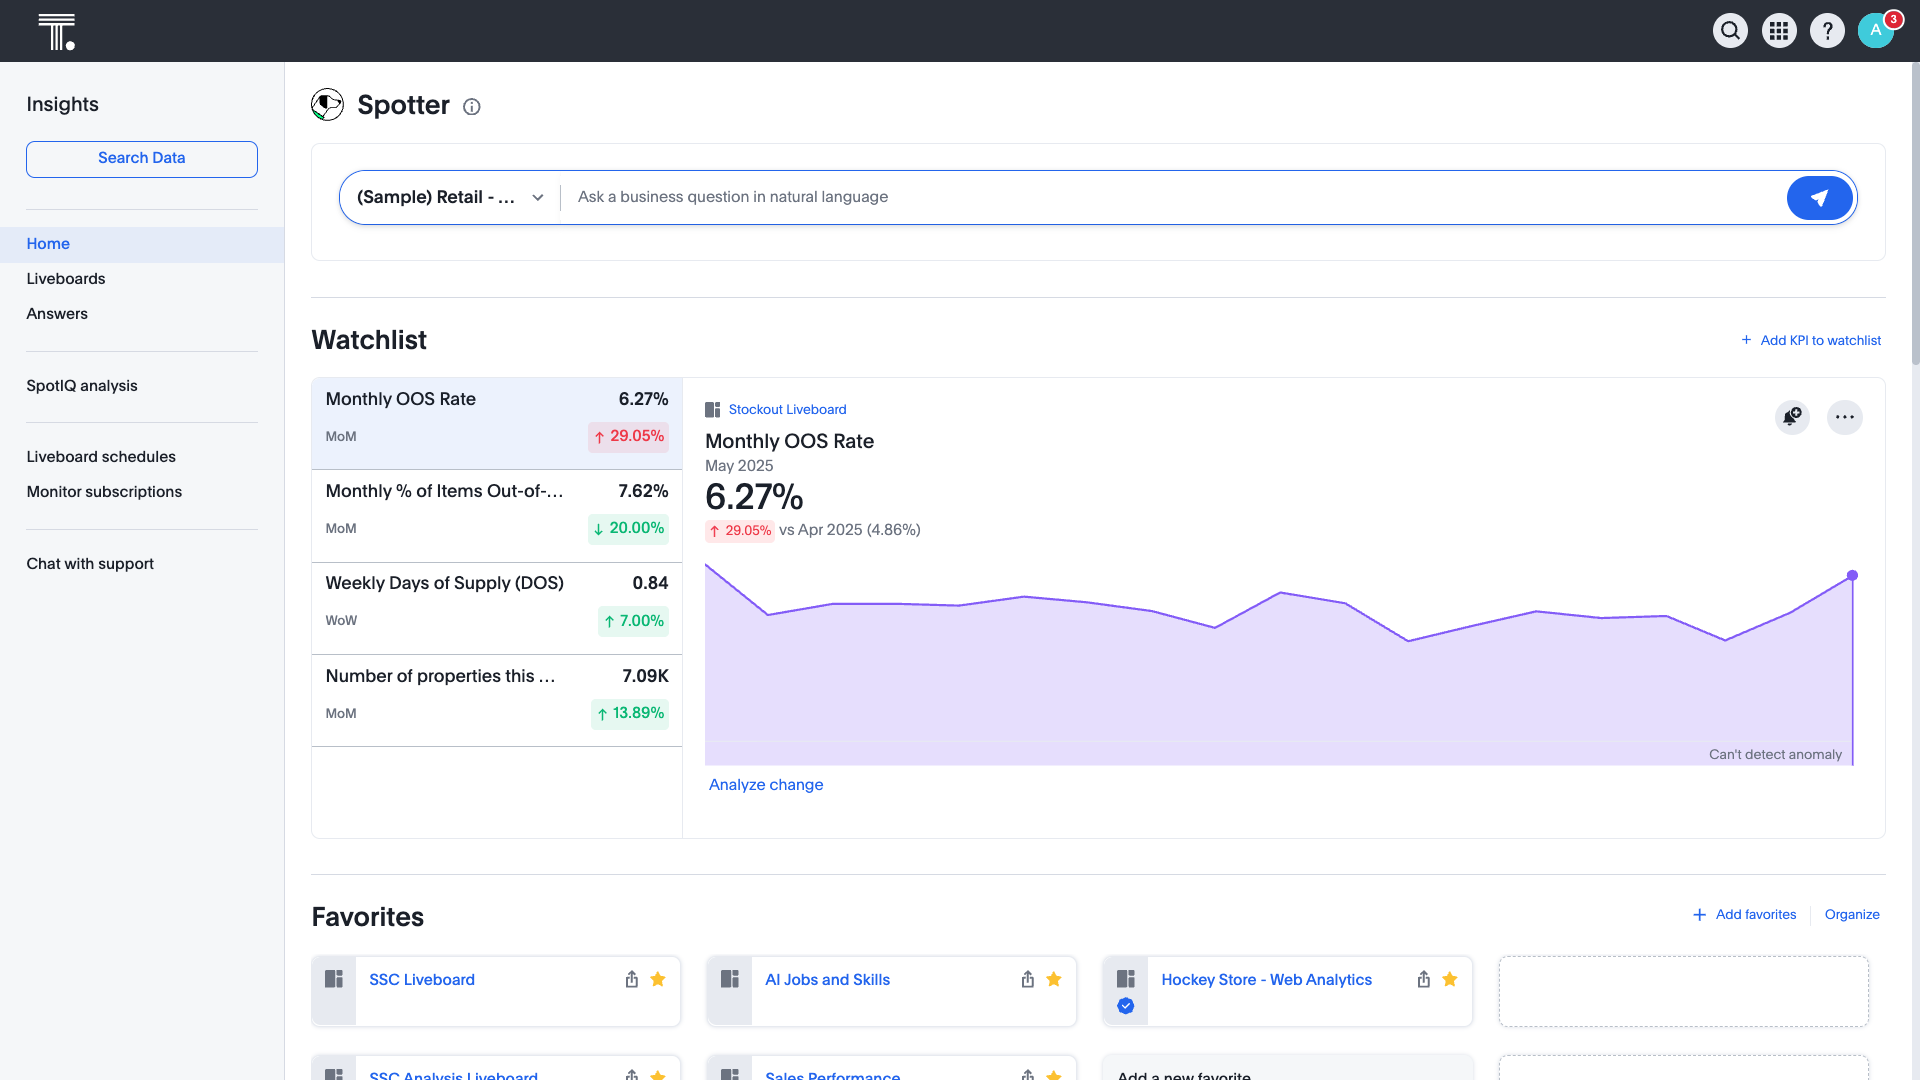
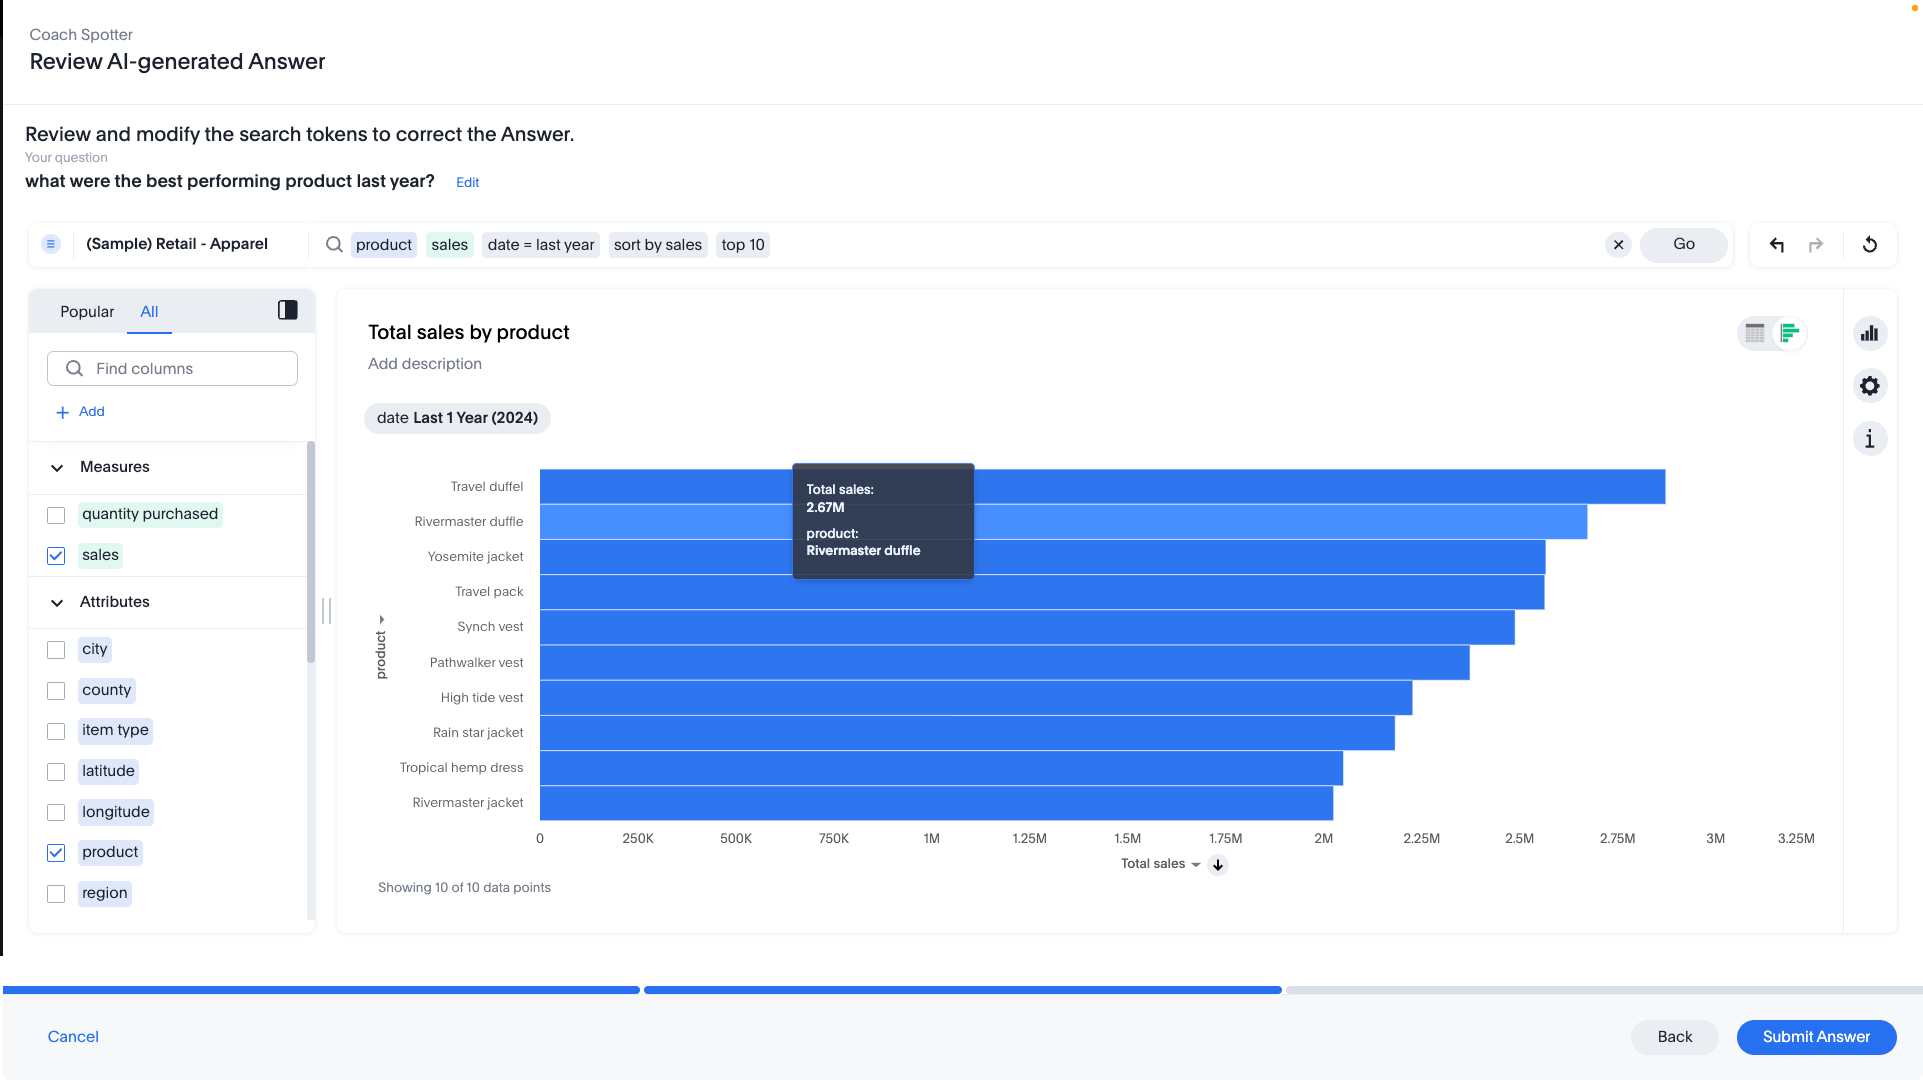
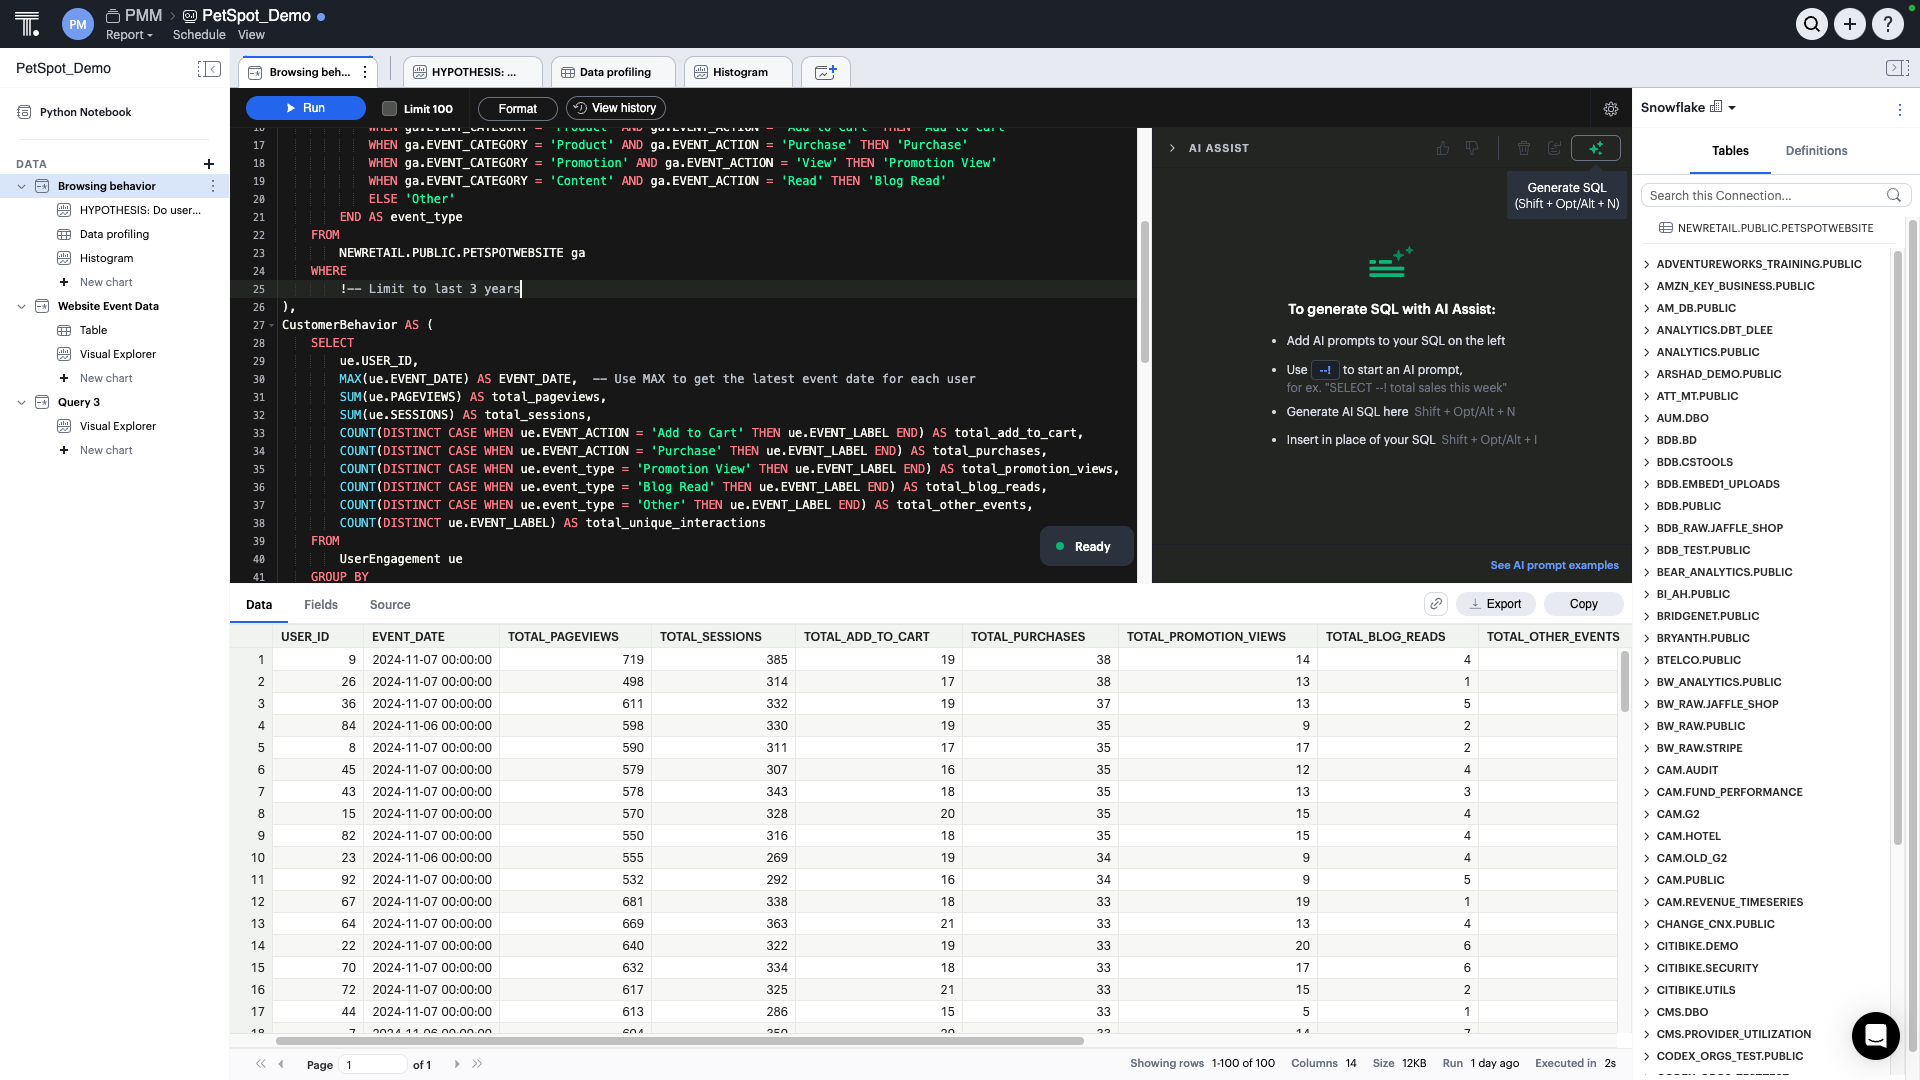
Screenshot of the ThoughtSpot home screenScreenshot of SpotIQ, which offers AI-driven insightsScreenshot of the Spotter AI agent that surfaces insights through natural language queriesScreenshot of AI Assist producing SQL in real timeScreenshot of SpotIQ, which offers AI-driven insightsScreenshot of the integration with dbt models and metrics