ScienceLogic is a system and application monitoring and performance management platform. ScienceLogic collects and aggregates data across and IT ecosystems and contextualizes it for actionable insights with the SL1 product offering.
N/A
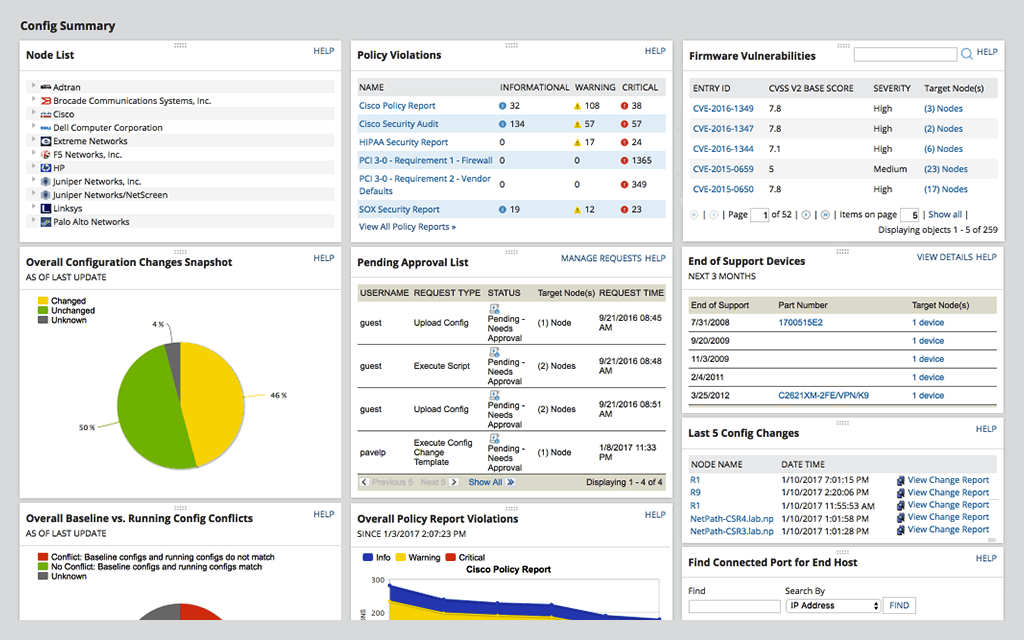
SolarWinds Network Configuration Manager (NCM)
Score 8.4 out of 10
N/A
SolarWinds Network Configuration Manager is network diagnostics and troubleshooting technology, from Austin-based SolarWinds.
N/A
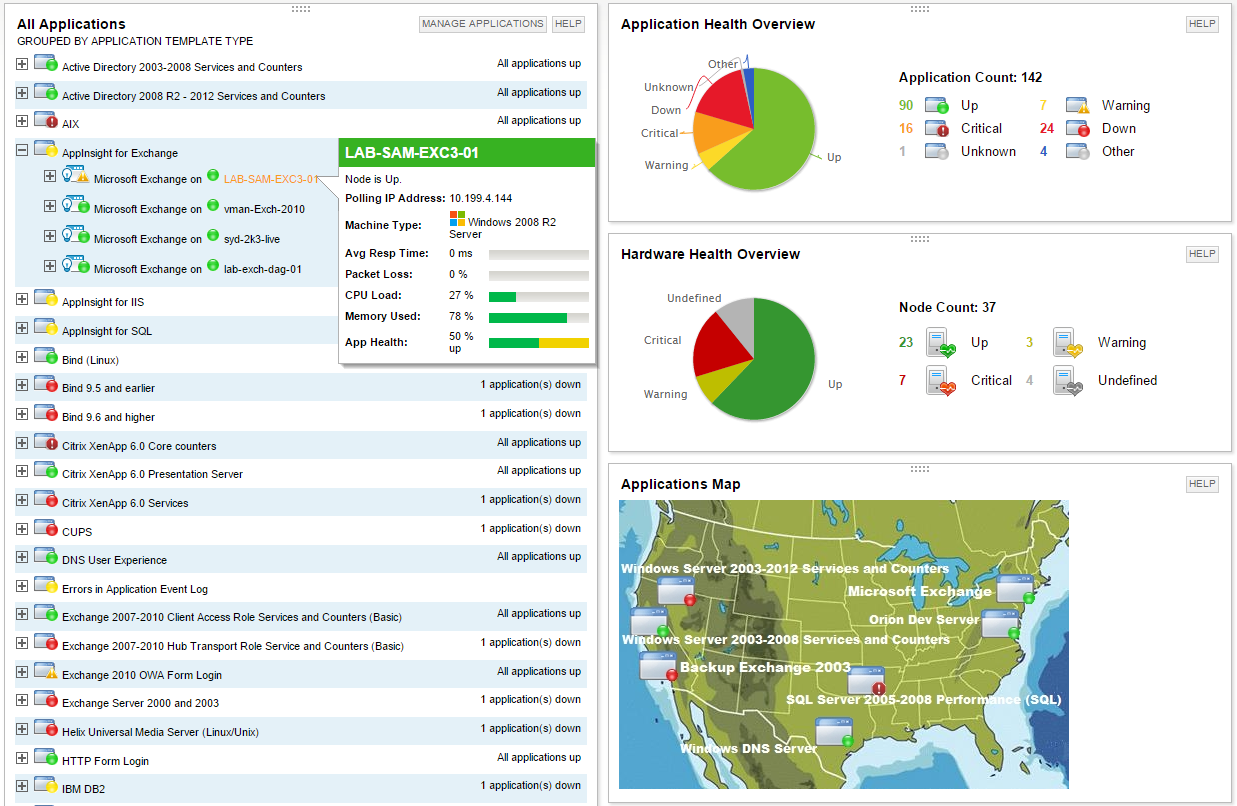
SolarWinds Server & Application Monitor
Score 7.7 out of 10
N/A
SolarWinds Server & Application Monitor (SAM) delivers application and server monitoring capabilities. SAM allows for self-service for easy setup, 1200+ monitoring templates, and customization options, as well as integrate with other SolarWinds products.
N/A
Pricing
ScienceLogic SL1
SolarWinds Network Configuration Manager (NCM)
SolarWinds Server & Application Monitor
Editions & Modules
No answers on this topic
No answers on this topic
No answers on this topic
Offerings
Pricing Offerings
ScienceLogic SL1
SolarWinds Network Configuration Manager (NCM)
SolarWinds Server & Application Monitor
Free Trial
No
Yes
Yes
Free/Freemium Version
No
No
No
Premium Consulting/Integration Services
Yes
No
No
Entry-level Setup Fee
Required
Optional
No setup fee
Additional Details
ScienceLogic SL1 offers four tiers:
SL1 Advanced – Application Health, Automated Troubleshooting and Remediation Workflows
SL1 Base – Infrastructure Monitoring, Topology & Event Correlation
SL1 Premium – AI/ML-driven Analytics, Low-Code Automated Workflow Authoring
SL1 Standard – Infrastructure Monitoring – with Agents, Business Services, Incident Automation, CMDB Synchronization, Behavioral Correlation
To get pricing for each tier, please contact the vendor.
As I stated earlier, SL1 seems to be best used for Servers and Network Storage devices. It doesn't seem to be a direct replacement as SL1 doesn't have a configuration management piece, visual maps are very crude and not user-friendly, and the building of the maps is not …
We evaluated PRTG Network Monitor which was similar to SolarWinds but was very resource-intensive and the server kept crashing when we got close to 100 devices
whereas on SolarWinds we were able to add several thousand devices. We
also evaluated Nagios Core as a free …
NCM is superior to ManageEngine or Spiceworks in its ability to automate the primary tasks of a configuration management tool. Of course, it integrates well with other applications in the SolarWinds Orion suite of applications. The list of vendors supported by NCM is larger as …
When I took over my current position, we'd already purchased SolarWinds Network Configuration Manager, but we were not using it. I can't, therefore, compare it with other tools, as the only thing I have to compare it to was our manual processes. When compared to any …
We haven't vetted out any other solutions for backing up our network devices. NCM does this job well, but isn't the most user friendly software out there. Our Ubiquiti networking hardware is managed through an admin console for all Ubiquiti devices. It manages our configs, and …
SolarWinds Server & Application Monitor is able to provide 90% of the functionality my business requires. SolarWinds is able to scale out functionality by purchasing additional modules to meet the individual needs of its customers. While this functionality provides …
We also evaluated Nagios Core as a free alternative but being free it could not be trusted to be secure, and it was very difficult to add and manage devices.
PRGT Network Monitor seems to be very good, initially, but, in our experience, when we reached close to 100 devices, the system kept crashing and behaving erratic. Prometheus was missing many features and required some CLI scripting and the GUI was years behind SolarWinds. The …
I have used WhatsUp, Nagios, and Zabbix. Very similar in ease of use to WhatsUp, but missing some features of the Zabbix and Nagios XI on the nix side of the house.
I love how the entire SolarWinds platform integrates with one another. There is no hard line drawn between the products I am using. For example, I jump between NetFlow Traffic Analyzer and Network Performance Monitor seamlessly when troubleshooting issues. Server & Application …
I have used Nagios, Whats Up Gold, Manage Engine, and even help desk software such as SysAid. I found that Solarwind's Server and Application Monitor was the most feature rich and the wizards helped us to get up running quick each time we needed to monitor a new server …
Verified User
Analyst
Chose SolarWinds Server & Application Monitor
The integration with their other software including Alert Central provide for a common language between teams when discussing monitoring and everyone has access to the same tools and knows how to use them.
Because we have been so satisfied with NPM we did not bother to evaluate any other competitive products. The single pane of glass integration is extremely convenient for enterprise health monitoring.
Prior to SolarWinds, we used a product called WhatsUp Gold. With each update to WhatsUp Gold it became slower and slower and eventually became so unstable that we could no longer trust it to accurately monitor our systems. That is why we switched to SolarWinds and we have never …
For Windows, the issue is in higher resource consumption related to WinRM monitoring, which provides better options then the SNMP monitoring, which on the other hand is less resource intensive. The problem is also with support for OS with other than English language.
Network Configuration Manager is well suited for backing up configurations of all your devices. It also has a great comparison tool for seeing only the differences in config. Another great feature is it's ability to push a script to any number of devices. This is very handy for pushing changes to one, 10 or multiple devices. There are also some great reports that you can run against the devices in inventory
It is a well-suited software for monitoring and surveillance of your deployed nodes. The error-readability and filter options for filtering out logs and errors could be improved. But overall, it has a good UI design, is user-friendly, and is very easy to learn and access for new users.
Dashboards are quite old and are of Iron age. Need to have AP2 dashboards only instead of AP1 and consistent new design across all functionalities.
Reporting is not improved since Y2020 and need to revamp completely. Need to integrate Dashboards and Reporting. PowerBI Like functionality to be given OOTB. Reports should be extracted in Excel, PDF, HTML and should be heavily automated.
Create and Open APIs for basic and advanced monitoring data extraction.
Topology based Event Correlation and Suppression should be improved drastically. Need to identify critical network interfaces based on Topology and monitor them. Basic customization of Dynamic App and/or Powerpack to exclude/include certain metrics/events to be permitted OOTB instead of customizations.
Integration with ServiceNow to be improved and to be taken to next level. Automation Powerpack should be made available OOTB as part of base product and to be priced attractively.
Take product to next level where we can monitor actual impacted IT or Business Service instead of metrics and events BSM and Topology map to be auto discovered and identify the network dependencies and alternate paths automatically instead of manual creation of BSM.
For our use case, it does everything great and some of the features we underutilize but I would like to be able to set a configuration baseline when initially adding a node instead of after the configuration is pulled but it's not a particularly big deal to let it pull the configuration then set it as the baseline.
It is simply because of all the best possible autonomy solutions it is providing and getting better day by day. Using AI and Devops along with handy automation, The monitoring and Management of devices becomes much easier and the way it is growing in all the aspects is one the best reasons too. Evolution of the SL1 platform in the autonomy monitoring and management is quite appreciable.
Medium complexity to set up in the beginning if using any non-standard devices or configurations, else fairly easy (e.g. Cisco Nexus or IOS-based devices). Reports are fairly straightforward to set up. Updates to the platform are fairly straightforward and don't take a major effort. Easy to add or remove devices.
We are heavily invested in Solarwinds products for a reason. They are generally easy to setup and run with, requiring only some interfacing with support or help articles on rare occasions. They do what we bought them to do and we can't ask for more.
The core functions are there. The complexity is due to the complexity of the space. The score is based on comfort (I no longer notice the legacy UI) and the promise that I see in the 8.12 Unified UI (a vast improvement). It is also based on the fact that with 8.12, you can now do everything in the new UI but you still have the legacy UI as a fallback (which should now be unnecessary for new installations)
The user interface is lacking. It is difficult to navigate at times and things can be done multiple ways. Quite often I am confused by how their notification structure works. It is not very intuitive. They do offer a free Academy. They also offer a community of other technical folks. I have enjoyed both.
SolarWinds Server & Application Monitor is quite easy to use and super versatile. It allows you to do just about anything you can through premade templates or through scripting. You can use an agent on the servers if you want to, or you can monitor through WMI or SNMP credentials. You can customize thresholds for alerting quickly, and you can configure alerts to be as complex or as simple as you want.
SL is always there and online when you need to get info from it. The only times when SL was not available in our own data center, was when network links from out side of the data center was down and those links were not in our controll. Having a central database and people accessing it all over the world, may put a bit of constarin on the performance of the dashboards when reports gets generated, but that is far and few n between.
SceinceLogic SL1 architecture helps the platform to give a top-notch performance in every respect, Data collection to reporting happens very smoothly. With the new user interface pages load much faster. Individual appliances carrying the individual task ensure things are working without lag. Integration with ticketing tool(SNOW) is well managed by the ScienceLogic, no issue or much delay has been observed while interacting with an external tool.
The graphical interface and the performance of the database leave a little to be desired, they could be better explored.Some functionality and screens do not work well depending on the browser used. The integrations never had any problems or caused crashes in other systems.
So far, it's good as part of my overall experience, except for a couple of use cases. The support team is well knowledgeable, has technical sound, and is efficient. When support escalates to engineering, the issue gets stuck and takes months to resolve.
To be fair, I have not had to involve Support in a number of years, but when I did, I was greeted with enthusiastic engineers who wanted to understand and solve the issue. It was a fairly complex scenario and I have discovered in my most recent implementation that engineering included that option as a standard now.
I think there was only a couple times I had to open a support case for SAM and one time they got multiple engineers on the phone to get a better idea what I was trying to monitor and was able to point me in the best direction to monitor that system.
It was good, Do the online training first and understand it and you will get the most out of the in-person training that way. This also takes you to an advanced level which is very good and the training as been overhauled once again along with new product coming in such as Zebruim / Skylar, worth going through again if it a while back that you first did this.
There are a lot of educational materials and courses on the SL1 training site (Litmos university). However the recording quality is sometimes not very good - screen resolution is low. There is a lack of professional rather than user-oriented documents and there are mistakes in documentation and education is not well structured.
Solarwinds has actually produced new training since I last used it that is available on their site at any time. Their previous training was more than enough to get us started but now there is significantly more content. Since I'm comfortable with the Orion platform and the products we use I haven't checked the new training out yet but we have new staff go through portions of that training and they always come away with an understanding of the platform and ready to use it
Implementation is smooth if we are to just support the out-of-the-box features available in ScienceLogic. For any custom requirement, having to go to SL1 Professional Services is the worst part of procuring this suite. And more often than not, SL1 Professional Services also ask to raise feature request. So, you subscribe to Professional Services to only hear back from them that "This feature is not supported and needs to have a separate feature request". At times frustrating.
it was a fairly easy implementation and everything was pretty straightforward. only challenge we had was getting all the snmp communities updated on the networking equipment
Science logic SL1 is so user friendly and it's really easy to navigate between function. I would recommend Sciene logic SL1 to all of them who are looking for really useful monitoring tool and expecting easy way of managing it.
At the time SolarWinds was the biggest player in the space and their whole portfolio was very comprehensive. As time progressed and newer technologies came about (i.e. SDWAN) their products couldn't keep up with the consumer demands and changing market. Security became such a big focus that once Solarwinds got hacked we had to remove all their products from our environment
Nagios requires far more manual work to configure than SolarWinds does, though that also encourages customization and perfect-fit solutions. Nagios also requires far, far fewer resources to run than SolarWinds: SolarWinds wants great gobs of memory and disk, while Nagios is refreshingly humble. Nagios starts working from the first minute, too, whereas SolarWinds needs lots of set-up time.
Our deployment model is vastly different from product expectations. Our global / internal monitoring foot print is 8 production stacks in dual data centers with 50% collection capacity allocated to each data center with minimal numbers of collection groups. General Collection is our default collection group. Special Collection is for monitoring our ASA and other hardware that cannot be polled by a large number of IP addresses, so this collection group is usually 2 collectors). Because most of our stacks are in different physical data centers, we cannot use the provided HA solution. We have to use the DR solution (DRBD + CNAMEs). We routinely test power in our data centers (yearly). Because we have to use DR, we have a hand-touch to flip nodes and change the DNS CNAME half of the times when there is an outage (by design). When the outage is planned, we do this ahead of the outage so that we don't care that the Secondary has dropped away from the Primary. Hopefully, we'll be able to find a way to meet our constraints and improve our resiliency and reduce our hand-touch in future releases. For now, this works for us and our complexity. (I hear that the HA option is sweet. I just can't consume that.)
Once a powerpack is developed and configured for a device for one customer, it is easy to deploy the same powerpack on a second customer estate and configure specifically for that customer without having to reinvent the powerpack. This saves time and therefore money.
Once the customer estate tuning is complete, the Operations team have come trust the alerts. This is especially true when transient or self-correcting alerts are automatically cleared without ops team involvement, but a record is still available for audit and debugging purposes. This saves time and therefore money.
When setup correctly, it provides good visibility into applications, devices and whole customer estates. This saves time and therefore money when issues arise.
Saves 100s of hours a year in man hours over manual configuration.
Saved easily 50k in lost revenue when a switch rebooted with months old unsaved configuration. NCM let us quickly restore a snapshot of the running config from the previous day.
Saves us several man hours per week of config auditing by reducing all changes to a summary email.