Tableau Desktop is a data visualization product from Tableau. It connects to a variety of data sources for combining disparate data sources without coding. It provides tools for discovering patterns and insights, data calculations, forecasts, and statistical summaries and visual storytelling.
$1,380
per year (purchased via a Creator license)
Tableau Public
Score 9.8 out of 10
N/A
Tableau Public is a free edition of the Desktop product. With this edition, data can only be published to the Tableau public website and does not allow work to be saved or exported locally.
$0
per month
Webtrends Analytics
Score 4.4 out of 10
N/A
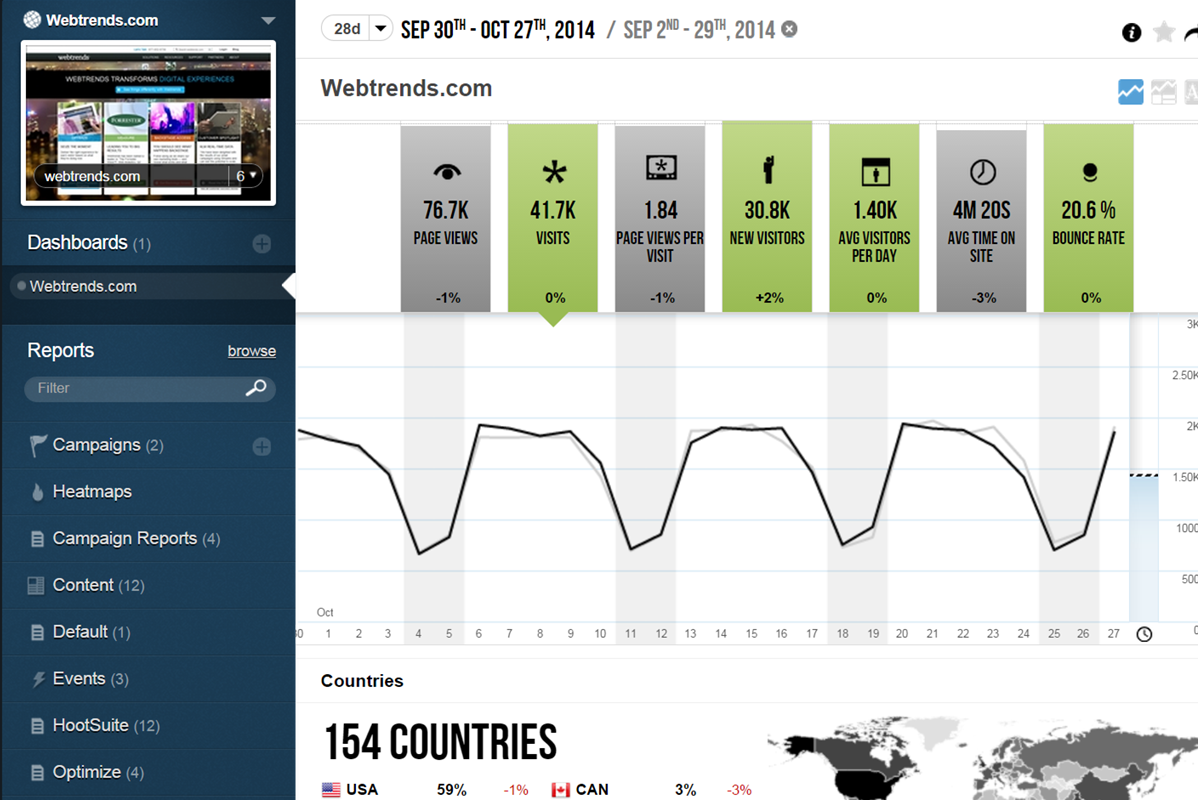
WebTrends provides an enterprise web analytics platform and, according to Forrester, has a strong focus on support for mobile and social channels and a very open platform. Webtrends competes directly with Adobe Site Catalyst, IBM Coremetrics. and comScore DigitalAnalytix.
N/A
Pricing
Tableau Desktop
Tableau Public
Webtrends Analytics
Editions & Modules
Tableau Creator License
$115
per month (billed annually) per user
No answers on this topic
No answers on this topic
Offerings
Pricing Offerings
Tableau Desktop
Tableau Public
Webtrends Analytics
Free Trial
No
No
No
Free/Freemium Version
Yes
Yes
No
Premium Consulting/Integration Services
Yes
No
No
Entry-level Setup Fee
No setup fee
No setup fee
No setup fee
Additional Details
All pricing plans are billed annually. A Creator license includes Tableau Desktop, Tableau Prep Builder, and Tableau Pulse. Discounts sometimes available for volume.
—
—
More Pricing Information
Community Pulse
Tableau Desktop
Tableau Public
Webtrends Analytics
Considered Multiple Products
Tableau Desktop
Verified User
Analyst
Chose Tableau Desktop
The online and public versions are only good for the hobbyist because they are not secure enough for most business applications. Dapresy is a marketing tool that is supposed to give executives a snapshot of marketing results. It's not very customizable and the results are …
I feel like Tableau is easier to use and offers a greater selection of visualizations. I feel that the dashboards are easier to put together and offer a great amount of flexibility for the end-user. Tableau has an excellent user support group. I find the community to be …
Tableau is more powerful than Excel. One does have more flexibility by using programming libraries like D3.js, which have been designed specifically for data visualization, but they also require the user to know how to program with javascript. Tableau is great for users who …
It is easier to start with Tableau. The out of the box ready feel is more with Tableau than any of the other BI products. Product scalability is at a steep cost with Tableau but it gives the possibility to begin small and then grow as it proves its capability as compared to all …
Renowned digital analytics consultant, innovator, speaker, thought leader
Chose Tableau Desktop
I haven't used other tools for a number of years - when I made the selection my criteria were ease of use (including, slicing & dicing data at will), connectivity to various data sources (especially REST API - which Tableau doesn't support natively but now has a way to use …
Python is programming tools, while Tableau is an easy to use drag and drop data visualization tool. This may not be an apple to apple comparison. Compared to Excel, Tableua is way over the top when it comes to data visualization.
Tableau Public lacks data connectors to Oracle/SQL Server or just about any. No ability to share non-public data nor to package into Tableau Reader. No ability to connect to Tableau Server or Tableau Online to secure your information. However, if you want basic visualization …
Tableau Public allows users to upload their work to a designated place online, where others can view and download it. This feature does not available in OriginLab, which is also a useful and popular program to do data analysis.
Tableau Public provides a variety of visualization and point-and-click functionality, with little or no scripting, gives Tableau the advantage. Also, being lightweight, Tableau Public finds the ease of use from our PSU bank-clients that use low-end hardware and devices. Tableau …
Tableau public is Free and no subscription is required whereas Tableau Desktop is a paid subscription. if there is no private or confidential data it's easy to Tableau public and share reports with people. Tableau public has same features and options same as desktop. its easy …
We evaluated about 15 products when we selected Tableau 7 years ago, and periodically review products from other vendors (e.g. Microsoft, QlikView, Tibco Spotfire, Birst, Pentaho, etc.). To date, Tableau offers the widest variety of options and functionality at a reasonable …
The best scenario is definitely to collect data from several sources and create dedicated dashboards for specific recipients. However, I miss the possibility of explaining these reports in more detail. Sometimes, we order a report, and after half a year, we don't remember the meaning of some data (I know it's our fault as an organization, but the tool could force better practices).
Tableau public is the best platform to build dashboards for your personal profile and share with recruiters. It's always good to keep ourselves updated on the latest features, create sample dashboards and save them to a personal profile. Tableau public is free and doesn't need any subscription. anyone can create an account and start building reports.
Scenarios 1. If you want to use web server log files as input to your web analytics, then Webtrends will provides a good product, with great ease of implementation. Don't even think about being cheap on hardware, and make sure Webtrends runs on real servers, not in a VM environment. 2. If you want to use Data Tagging, similar to Google Analytics or Site Catalyst, Webtrends has a powerful product, just be prepared to pay. 3. If you are new to Web Analytics, but it is the strategic direction, start with Webtrends on Premises. Questions to Ask 1. What are you trying to accomplish? 2. Can you place a dollar value on the benefit that you expect/need from Webtrends? 3.Can you live with Webtrends running SaaS?
An excellent tool for data visualization, it presents information in an appealing visual format—an exceptional platform for storing and analyzing data in any size organization.
Through interactive parameters, it enables real-time interaction with the user and is easy to learn and get support from the community.
Data visualization: lots of different options, including bar, scatter, pie, waterfall charts to explore relationships between variables, and to present findings/trends to different teams
Integrates readily with limited, though different data sources: TXT, CSV, TDE, Access
Exports reports for review of different dashboards: client-ready/team-ready, with a clean and tidy presentation in PDF format (or hardcopy)
Control privacy, data sharing and competitive industrial knowledge using Webtrends on premises
Great control over custom reports, custom dimensions and metrics
Flexible tool which allows multiple methods of data capture. To my knowledge it was the first tool with a Tag Builder / Tag Management function built in via a supporting website.
Tableau Public (both Desktop and Server) like their "for a fee" counterparts offer very easy to learn and use tools to transform data into pictures and gain insights into your data. Most organizations report a reduction in development time of 10x vs. other similar tools, due to the intuitive user interface. That said, with Tableau Public, published workbooks are "disconnected" from the underlying data sources and require periodic updates when the data changes. Users are limited to 1 Gb of storage space per user ID and password as well.
I would like to see better options for public sharing of visualizations and data from within the "for a fee" products as more and more organizations are moving in the direction of data sharing with partners and their communities.
The big downside, the elephant in the room, is that it does not (as of right now) have on-demand segmenting, drilldowns, etc. You have to think of what you want in advance and create those reports then analyze some data. This is huge. You can, of course, re-analyze old data after creating new reports but you still have to wait. (This deficiency may become obsolete with the release of Webtrends Explore later this month (May 2014).)
It has fewer mature integrations with other products and databases than competitors do, although I'm told it works with SharePoint better than anything else does.
Its attribution modeling capability is behind Google Analytics'. In my humble opinion, this could be changed quickly if Webtrends would make some tweaks to its standard visitor history files (i.e. preserve the order in which past visits were sourced beyond the single most recent one, rather than storing all those past sources as a randomized list).
It doesn't incorporate statistical tests, confidence intervals, or statistical associations. However, this same criticism can be applied to its competitors (other than A/B Testing products). It's a tabulation program, as they all are. In this respect, web analytics tools as a group are relatively primitive. Sorry to bring this up as a criticism of Webtrends but it's my pet peeve about the whole industry and I just have to say it. (p.s. take advantage of the heavy-duty Webtrends Scheduled Export functionality to get really granular data that you can feed to a stats program to get significances.)
Although the documentation, help screens, phone support and the knowledge base have improved tremendously in recent years, there is still a pretty steep learning curve because it is different from the tools that entry-level users may have already been exposed to. This can be a shock and many users are alienated at first because they just don't get some of the fundamentals at first. I'd like to see much better help screens that are thoroughly interlinked with the KB and documentation. Having superb online support would make a world of difference with the adoption of this basically powerful tool.
Our use of Tableau Desktop is still fairly low, and will continue over time. The only real concern is around cost of the licenses, and I have mentioned this to Tableau and fully expect the development of more sensible models for our industry. This will remove any impediment to expansion of our use.
It's free, right? I'll keep using the free version. So the real question to ask is this? Will I pay $999 for the Personal version or $1,999 for the Professional? Yikes! That is a big stretch. I'm not sure about that. The product comparison chart is at: http://www.tableausoftware.com/public/comparison
I would be willing to try Webtrends again AFTER some research from other users. I would need to see that users mention better and faster customer support on questions and issues that arise while using the software. The software is capable of vast and incredible things, but if it isnt properly set up and supported during use, it is just a big hassel and waste of everyones time and money.
Tableau Desktop has proven to be a lifesaver in many situations. Once we've completed the initial setup, it's simple to use. It has all of the features we need to quickly and efficiently synthesize our data. Tableau Desktop has advanced capabilities to improve our company's data structure and enable self-service for our employees.
Tableau public is a great training tool to understand the basics of Tableau before buying it. A great tool to extend Excel's visualization and to publish data for others. Not useful for anything you need secure. No ability to access databases. Static information only.
If I could give it a 0, I would. Not having an intuitive user interface made it impossible to convince non-analytic business users to use the tool on their own. Even as a seasoned analyst, frequent calls were needed to get what should be simple tasks done. Account managers don't understand the tool either, and have to refer you to technical support
When used as a stand-alone tool, Tableau Desktop has unlimited uptime, which is always nice. When used in conjunction with Tableau Server, this tool has as much uptime as your server admins are willing to give it. All in all, I've never had an issue with Tableau's availability.
Tableau Desktop's performance is solid. You can really dig into a large dataset in the form of a spreadsheet, and it exhibits similarly good performance when accessing a moderately sized Oracle database. I noticed that with Tableau Desktop 9.3, the performance using a spreadsheet started to slow around 75K rows by about 60 columns. This was easily remedied by creating an extract and pushing it to Tableau Server, where performance went to lightning fast
The v9 admin interface and v10 reporting interface work as well as expected, but have a tendency to be pokey, especially for bulky reports and whenever you're connected to wifi. I much prefer using the REST API for all reporting for this reason, which simply dumps out the data and doesn't bother with the user interface.
Tableau support has been extremely responsive and willing to help with all of our requests. They have assisted with creating advanced analysis and many different types of custom icons, data formatting, formulas, and actions embedded into graphs. Tableau offers a weekly presentation of features and assists with internal company projects.
I once went on to Twitter to ask for help from my network of analytics people, and Webtrends themselves responded. They have been an excellent partner in making sure that their product is being used to the best of it's ability and I greatly appreciate that. Both Omniture and Google Analytics, do not have that level of support over social media
It is admittedly hard to train a group of people with disparate levels of ability coming in, but the software is so easy to use that this is not a huge problem; anyone who can follow simple instructions can catch up pretty quickly.
The in-person training was comprehensive enough to get you started, but I strongly recommend having a more experienced person when beginning with the tool.
I think the training was good overall, but it was maybe stating the obvious things that a tech savvy young engineer would be able to pick up themselves too. However, the example work books were good and Tableau web community has helped me with many problems
Webtrends provides several free webinars over the course of the year, many of which I would expect to pay for. The people providing the webinars seem to have a good feel for real-world application of the product.
Again, training is the key and the company provides a lot of example videos that will help users discover use cases that will greatly assist their creation of original visualizations. As with any new software tool, productivity will decline for a period. In the case of Tableau, the decline period is short and the later gains are well worth it.
Start at the end and work backward. Identify the business case / issue and questions the end users have, then identify the data needed, and where to get it.
Careful planning and patience. Use a non-public test site to fine tune tags and reporting. Despite best laid plans, there will be surprises when you collect the data, run the analysis and begin generating reports using the tool. Perform a tag audit to ensure tags fire as desired.
I have used Power BI as well, the pricing is better, and also training costs or certifications are not that high. Since there is python integration in Power BI where I can use data cleaning and visualizing libraries and also some machine learning models. I can import my python scripts and create a visualization on processed data.
Google Charts/Drive is sufficient for simpler data sets, but it does not integrate with other web platforms and the visualization does not look as professional. I'm not aware of any other competitors that offer the same package as Microsoft.
Webtrends has its work cut out for itself considering you have the behemoth Google Analytics and Google Analytics Premium having a strong offering and brand recognition for the price of free. After reviewing the paid service I'd suggest you start off with GA as a cheaper alternative that is just as robust, if not much more flexible in regards to the reporting and goal tracking needs for our company.
Tableau Desktop's scaleability is really limited to the scale of your back-end data systems. If you want to pull down an extract and work quickly in-memory, in my application it scaled to a few tens of millions of rows using the in-memory engine. But it's really only limited by your back-end data store if you have or are willing to invest in an optimized SQL store or purpose-built query engine like Veritca or Netezza or something similar.
Tableau was acquired years ago, and has provided good value with the content created.
Ongoing maintenance costs for the platform, both to maintain desktop and server licensing has made the continuing value questionable when compared to other offerings in the marketplace.
Users have largely been satisfied with the content, but not with the overall performance. This is due to a combination of factors including the performance of the Tableau engines as well as development deficiencies.
Webtrends has had a positive impact on site visitation because it allowed us to understand the sources by domain for site traffic and find out ways to increase visits from those domains.
Webtrends has also allowed us to understand areas of optimization on the site, which has had a positive impact on the overall user journey on the site, likely leading to longer site duration and engagement.