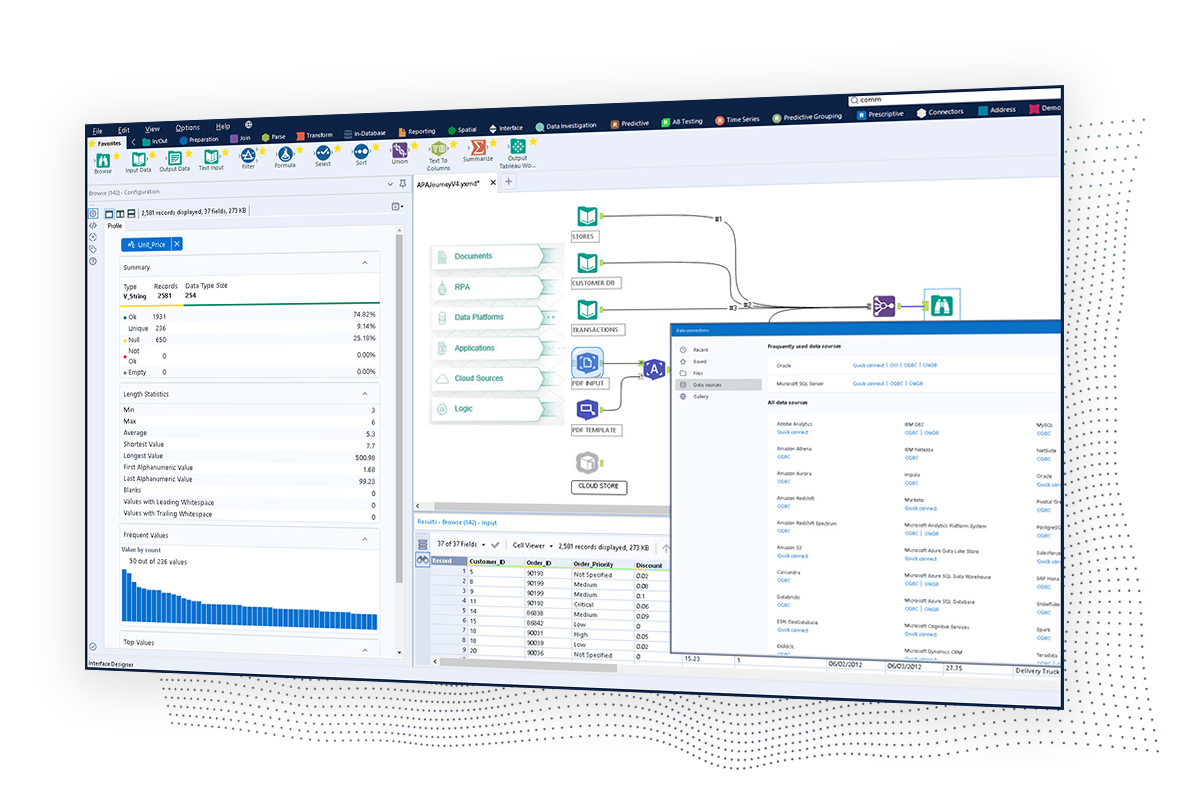
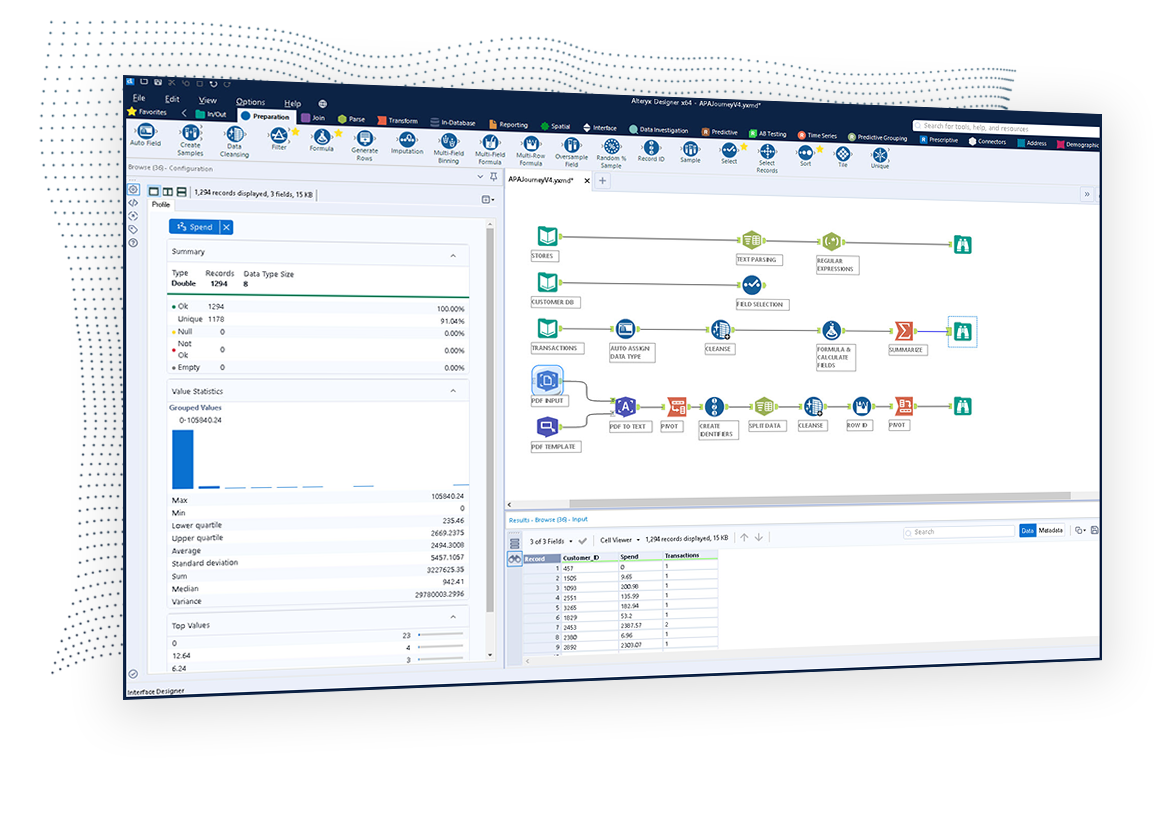
The Alteryx AI Platform gives organization automated data preparation, AI-powered analytics, and machine learning with embedded governance and security. Its self-service functionality, with self-service data prep, machine learning, and AI-generated insights, gives enterprise teams with a simplified user experience allowing everyone to create analytic solutions that improve productivity, efficiency, and the bottom line. Alteryx Designer can be used to automate every analytics step…
$14,850
per year 3 users (minimum), cloud edition
Sigma
Score 8.2 out of 10
N/A
Sigma Computing headquartered in San Francisco provides a suite of data services such as code free data modeling, data search and explorating, and related BI and data visualization services.
N/A
Pricing
Alteryx Platform
Sigma Computing
Editions & Modules
Designer Desktop
starting at $5,195
per year per user
Designer Cloud Professional Edition
Starting at $4,950
per year per user (minimum of 3 users)
No answers on this topic
Offerings
Pricing Offerings
Alteryx Platform
Sigma
Free Trial
Yes
Yes
Free/Freemium Version
No
No
Premium Consulting/Integration Services
Yes
No
Entry-level Setup Fee
No setup fee
Optional
Additional Details
—
Contact us for pricing.
More Pricing Information
Community Pulse
Alteryx Platform
Sigma Computing
Considered Both Products
Alteryx Platform
No answer on this topic
Sigma
Verified User
Employee
Chose Sigma Computing
Sigma has a better view of tables and it is much easier to create new data sets/aggregations. Tableau is better in some visual aspects because there is more customization available, albeit more confusing than Sigma to do. Sigma is very intuitive and did not take long to learn …
I would 100% recommend Alteryx to a friend, for me its friendly interface is the best, it has all the tools I need without the headache that programming is. It can be used for simple or complex analysis, so honestly, I don’t see a scenario where it wouldn’t suit. I’ve used Alteryx to make simple things I could do in Excel, for example, but it was less complex and faster to do in Alteryx, so why not? Its a very versatile tool.
We were able to set up client-facing embedded reports with ease and security. The interface is not difficult to learn, although we may not be aware of or lack the necessary expertise to utilize more advanced features that would likely benefit us.
Pulling data from multiple disparate data sources.
Allows users to see the data at every step of the workflow to be able to cleanse, analyze, and optimize the data.
Provides an analytics platform that is easy for users of all levels to thrive in whether they are just starting out in their analytics journey or they have a master's degree in Data Science.
Steeper Learning Curve: Alteryx can have a steep learning curve for users who are new to the platform or have limited experience with data analytics. Enhancements to the user interface and user onboarding resources could help make the learning process more intuitive and accessible to a wider range of users.
Enhanced Data Visualization Capabilities: Alteryx offers basic data visualization capabilities, but there is room for improvement in terms of advanced visualizations and interactive dashboarding features. Adding more sophisticated chart types, interactive widgets, and customization options would enhance the data visualization capabilities within the platform.
Improved Error Handling and Debugging: Alteryx provides error handling mechanisms, but enhancing the error reporting and debugging capabilities would be beneficial. Improved error messages, better visibility into data flow, and debugging tools could help users troubleshoot and resolve issues more efficiently.
Sigma Computing does not allow custom ordering of pivot fields in pivot tables easily
Sigma Computing lacks functionality for creating tables or sections that dynamically adjust to the browser window's height while maintaining a fixed height textbox at the bottom
Sigma Computing does not provide straightforward options for formatting totals in tables, such as renaming 'Total' to 'Average', 'Team Total', etc
Sigma Computing does not support searching by individual tab names within a workbook
We've developed a working partnership with Alteryx. As an enablement suite, we're continuing to innovate and deliver great products with use of Alteryx in our solutions. Alteryx use expands to our global product development teams and is in use in multiple parts of our organization. Alteryx also delivers Experian demographic content to other clients in their product offering. We're highly likely to renew, but that decision is way above my pay grade.
Sigma has helped us a lot and has become an integral part of our daily workflow. It would be difficult to switch to another platform and have to rebuild the numerous metrics and performance reports that we have already established
I've found that while some things might take a little longer to create, the flexibility of Alteryx allows you to perform any function needed. I haven't found a use that was not available in Alteryx yet. APIs and XMLs can be created to perform certain functions. In addition, CMD line commands can be sent using Alteryx to perform certain functions as well.
It has a clean and modern interface. However, it is not completely intuitive. I think it would be better and easier to navigate with more Windows style drop down menus and/or tabls. There is a significant learning curve, but that may be due in part to the technical nature of this type of software tool.
I use many programs and compared to others, Alteryx virtually never goes down, freezes up or gives an application error. Over a 4 year time period that I have used this program, any of these may have happened 3 times. It is an incredibly stable program that I feel completely confident in.
I already gave the example of journal entries created in less than a second. What else can I tell you about.... I can tell you those 2 journal entries have historically had to be split into separate accounting systems so the outputs had to be very different (D365 vs Intacct) such that they are exactly ready for uploading. I can tell you I used to have some tire and battery queries hitting a line item detail table and they took hours to run UNTIL I asked IT for a view in SQL and now they're ready in about 5 minutes total. I guess I'd say if anything does take a long time - do some research with others and figure out what would speed them up
Stellar, bar-none. Some of the best support folks of any vendor. The Alteryx Community is the most responsive and supportive. On the rare occasion of a release issue or bug, we've been able to get quick help to solve the core problem. Alteryx does not play the blame game. They genuinely help the users solve their issues or respond to questions
They are very friendly and informative. They are quick in resolving our queries and help us understand very minute things as well. They are quick in creating feature tickets based on our custom requirements, and they would also create a bug ticket if there is any discrepancy and get that checked on time.
1st level of trainings which I've attended in Paris was easy and I was already knowing %90, that learning could have been an e-learning instead of in-person
Very good, detailed online trainings which you can take at your own pace, and strong certifications exists, certifications are extremely detailed and hard...
There is really not much to it (the installation, that is). Once you get it installed, along with any of the add-ons (demographics, R, etc.), you are up and running almost immediately. There is really no additional setup. You can immediately begin blending data, running demographics, performing spatial queries, running predictive analysis, etc. And for many of these functions, the learning curve is quite easy.
Alteryx is MUCH more user friendly. both provide the ability to code within them, but Alteryx has much nicer interface. The formula tools have a more simple language that is easier to learn than formulae in SSIS. Alteryx is easy to read with multi colored tools identifying what each one does. It also allows for macros. You can build your own tool to process records of data or batch records together.
With Looker, to be effective, a substantial amount of coding & modeling needs to happen in LookML. Being another language to learn, users have to context switch again from at a minimum either SQL or Python into LookML. The concept of being able to source control, code review, and deploy your models is a plus though.
Tableau is the gold standard for data visualization, no question. Power users will be able to create dazzling content that Sigma won't necessarily be able to easily match. However, since development usually happens via an extract, helping other users troubleshoot is an arduous process. Trying to re-do or un-do all the transformations and calculations that cause a certain number is very difficult.
With Sigma, all the queries happen directly against Snowflake and you can see the query logs. The data modeling happens right in a tabular, spreadsheet-like manner, so within only a few minutes, substantial transformations can happen, with visualizations just a few more clicks away.
Individual analysts can quickly generate results using their own copy of Alteryx Designer. But using the Server and developing macros for more complex needs can be time consuming.
Error handling - allows controls to be built into workflows easily and allows them to be isolated and spat into control reports that can be easily reviewed and audited, thanks to the ability to create multiple outputs in one go.
Time-saving - saved huge amounts of time, especially when moving Excel processes into Alteryx.
Product development - allowed my firm to create products that we have been able to market and sell to clients.
Monitoring health of cloud platform has allowed the company to anticipate issues before they affect customers – Sigma prompted us building a canary monitoring process that provides customer container health.
Customer success has used an activity report to discover customers running runaway processes that they were unaware of, creating an alert to contact the customer and prevent an embarrassing situation.
Customer success uses the activity report to prompt conversations regarding increases or declines in behavior that led to increasing contract limits or addressing churn concerns.