Chose Datadog
Its the Enterprise level decision, definitely usability and features perspective Datadog is much more advanced.
| Product | Rating | Most Used By | Product Summary | Starting Price |
|---|---|---|---|---|
 Datadog | N/A | Datadog is a monitoring service for IT, Dev and Ops teams who write and run applications at scale, and want to turn the massive amounts of data produced by their apps, tools and services into actionable insight. | $1.27 per month (billed annually) per host | |
 ScienceLogic AI Platform | Enterprise companies (1,001+ employees) | ScienceLogic provides a unified IT Operations platform designed to manage operational workflows using high-fidelity Telemetry Data and explainable automation. The ScienceLogic AI Platform is deployable across On-Premises, Cloud, and Hybrid Environments. The platform consolidates monitoring tools to provide Observability and enables engineers to automate manual processes using Machine Learning capabilities. The platform utilizes automation for Closed-Loop Remediation and provides insights… | N/A |
| Datadog | ScienceLogic AI Platform | |||||||||||||||
|---|---|---|---|---|---|---|---|---|---|---|---|---|---|---|---|---|
| Editions & Modules |
| No answers on this topic | ||||||||||||||
| Offerings |
| |||||||||||||||
| Entry-level Setup Fee | Optional | Required | ||||||||||||||
| Additional Details | Discount available for annual pricing. Multi-Year/Volume discounts available (500+ hosts/mo). | ScienceLogic SL1 offers four tiers: SL1 Advanced – Application Health, Automated Troubleshooting and Remediation Workflows SL1 Base – Infrastructure Monitoring, Topology & Event Correlation SL1 Premium – AI/ML-driven Analytics, Low-Code Automated Workflow Authoring SL1 Standard – Infrastructure Monitoring – with Agents, Business Services, Incident Automation, CMDB Synchronization, Behavioral Correlation | ||||||||||||||
| More Pricing Information | ||||||||||||||||
| Datadog | ScienceLogic AI Platform | |
|---|---|---|
| Considered Both Products |  Datadog  Jeffrey van Santen Sr SWE Chose Datadog Datadog is a more complex but complete solution than any of the other Log Aggregation, monitoring, or general observabilty tools that we have trialed. I found it easier to setup following useful and up-to-date documentation provided directly by Datadog instead of scattered …  Vinit Parakh Sr. DevOps Engineer Chose Datadog First think first - it's easy to use, and very easy to implement in any infrastructure. It provides a custom dashboard and monitors. I’ve used or evaluated Grafana, Prometheus, Amazon CloudWatch, and Dynatrace, and each tool has strong capabilities. Prometheus + Grafana provide …  Joe Cardali Head of Engineering Chose Datadog Much more modern and advanced  Fernando Battistella DevOps Engineer Chose Datadog ease of use and implementation, other than new relic (which I think is terrible in every possible way), the other two support opentelemetry better, have more manageable costs and comparable basic services, but they do not have the breadt of services dd does. |  ScienceLogic AI Platform  Suchit Kumar sr professional manager Chose ScienceLogic AI Platform real-time data monitoring, scalability of a complex environment is the key feature. For any new requirement, powerpack installation is very easy & handful.  Nakul Shivakumar Associate Technical Engineer Chose ScienceLogic AI Platform SL1 is easy to implement which is much easier to understand and what more implementation can be further deployed  Douglas Bosch Senior Solution Architect Chose ScienceLogic AI Platform ManageEngine Site24x7, ManageEngine OpManager and HPE OneView  Jas Singh Platform Engineer Chose ScienceLogic AI Platform Agentless product that can integrate easily with other product and also allow us to automate tasks, example closing tickets when events are cleared automatically which user interactions. |
| Datadog | ScienceLogic AI Platform | |||||||||||||||||||||||||||||||||
|---|---|---|---|---|---|---|---|---|---|---|---|---|---|---|---|---|---|---|---|---|---|---|---|---|---|---|---|---|---|---|---|---|---|---|
| AIOps Features |
|
| Datadog | ScienceLogic AI Platform | |
|---|---|---|
| Small Businesses |  Amazon CloudWatch Score 7.7 out of 10 | No answers on this topic |
| Medium-sized Companies |  ManageEngine Site24x7 Score 10.0 out of 10 |  LogicMonitor Score 9.1 out of 10 |
| Enterprises | ManageEngine Site24x7 Score 10.0 out of 10 |  ignio AIOps Score 8.1 out of 10 |
| All Alternatives | View all alternatives | View all alternatives |
| Datadog | ScienceLogic AI Platform | |
|---|---|---|
| Likelihood to Recommend | 8.9 (0 ratings) | 8.1 (0 ratings) |
| Likelihood to Renew | 1.0 (0 ratings) | 8.4 (0 ratings) |
| Usability | 8.7 (0 ratings) | 9.6 (0 ratings) |
| Availability | - (0 ratings) | 9.3 (0 ratings) |
| Performance | - (0 ratings) | 8.2 (0 ratings) |
| Support Rating | 5.0 (0 ratings) | 6.5 (0 ratings) |
| In-Person Training | - (0 ratings) | 8.7 (0 ratings) |
| Online Training | - (0 ratings) | 7.8 (0 ratings) |
| Implementation Rating | 1.0 (0 ratings) | 6.5 (0 ratings) |
| Configurability | - (0 ratings) | 10.0 (0 ratings) |
| Ease of integration | - (0 ratings) | 8.0 (0 ratings) |
| Product Scalability | - (0 ratings) | 8.0 (0 ratings) |
| Vendor post-sale | - (0 ratings) | 9.1 (0 ratings) |
| Vendor pre-sale | - (0 ratings) | 8.4 (0 ratings) |
| Datadog | ScienceLogic AI Platform | |
|---|---|---|
| Likelihood to Recommend |
|
|
| Pros |
 Aman Makwana DevOps Engineer |
 Wian Crous Software Developer |
| Cons |
|
|
| Likelihood to Renew |
|
|
| Usability |
|
 Amit Sanwal Windows Engineer |
| Reliability and Availability | No answers on this topic |
|
| Performance | No answers on this topic |
|
| Support Rating |
|
|
| In-Person Training | No answers on this topic |
 Benjamin Gerber Technical Lead |
| Online Training | No answers on this topic |
|
| Implementation Rating |
|
|
| Alternatives Considered |
Jeffrey van Santen Sr SWE |
|
| Scalability | No answers on this topic |
|
| Return on Investment |
|
|
| ScreenShots | Datadog Screenshots      | ScienceLogic AI Platform Screenshots 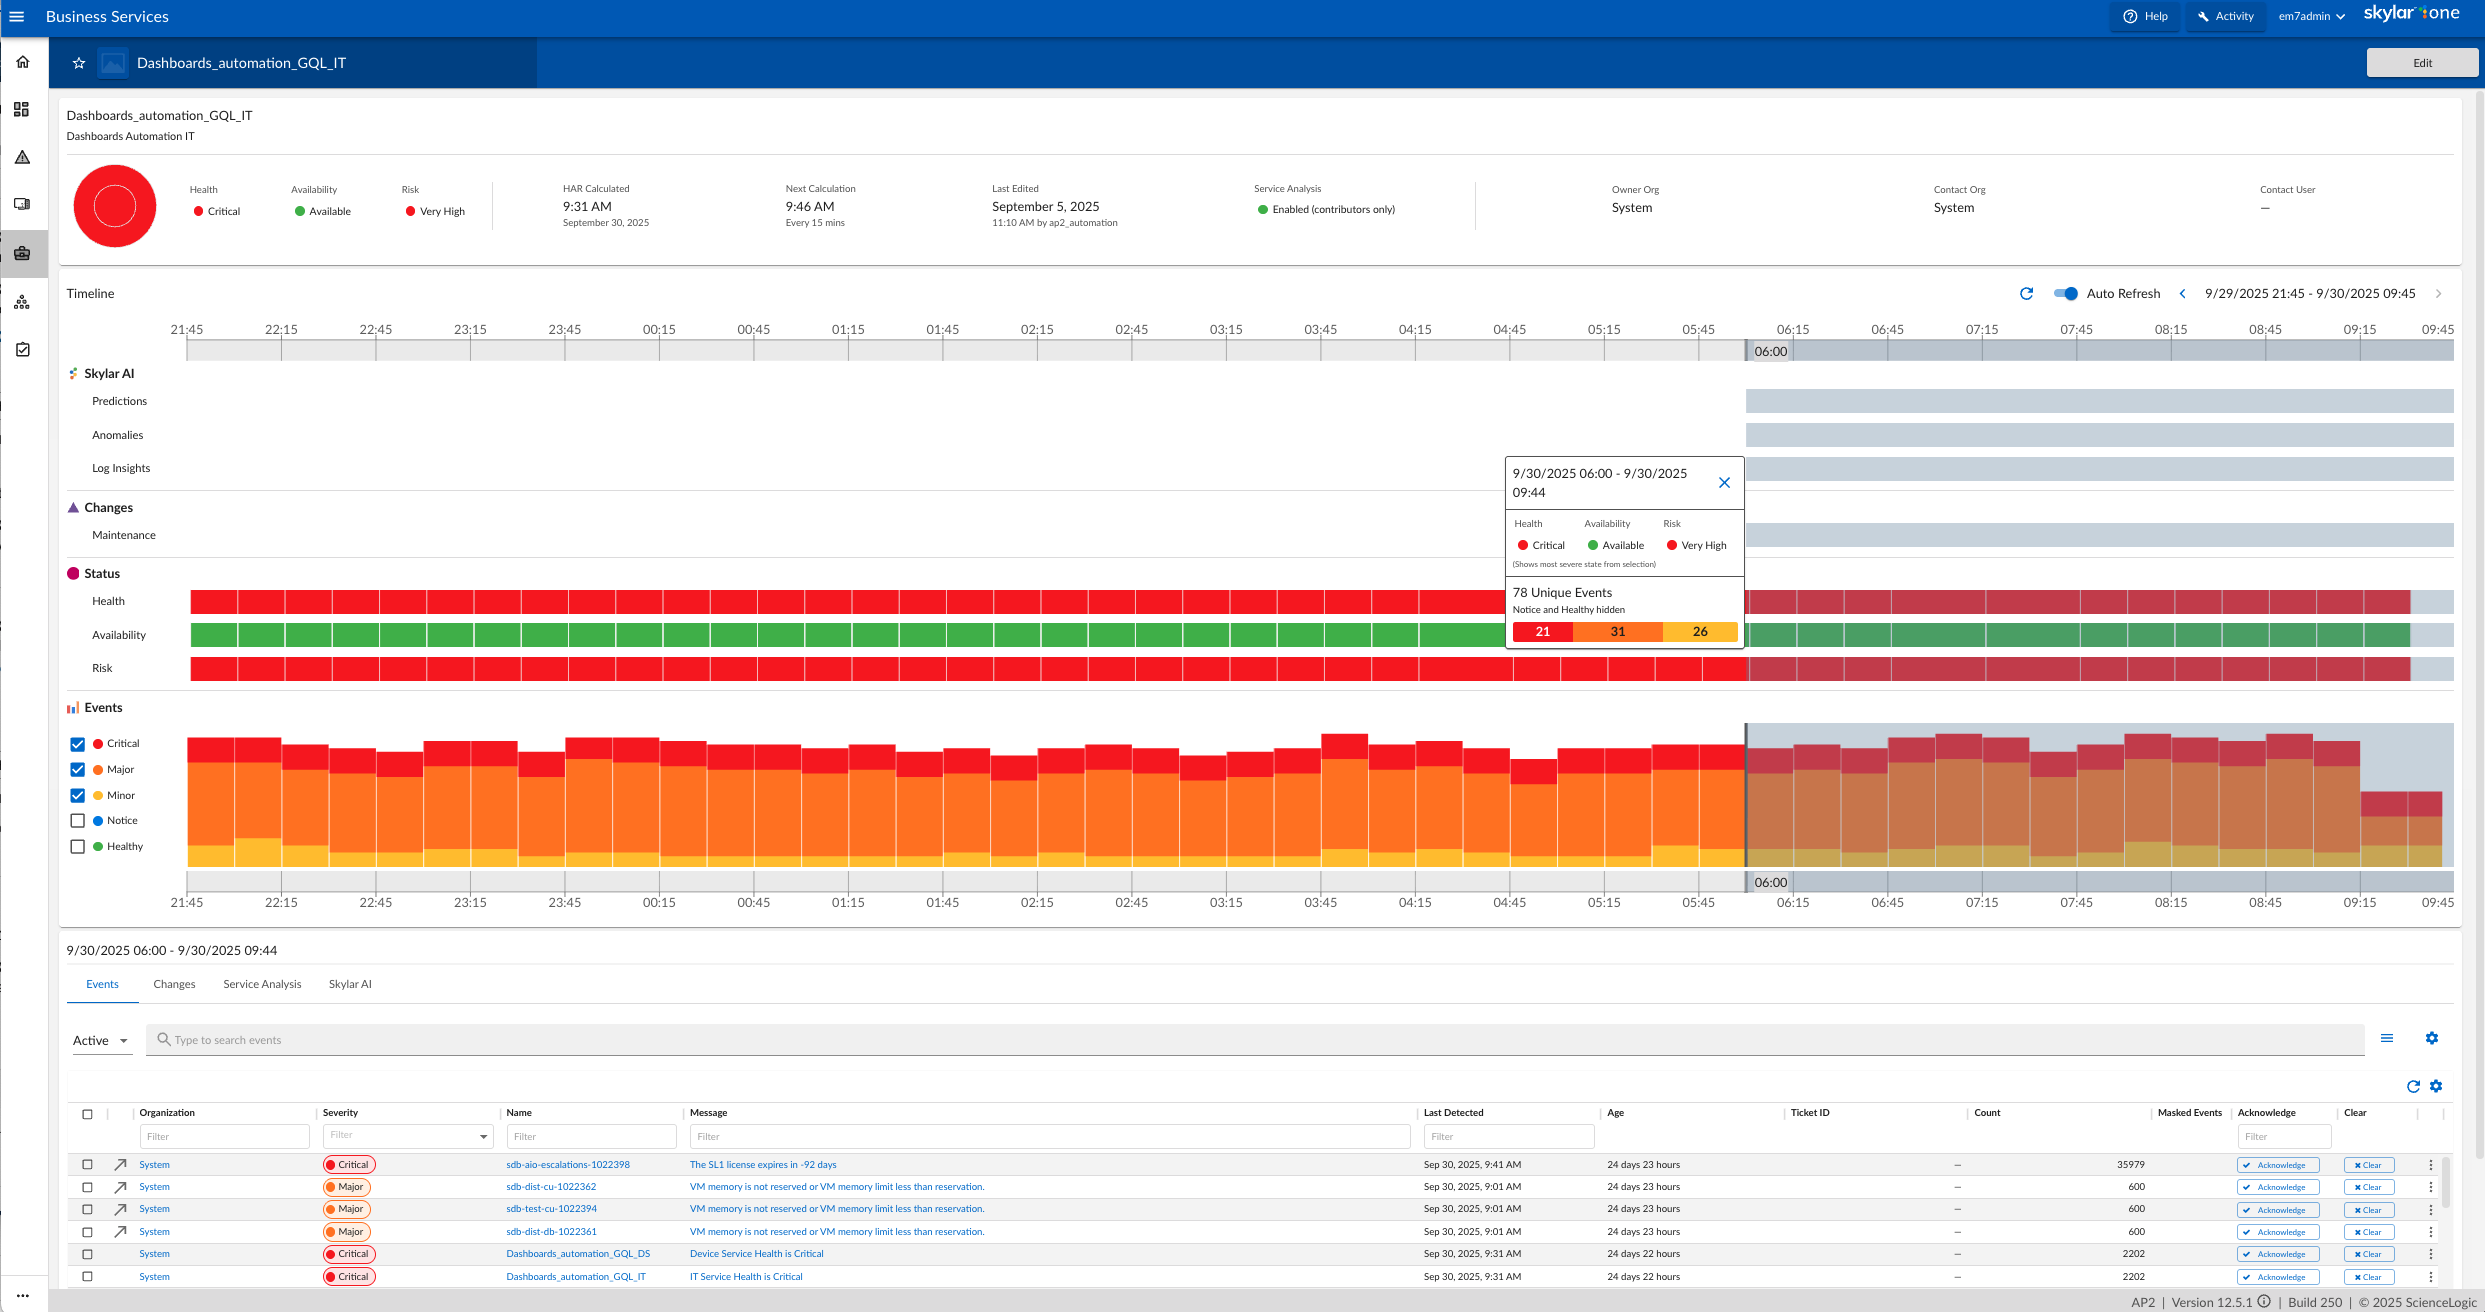     |