LiveAction’s LiveNX is a network performance monitoring and analytics platform. It supports packet-level, network-wide visibility and proactive alerts. It can be deployed on-premise, virtually, or in the cloud.
N/A
New Relic
Score 8.2 out of 10
N/A
New Relic is a SaaS-based web and mobile application performance management provider for the cloud and the datacenter. They provide code-level diagnostics for dedicated infrastructures, the cloud, or hybrid environments and real time monitoring.
$0
No credit card required; 100 GB free ingest per month, 1 free full user + unlimited basic users, 8 days retention, 100 Synthetics Checks
SolarWinds Engineer's Toolset
Score 7.7 out of 10
N/A
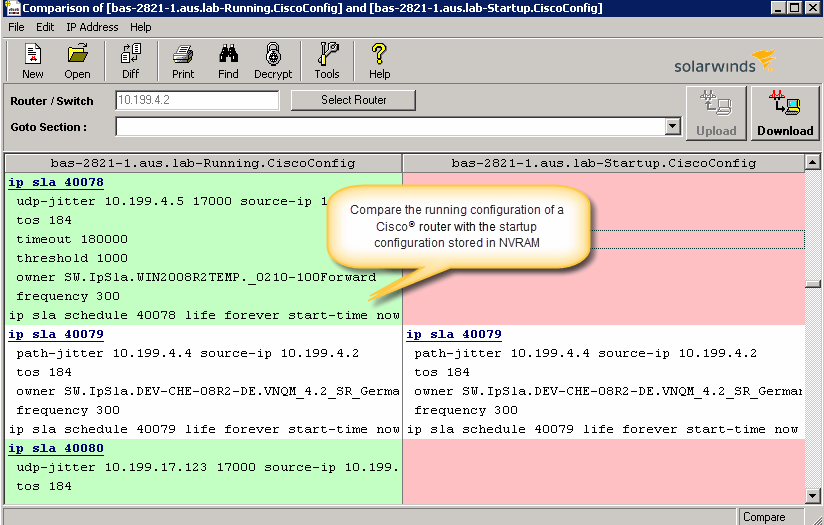
SolarWinds® Engineer’s Toolset (ETS) helps users monitor and troubleshoot a network with over 60 tools for network management. ETS allows users to monitor and receive alerts in real time on network availability and health, and perform network diagnostics for faster troubleshooting and resolution of complex
network issues. With ETS users can deploy an array of network discovery tools including Port Scanner, Switch Port Mapper or advanced Subnet Calculator, manage Cisco®
devices with specialized…
$1,585
Per Instance
Pricing
LiveAction
New Relic
SolarWinds Engineer's Toolset
Editions & Modules
No answers on this topic
Free (Forever)
$0
No credit card required; 100 GB free ingest per month, 1 free full user + unlimited basic users, 8 days retention, 100 Synthetics Checks
Telemetry Data Platform
$0.25
per month per extra GB data ingest (after first free 100GB per month)
Incident Intelligence
$0.50
per month per event (after first 1000 free events per month)
Standard
$99
per month per full user (after first free full user - unlimited free basic users)
Pro
Contact sales team
Enterprise
Contact sales team
One Time Price
$1,585
Per Instance
Offerings
Pricing Offerings
LiveAction
New Relic
SolarWinds Engineer's Toolset
Free Trial
No
No
Yes
Free/Freemium Version
No
Yes
No
Premium Consulting/Integration Services
No
No
No
Entry-level Setup Fee
No setup fee
No setup fee
No setup fee
Additional Details
—
—
—
More Pricing Information
Community Pulse
LiveAction
New Relic
SolarWinds Engineer's Toolset
Considered Multiple Products
LiveAction
Verified User
Anonymous
Chose LiveAction
Compared to ExtraHop it lacked the network analytics that compares data from an L2 up. We were able to track down rogue devices. certificates, a DNS attack, etc. that would have been a little hard to do in LiveAction. On the flip side, compared to PRTG, LiveAction has many more …
There is not any other product that does exactly what LiveAction does. Some come about halfway close, like scrutinizer by Plixer. However, there is a gap with that product as it doesn't give proper quality of service recommendations, or to update l2/l3 configs to head off …
Our infrastructure group evaluated SolarWinds from a network device management perspective and was impressed with the product. However, we were evaluating it from the device management functionality primarily, so a different role than what LiveAction was going to provide.
Before start using New Relic, we had a custom Grafana monitoring tool configured for our clients. Altough functional, it took too much time to add new alerts and monitoring features. New Relic is way easier and simpler to to configure and saves us a lot of time spent not only …
Data Dog has solutions that look more attractive, but not at their price point. We have also tried to build a solution straight from the Cloud, where our business is built, but some things are too hard to replicate. This shows that New Relic is useful and helps our efficiency.
New Relic continuously focusing on Open Telemetry and agentic AI integrations which is helping users to focus on the latest technology and as we all know that in future Observability will be mostly on OTel concept and AI driven and New Relic focusing on those area. Apart from …
The main reason is its pricing models which is value for money with respect to its features and it supports the OTEL related integrations which helps us to adopt the updations of Otel very easily and also it gives us flexible to drop the data in different stages through the …
Its covers all the observability aspects as well as giving us more competitive pricing models compared to other providers that's why I like to use New Relic in place of other tools. And also it introduces new Agentic AI features as well as it adopts AI in its RCA. As an …
Tracing of the services calls between the entire components in the architecture is good and easy to understand. Dashboarding building process is simple. UI is simple.
New Relic has full stack visibility and gives us all options for observability like one stop shop. It gives you front end, backend as well synthetic monitoring capabilities.
Every other feature built into one cost model (usually) which ties to data that you send, it helps you …
New Relic stood out to us primarily because of its all-in one approach, combining APM, infra monitoring, logs and alerts in single platform. Compared to other tools we evaluated, if offered a smoother on boarding experience and required less stitching together of different …
Less expensive than datadog and sentry with almost everything we need. Less effort to set up and maintain than elastic search and kibana so saved a ton on engineering bandwidth which would have otherwise been lost.
Solarwinds was good until they migrated to a new kind of offering and discounting the old product making it more expensive and less flexible for our specific use-case. The free trial also helped me try and get started without needing to commit. I think right now New Relic is the …
New Relic is the easiest to adopt, the price is in line with the other tools, and it has the lowest threshold to cross in order to learn the system and the platform. Adopting OpenTelemetry has been helpful in getting data aligned, and their documentation has been sufficient for …
The New Relic Platform addresses this challenge with the new plugin architecture. Plugins provide a way to monitor each of these technologies, extending the New Relic interface with custom-made dashboards specific to each. They pair the reporting of metrics specific to the …
We selected TrackJS for error monitoring and New Relic for site speed monitoring. TrackJS is a much easier to use tool for JS error monitoring, so we never ended up consolidating tools or moving over to New Relic permanently. We use New Relic for site speed monitoring and …
New Relic is the most full-featured offering that we've found, and is incredibly easy to start using with a PHP app. The New Relic agent is installed as a PHP extension so it is able to monitor and track the performance of any PHP app being run by the web server. Other tools …
New Relic is used by developers and support teams at our organisation - Splunk is used more in security monitoring by our SecOps team - not sure how they might compare doing the same job
The overlap is not large, but the one advantage of the speed curve is retention: data is available permanently, which allows you to investigate the hypothesis with data collected before formulating the hypothesis. This has proven very effective for us.
I haven't compared any tools similar to SolarWinds Engineer's Toolset. This might be because I'm pretty biased when it comes to monitoring, and reporting solutions. I've found that SolarWinds provides the biggest bang for the buck in my opinion. I'm sure there are other …
We honestly didn't look at much beyond this because of all of the tools this toolset had in it. We found a use for a good chunk of them right away, and are finding more every month it seems like. We really wanted to make use of the majority of the tools included so we could …
To be honest, I'm not aware of any other toolset from a competitor that is remotely comparable. All other monitoring systems/vendors tend to use standard browser viewable monitoring systems and the option to use a locally installed software, to obtain the same results is not …
We have used LogicMonitor, PRTG and WhatsUp Gold previously which are similar to SolarWinds Engineer's Toolset capability. However SolarWinds Engineer's Toolset is completely unique with features like - Realtime monitoring, diagnostics on the fly, network discovery, easy …
These tools complement the Engineer's Toolset. They are excellent at detecting most issues and at keeping the network monitored and protected. However, when it comes time to dig into an issue, especially a hard to fix intermittent issue, these products lack the granularity of …
I love the NPM package, but if you are doing one-off monitoring to diagnose, SolarWinds Engineer's Toolset is more than adequate. The main drawback with SolarWinds Engineer's Toolset is the monitoring is only valid as long as you have the laptop on (obviously). NPM provides for …
Because it's a great tool. Very useful, convenient and reliant, We use it to monitor out production servers and it works just great. I use it pretty much every day, and it is very good monitoring system, that allows proactively troubleshoot certain areas, because you can see …
SolarWinds NPM and NCM use a lot of the tools available in the toolset. This is a nice combo of the two with a little bit of IPAM thrown in. I would say the toolset is geared more toward the field engineer, that will be doing work that may sever communications to the rest of …
The product is best suited for performing assessments on your network infrastructure via data and voice over IP flows. Finding bandwidth hogs is also easy to do with the product (Similar to Plixer's Scrutinizer product), and permits point-and-click remediation of Quality of Service (QOS), layer2/3 transit problems, and security issues.
I have used New Relic in different scenarios like monitoring my production infrastructure and applications which helps us to reduce the downtime of my applications and websites and also I have used the synthetic monitoring feature which helps to proactively monitor our websites availability. Along with this I have also used New Relic for cloud resources cost monitoring which helps to reduce my cloud cost. Also I have used mobile application monitoring which helps me to trace the sessions easily and I can easily reduce my RCA through the help of that.
[SolarWinds Engineer's Toolset is] a great tool for monitoring database servers, highly recommended. The very good thing is that it keeps the history for two weeks, and you can see the time slice for all the server activities. Helps a lot to identify the memory and CPU bottlenecks, research blocking issues and kill the sessions, if necessary.
New Relic APM allows us to follow up transactions across services and trace performance bottlenecks in real-time, crucial when monitoring the processing of energy loads or predictive maintenance algorithms.
It gives us deep visibility into our cloud servers, containers and IOT gateways, so we can catch CPU spikes or memory leaks which can impact the data we ingest from the field devices.
We develop custom dashboards for monitoring trends of power consumption, abnormality in sensors and API health. In conjunction with alerting, it makes sure we are fixing issues before customers even see them.
The unifying component that is intended to be the initial interface to the tools seems clunky. I prefer to start the tools individually rather than using it.
The port scanner could use some improvements to make it easier to use.
I have not yet found any similar product that offers me this range of features to help us keep our online service fast and reliable. Besides this, New Relic is constantly evolving by adding new plugins to emerging technologies and platforms. Server performance measuring features are a key point as our user database grows.
I have given this much rating as I am used New Relic in different sectors and for different use cases like its K8s monitoring, infra monitoring, full stack monitoring as compare to other tools New Relic gives data in a formatted and connected way, and also it is giving us value for money. It also launches new features day by day which helps users to track the issue very quickly. It also supports OTel integrations which is the latest trend of observability tools. thats why I had given this much rating to New Relic.
Can't really rate this, we never had to call support. The product wasn't complicated to setup and learn. We have a high level of network knowledge so the product was self-explanatory.
The support team has been really helpful and resolved most of the issues on time. However, for a couple of issues, several follow-ups were needed to elicit a reasonable response. The issue was deeply technical and could have been investigated only by their Architects, and bringing them into the ticket took longer than needed
The documentation was clear and concise; the only issue we ran into was custom application naming. Due to HTTPD mod_fcgid and the need for the application name to be set in php.ini (not in .htaccess or the virtual host directive) ... we had issues setting this up.
Compared to ExtraHop it lacked the network analytics that compares data from an L2 up. We were able to track down rogue devices. certificates, a DNS attack, etc. that would have been a little hard to do in LiveAction. On the flip side, compared to PRTG, LiveAction has many more features that PRTG is lacking. The reporting, actions and visual analytics alone were better.
Before start using New Relic, we had a custom Grafana monitoring tool configured for our clients. Altough functional, it took too much time to add new alerts and monitoring features. New Relic is way easier and simpler to to configure and saves us a lot of time spent not only on configuration, but also keeping the service working.
These tools complement the Engineer's Toolset. They are excellent at detecting most issues and at keeping the network monitored and protected. However, when it comes time to dig into an issue, especially a hard to fix intermittent issue, these products lack the granularity of monitoring needed for these types of issues. Having said that the toolset is not made to do full time enterprise level monitoring. With these tools and the toolset I am able to have a more complete view of the network and deliver higher levels of service and quicker responses to issues.