New Relic is a SaaS-based web and mobile application performance management provider for the cloud and the datacenter. They provide code-level diagnostics for dedicated infrastructures, the cloud, or hybrid environments and real time monitoring.
$0
No credit card required; 100 GB free ingest per month, 1 free full user + unlimited basic users, 8 days retention, 100 Synthetics Checks
PingPlotter
Score 8.9 out of 10
N/A
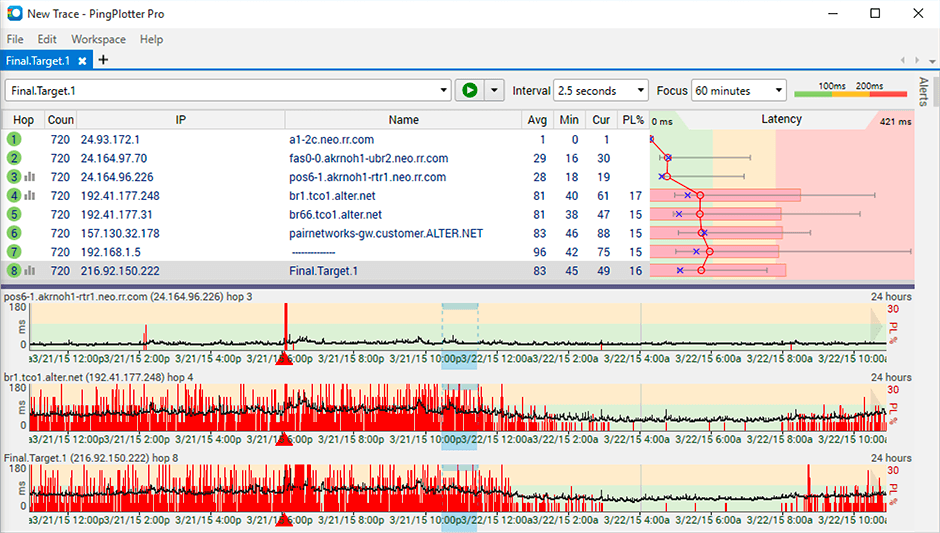
PingPlotter is a graphical traceroute and ping tool that visualizes network performance in a way that makes identifying the source of problems quicker and easier for everyone from online gamers and video streamers to VoIP admins and IT pros. Features for remote deployment, network monitoring, scripting, and a web interface are included along with several additional capabilities.
$0
per user
Pricing
New Relic
PingPlotter
Editions & Modules
Free (Forever)
$0
No credit card required; 100 GB free ingest per month, 1 free full user + unlimited basic users, 8 days retention, 100 Synthetics Checks
Telemetry Data Platform
$0.25
per month per extra GB data ingest (after first free 100GB per month)
Incident Intelligence
$0.50
per month per event (after first 1000 free events per month)
Standard
$99
per month per full user (after first free full user - unlimited free basic users)
Pro
Contact sales team
Enterprise
Contact sales team
PingPlotter Free
$0.00
per user
PingPlotter Free
$0.00
per user
PingPlotter Standard
$6.99
per user per month
PingPlotter Professional
$29.00
per user per month
PingPlotter Standard
$39.99
per user
PingPlotter Professional
$349.00
per user
Offerings
Pricing Offerings
New Relic
PingPlotter
Free Trial
No
Yes
Free/Freemium Version
Yes
Yes
Premium Consulting/Integration Services
No
No
Entry-level Setup Fee
No setup fee
No setup fee
Additional Details
—
—
More Pricing Information
Community Pulse
New Relic
PingPlotter
Features
New Relic
PingPlotter
Network Performance Monitoring
Comparison of Network Performance Monitoring features of Product A and Product B
New Relic its an excellent tool for monitoring services used on the SAAS universe, like web servers, relational and nosql dbms, reverse proxies, text databases, etc. Its also a powerful tool to monitor resource usage on said servers. However, its not well fitted to monitor custom services - if you need to generate alerts based on logs or database information, for example
It is well suited for performing monitoring and testing from a single device. It is less appropriate if you have to monitor from multiple different endpoints. That type of deployment would be more of an enterprise application. If you are looking for an end user monitoring solution then PingPlotter is the one for you.
And while powerful, building tailored dashboards with organ-specific metrics (such as energy load variance across regions) can be difficult to navigate. The UI isn't as drag-and-drop easy, and query-based widgets typically involve some trial and error for non-devs.
Alerts may be hypersensitive or over general. I We often get a spam of non-critical alerts while doing load testing, all overhauling to me alone and making it difficult to identify actual issues especially in energy systems where spikes are very common.
With our expanding fleet of Iot devices, the per-host pricing model is becoming expensive, quickly. More detailed billing based on microservices, or that works at sensor level, would make it more adaptable for energy platforms.
Its a little confusing to see which targets are currently running pings and which ones are displayed in the plots.
Starting and stopping pings requires a right click and that would be better with a play/pause button I think.
Ability to drag and drop the graphs to reorder them.
more columns to show which targets are running and which are displayed. Currently this is done with symbols so you cant sort by just the running targets for example I've found.
The only issue that we have had with New Relic is that the price might be a little expensive for smaller companies. The amount of data you store in New Relic impacts the cost, and can get away from you if you don't work closely with the vendor. Overall though the application is top notch.
I have given this much rating as I am used New Relic in different sectors and for different use cases like its K8s monitoring, infra monitoring, full stack monitoring as compare to other tools New Relic gives data in a formatted and connected way, and also it is giving us value for money. It also launches new features day by day which helps users to track the issue very quickly. It also supports OTel integrations which is the latest trend of observability tools. thats why I had given this much rating to New Relic.
I installed it and it just started working. I realized I could then tweak it to show what I needed but didn't have to spend a long time configuring it before use, editing YAML files etc. Maybe that's fine for a network professional, but I only need this software if something goes wrong, and then need it to work quickly out of the box.
The support team has been really helpful and resolved most of the issues on time. However, for a couple of issues, several follow-ups were needed to elicit a reasonable response. The issue was deeply technical and could have been investigated only by their Architects, and bringing them into the ticket took longer than needed
I have not had much contact with the PingPlotter support, only one time have I went to them and it was a positive experience. The questions I had were answered quickly and professionally. I have no issue with the experience I had with the Support team. This was from before and after the purchase of the product.
It's better to start by implementing New Relic in one project and test everything. Try to follow best recommended practices and read all the official documentation. Everything seems well tested. Then, start by installing agents to the rest of your projects and keep a close look to all logs and metrics New Relic gives you.
Data Dog has solutions that look more attractive, but not at their price point. We have also tried to build a solution straight from the Cloud, where our business is built, but some things are too hard to replicate. This shows that New Relic is useful and helps our efficiency.
I used Ping.app and UptimeLog.app on the Mac. These both provided different aspects. These two had a menubar to show me green or red for multiple connections. UptimeLog showed me very clearly when my connectivity was on or off and for exactly how long