
Jerome Lambert, PhD
Business Analyst | Digital Analytics
Chose Microsoft BI (MSBI)
| Product | Rating | Most Used By | Product Summary | Starting Price |
|---|---|---|---|---|
 ConnectWise PSA | Small Businesses (1-50 employees) | ConnectWise PSA (formerly Manage) is a business management platform for companies that sell, service, and support technology. The platform is cloud-based and integrates automation, help desk and customer service, sales, marketing, project management, and business analytics. It is the hub of the ConnectWise suite. | $35 Per Tech Per Month | |
 Microsoft BI (MSBI) | N/A | Microsoft BI is a business intelligence product used for data analysis and generating reports on server-based data. It features unlimited data analysis capacity with its reporting engine, SQL Server Reporting Services alongside ETL, master data management, and data cleansing. | $14 per month per user | |
 Tableau Desktop | N/A | Tableau Desktop is a data visualization product from Tableau. It connects to a variety of data sources for combining disparate data sources without coding. It provides tools for discovering patterns and insights, data calculations, forecasts, and statistical summaries and visual storytelling. | $1,380 per year (purchased via a Creator license) |
| ConnectWise PSA | Microsoft BI (MSBI) | Tableau Desktop | ||||||||||||||||||||||
|---|---|---|---|---|---|---|---|---|---|---|---|---|---|---|---|---|---|---|---|---|---|---|---|---|
| Editions & Modules |
|
|
| |||||||||||||||||||||
| Offerings |
| |||||||||||||||||||||||
| Entry-level Setup Fee | No setup fee | No setup fee | No setup fee | |||||||||||||||||||||
| Additional Details | — | — | All pricing plans are billed annually. A Creator license includes Tableau Desktop, Tableau Prep Builder, and Tableau Pulse. Discounts sometimes available for volume. | |||||||||||||||||||||
| More Pricing Information | ||||||||||||||||||||||||
| ConnectWise PSA | Microsoft BI (MSBI) | Tableau Desktop | |
|---|---|---|---|
| Considered Multiple Products |  ConnectWise PSA No answer on this topic | Microsoft BI (MSBI) Jerome Lambert, PhD Business Analyst | Digital Analytics Chose Microsoft BI (MSBI)  Ved Mishra SharePoint/MS Project Server Engineer Chose Microsoft BI (MSBI) Microsoft BI is a great tool when it comes to various integration with line of business applications and its own ecosystem which contains office applications widely used all over the world. Hence, it is well suited for organizations that are complex and have global foot-print. …  Micah Jones Chief Information Officer Chose Microsoft BI (MSBI)  Alexander Lubyansky Technical Leader for Modeling and Simulation Chose Microsoft BI (MSBI) Looking at the visualization portion of BI, there are three types of tools.
 Jasmeet S Babra Marketing Data Analyst Chose Microsoft BI (MSBI)  Charles Saulnier Conseiller à l'implantation, Solutions de performance et gestion de l'information Chose Microsoft BI (MSBI) For analysis and visualization, Power BI is aiming to take a large chunk of Tableau's market share. The rhythm of iterations at this time has in my opinion given the momentum to Power BI. The added functionalities in Excel also make it possible for intermediate users to get …  Al Mubassir Muin Software Engineer Chose Microsoft BI (MSBI) Better integration with Microsoft products is one of the advantages of using Business Intelligence (BI). It's simple to understand, and plenty of resources are available to outsource it. Many of our existing clients have Microsoft licensing agreements. It's an obvious path when …  Aononna Tazin Customer Relationship Management Specialist Chose Microsoft BI (MSBI) Outsourcing work is easy to understand, and there are plenty of resources available in the marketplace. It is expensive, but it is still significantly less costly than the alternatives. Results from Microsoft BI (MSBI) are dependable; therefore, there is no problem with trust. …  Nilufa Hossain IT Specialist Chose Microsoft BI (MSBI) MSBI is great for data collection and reporting, but it lacks the visual appeal and features of Power BI. Even though it's still useful, it falls short of Power BI in terms of features. There's no reason to doubt MSBI's findings. MSBI has a proactive customer service team that …  Hrishikesh Kardile Logistics Analyst Chose Microsoft BI (MSBI) Microsoft BI is much cheaper.  Shelby Bowden Graduate Research Assistant Chose Microsoft BI (MSBI) Specific data displays are some of the strongest aspects of Microsoft BI when compared to alternate programs. It also does a superior job in compatibility with many programs, especially those from Microsoft. Since my company primarily uses Office 365 and other Microsoft …  Yemsi Pino Planificador Territorial II Chose Microsoft BI (MSBI) The software stacks [well] because it has more graphics resolution and the colors are fresh and actualized. On the other hand, there is the Microsoft family software and this is an advantage. Microsoft has a lot of users around the world and it's like everyone knows how to do …  Haibo Yang BI Reporting Specialist Chose Microsoft BI (MSBI) I'd rather not say to avoid unnecessary arguments. Thanks.  Chris Utter Regional BI Practice Director Chose Microsoft BI (MSBI) With over 20 years in IT, I have experienced a full range of relational and non-relational data solutions, from Oracle and Informix to MongoDB and Hadoop. In my opinion, the Microsoft BI stack is the most complete, well-rounded, high performing data management system on the …  Sean Warren CIO (Chief Information Officer) Chose Microsoft BI (MSBI) Microsoft is a distant me too in a world that is crowded and drowning in BI Me too products. Visualizations 5/10. Micro Strategy, ClickView, Domo, BOBJ etc will kill this product. The issue is cost and speed to implementation. The cost is far less than any of the previously … |  Tableau Desktop  Jake Lanier Marketing Analyst Chose Tableau Desktop While I haven't done a lot of work in Microsoft BI, I do think they are on the right road to being a great product but they definitely lag behind Tableau in the number of features available. Obviously, it does integrate well with Microsoft products, but it remains to be seen …  John Rome Deputy CIO and BI Strategist Chose Tableau Desktop Tableau supports more data sources that both Amazon QuickSight and Microsoft Power BI. It also created a much more sophisticated dashboard which is important for leadership and others who use it. However, we use other products like Toad Data Point and Alteryx and tools that …  Akshaya Bhardwaj Consultant Chose Tableau Desktop It is very easy to use, we can create numbers of charts through it which I think other tools lack in. Lots of online communities are there which have provided solutions to the basic issues. Its ODS(output delivery system) is also very effective. We can use SQL in it for …  Abanish Mishra Business Intelligence Analyst Chose Tableau Desktop My current work environment uses both Tableau Online, MicroStrategy & SSRS in parallel. Tableau is much closer to the SSRS in terms of visualization tool where as MicroStrategy is an enterprise data modeling and reporting tool. Based on the use case we use different tools. Here … Jasmeet S Babra Marketing Data Analyst Chose Tableau Desktop Excel, Google Analytics, Google Charts Alexander Lubyansky Technical Leader for Modeling and Simulation Chose Tableau Desktop Excel is almost as good as Tableau. If you have a few thousand floating around just spring for the Tableau. QlikView is an abomination. Not much else to say there. SAS and friends are like ye olde-timey versions of Tableau in terms of their visualization abilities. Python, R, …  David Barrymore IMS Cloud CEO and Director of Business Intelligence Services Chose Tableau Desktop Tableau Desktop is at the bottom of the stack (right next to QlikCloud). |
| ConnectWise PSA | Microsoft BI (MSBI) | Tableau Desktop | |||||||||||||||||||||||||||
|---|---|---|---|---|---|---|---|---|---|---|---|---|---|---|---|---|---|---|---|---|---|---|---|---|---|---|---|---|---|
| Incident and problem management |
| ||||||||||||||||||||||||||||
| Self Help Community |
| ||||||||||||||||||||||||||||
| Multi-Channel Help |
| ||||||||||||||||||||||||||||
| BI Standard Reporting |
| ||||||||||||||||||||||||||||
| Ad-hoc Reporting |
| ||||||||||||||||||||||||||||
| Report Output and Scheduling |
| ||||||||||||||||||||||||||||
| Data Discovery and Visualization |
| ||||||||||||||||||||||||||||
| Access Control and Security |
| ||||||||||||||||||||||||||||
| Mobile Capabilities |
| ||||||||||||||||||||||||||||
| Application Program Interfaces (APIs) / Embedding |
|
| ConnectWise PSA | Microsoft BI (MSBI) | Tableau Desktop | |
|---|---|---|---|
| Small Businesses |  Agiloft Service Desk (discontinued) Score 9.0 out of 10 |  Yellowfin Score 8.7 out of 10 | Yellowfin Score 8.7 out of 10 |
| Medium-sized Companies | Agiloft Service Desk (discontinued) Score 9.0 out of 10 |  Reveal Score 10.0 out of 10 | Reveal Score 10.0 out of 10 |
| Enterprises |  SysAid Score 8.9 out of 10 |  Kyvos Semantic Layer Score 9.5 out of 10 | Kyvos Semantic Layer Score 9.5 out of 10 |
| All Alternatives | View all alternatives | View all alternatives | View all alternatives |
| ConnectWise PSA | Microsoft BI (MSBI) | Tableau Desktop | |
|---|---|---|---|
| Likelihood to Recommend | 8.3 (143 ratings) | 10.0 (73 ratings) | 8.8 (203 ratings) |
| Likelihood to Renew | 7.6 (25 ratings) | 8.0 (25 ratings) | 7.5 (41 ratings) |
| Usability | 8.3 (35 ratings) | 10.0 (15 ratings) | 8.3 (73 ratings) |
| Availability | 8.0 (4 ratings) | 9.5 (2 ratings) | 10.0 (11 ratings) |
| Performance | 1.0 (7 ratings) | 7.0 (2 ratings) | 8.0 (10 ratings) |
| Support Rating | 5.3 (27 ratings) | 8.9 (15 ratings) | 1.0 (57 ratings) |
| In-Person Training | - (0 ratings) | 6.9 (3 ratings) | 9.4 (4 ratings) |
| Online Training | 5.0 (8 ratings) | 8.5 (2 ratings) | 8.0 (5 ratings) |
| Implementation Rating | 1.0 (5 ratings) | 9.6 (7 ratings) | 8.0 (34 ratings) |
| Configurability | 1.0 (1 ratings) | 10.0 (2 ratings) | 7.0 (3 ratings) |
| Ease of integration | 1.0 (2 ratings) | - (0 ratings) | 10.0 (1 ratings) |
| Product Scalability | 1.0 (7 ratings) | - (0 ratings) | 9.0 (4 ratings) |
| Vendor post-sale | 1.0 (1 ratings) | - (0 ratings) | 10.0 (1 ratings) |
| Vendor pre-sale | 10.0 (1 ratings) | - (0 ratings) | 10.0 (1 ratings) |
| ConnectWise PSA | Microsoft BI (MSBI) | Tableau Desktop | |
|---|---|---|---|
| Likelihood to Recommend | ConnectWise
 Jeremy Herman Security Engineer | Microsoft
 Adam Montgomery Partnership Manager | Tableau
 Karol Kozłowski Project manager |
| Pros | ConnectWise
 Alissa Levanway Purchasing Agent | Microsoft
Nilufa Hossain IT Specialist | Tableau
 Afia Tamanna Information Technology Business Consultant |
| Cons | ConnectWise
 Ali Gaeta Manager of Managed Services | Microsoft
| Tableau
|
| Likelihood to Renew | ConnectWise
 Delano Collins Chief Information Officer | Microsoft
 Lee Cullom President | Tableau
|
| Usability | ConnectWise
 Wes Jensen Chief Anxiety Eliminator | Microsoft
| Tableau
Al Mubassir Muin Software Engineer |
| Reliability and Availability | ConnectWise
| Microsoft
 Robert Goodman Director, Business Intelligence & Analytics | Tableau
 Brad Llewellyn Associate Data Analytics Consultant |
| Performance | ConnectWise
 David Pavuk Director of Compliance and Efficiency | Microsoft
Robert Goodman Director, Business Intelligence & Analytics | Tableau
|
| Support Rating | ConnectWise
 Jennifer Henney Systems Analyst | Microsoft
| Tableau
|
| In-Person Training | ConnectWise No answers on this topic | Microsoft
 Stephanie Grice Business Intelligence Analyst | Tableau
 Jon Boeckenstedt Associate Vice President |
| Online Training | ConnectWise
 Graham Green Commercial Manager | Microsoft
 Sean Brady Business Intelligence Architect | Tableau
|
| Implementation Rating | ConnectWise
| Microsoft
 Jacob Saunders National Practice Director - Business Intelligence | Tableau
 David Fickes Decision Sciences - Modeling, Simulation & Analysis |
| Alternatives Considered | ConnectWise
 Stephen Muenstermann President/CEO | Microsoft
| Tableau
|
| Scalability | ConnectWise
 Nicolas Poague NOC/Design Technician | Microsoft No answers on this topic | Tableau
|
| Return on Investment | ConnectWise
 Daren Anderson, MSIS President | Microsoft
Haibo Yang BI Reporting Specialist | Tableau
|
| ScreenShots | ConnectWise PSA Screenshots 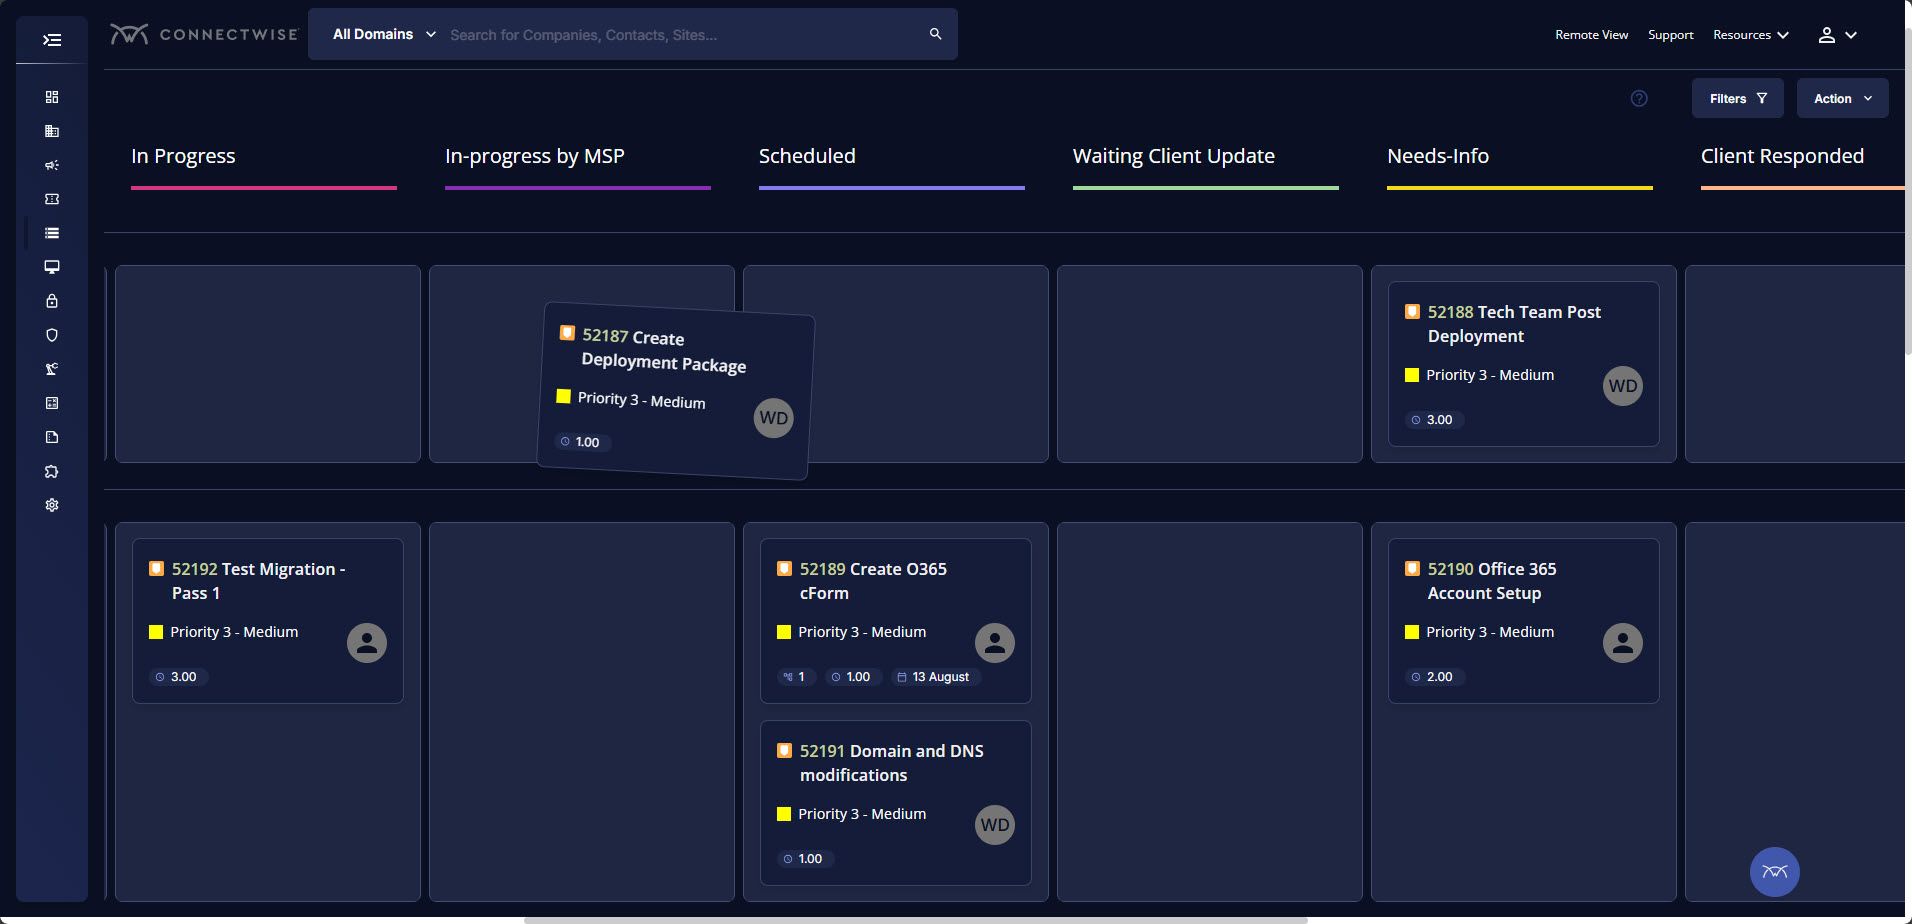 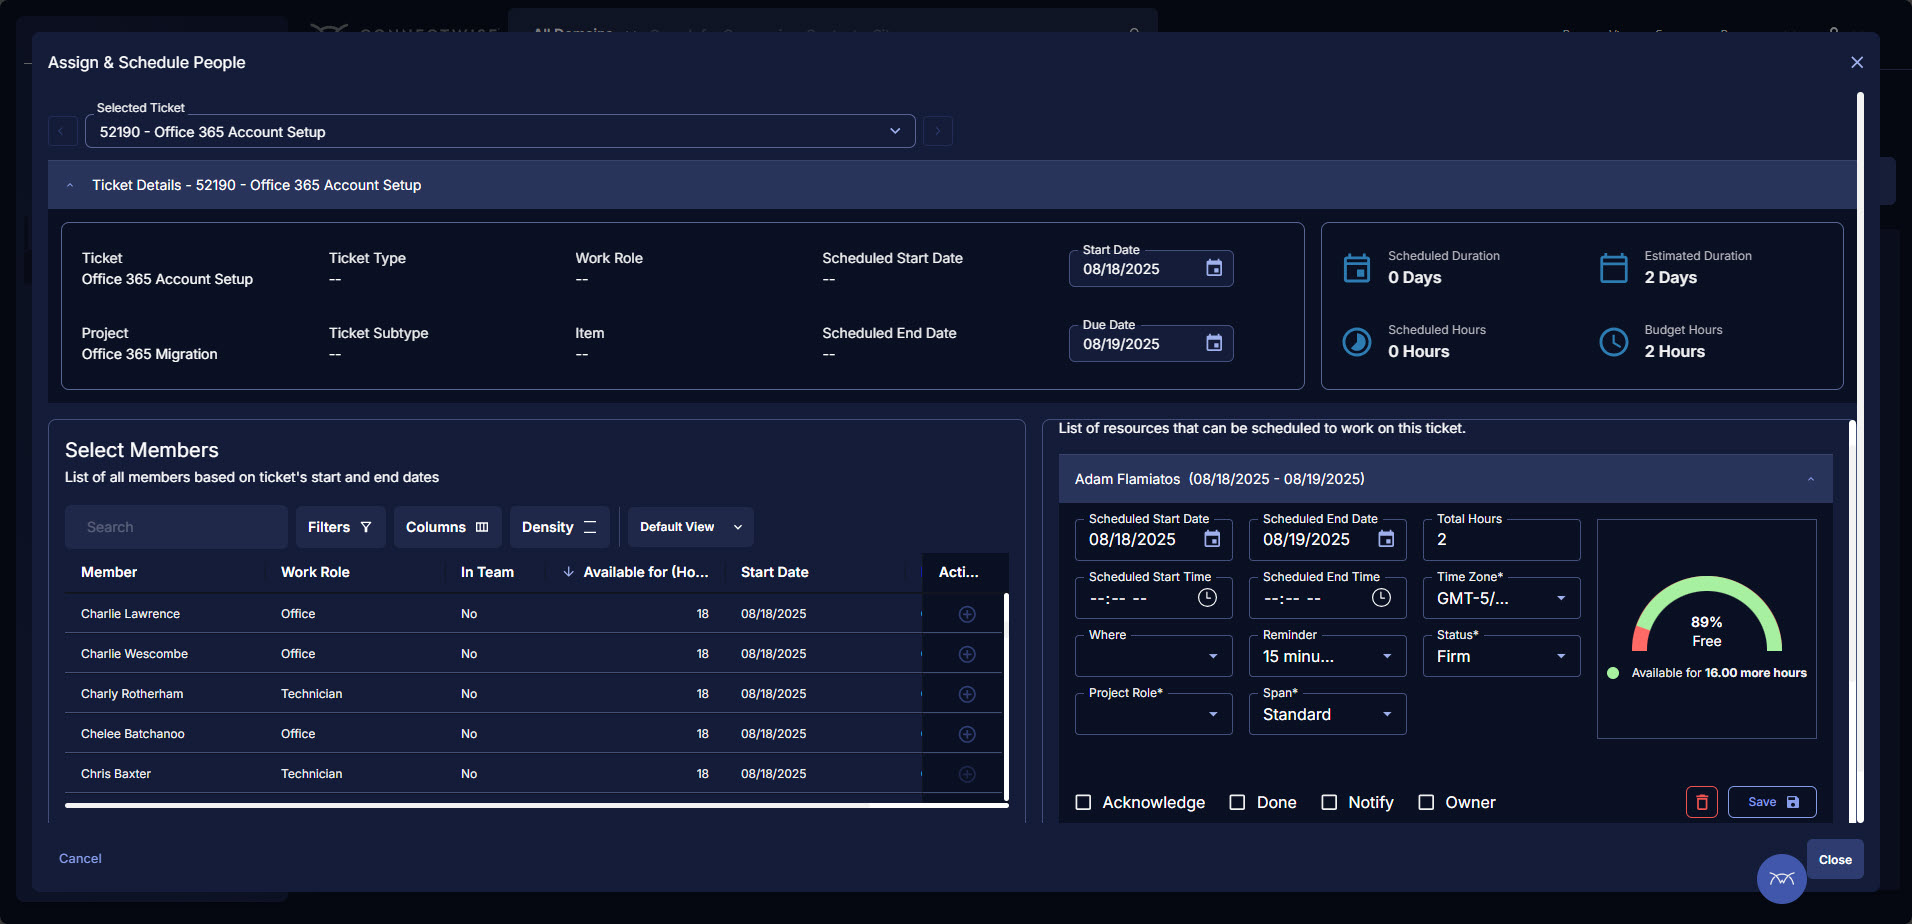  |