Datadog is a monitoring service for IT, Dev and Ops teams who write and run applications at scale, and want to turn the massive amounts of data produced by their apps, tools and services into actionable insight.
$18
per month per host
Dynatrace
Score 8.4 out of 10
N/A
Dynatrace is an APM scaled for enterprises with cloud, on-premise, and hybrid application and SaaS monitoring. Dynatrace uses AI-supported algorithms to provide continual APM self-learning and predictive alerts for proactive issue resolution.
$0
per synthetic request
OCI
Score 8.1 out of 10
N/A
Oracle Cloud Infrastructure (OCI) is Oracles's infrastructure-as-a-service (IaaS) platform which combines the utility of public cloud with the granular control, security, and predictability of on-premises infrastructure.
N/A
Pricing
Datadog
Dynatrace
Oracle Cloud Infrastructure
Editions & Modules
Log Management
$1.27
per month (billed annually) per host
Infrastructure
$15.00
per month (billed annually) per host
Standard
$18
per month per host
Enterprise
$27
per month per host
DevSecOps Pro
$27
per month per host
APM
$31.00
per month (billed annually) per host
DevSecOps Enterprise
$41
per month per host
Synthetic Monitoring
$0.001
per synthetic request
Kubernetes Platform Monitoring
$0.002
per hour for any size pod
Real User Monitoring
$0.00225
per session
Application Security
$0.018
per hour for 8 GIB host
Infrastructure Monitoring
$0.04
per hour for any size host
Full-Stack Monitoring
$0.08
per hour for 8 GIB host
No answers on this topic
Offerings
Pricing Offerings
Datadog
Dynatrace
OCI
Free Trial
Yes
No
Yes
Free/Freemium Version
Yes
No
Yes
Premium Consulting/Integration Services
No
No
Yes
Entry-level Setup Fee
Optional
No setup fee
Optional
Additional Details
Discount available for annual pricing. Multi-Year/Volume discounts available (500+ hosts/mo).
Easier to set up and integrate with other auxiliary tools. The cost was also a benefit along with self-service capabilities. We could set up Data Dog by ourselves, versus needing to bring additional consulting efforts to setup Dynatrace. Reliability of results (less false …
Dynatrace was cheaper but, in my opinion, its setup, features, and overall user experience do not come close to what Datadog can offer, making it more of a pain to use and not worth the cheaper cost over Datadog (especially if migrating away from Datadog to Dynatrace).
First think first - it's easy to use, and very easy to implement in any infrastructure. It provides a custom dashboard and monitors. I’ve used or evaluated Grafana, Prometheus, Amazon CloudWatch, and Dynatrace, and each tool has strong capabilities. Prometheus + Grafana provide …
Datadog is best for cloud-native and fast-setup. It is more mature for infrastructure and real-time observability. The UI is more user-friendly and provides wide coverage of app insights.
UI of the Datadog is easy to understand and integration steps are easy to understand. It also provides the troubleshooting steps which are easy to understand. Supports multi cloud integrations which is very important for all the customers to know about the cloud service's …
Verified User
Engineer
Chose Datadog
I selected Datadog because of its features and the wide range of integration support. As I already told it supports more that 600+ integrations which helps and organization to keep everything in a single place and also its AI feature which is reducing the time for root cause …
Datadog crushed the competition on price and offering more solutions in one product cutting down on implementation time and effort while ensuring that the "integration" between one of their offerings was completely compatible with any of the others. I'm sure it's not the case …
The first reason for selecting Datadog was of course it's pricing which is quite better in terms of competitor like AppDynamics and splunk. Second thing is versatile services which they are offering on one platform which means entire end to end services can be monitor at one …
It's a one-stop solution for all our needs whereas in other open-source tools, we have an operational overhead to keep and manage the uptime of these tools as well and also manage their versioning, upgrade, and patching cycle. Also if there are any bugs then we have to raise an …
Datadog is a little harder to use from an end user standpoint but is probably a little more flexible from a script/automation perspective; it has more granular permissions but default access is not ideal for our usage. Sensu doesn't do application performance monitoring. …
There are many pros and cons. For some use cases, Dynatrace far exceeds the capabilities of the competition--for instance in automatically detecting issues and performing root-cause analysis, Dynatrace is clearly ahead of the others. For cloud monitoring, Datadog seems to have …
Datadog is a good system but does lack a lot of features provided by Dynatrace, and more importantly, it does not have the support Dynatrace provides. Many other systems, Zabbix, Nagio, AppDynamics also exist, but so far, Dynatrace really shines above them all.
Dynatrace gives the overall picture of the application usage and performance by default with minimal configurations whereas in Datadog a lot of manual intervention is required to analyze the application performance and troubleshooting the issues. Dynatrace is user-friendly when …
Our technical team showed me the completeness of Dynatrace against the competitors. Also, the breadth of services Dynatrace offered was a selling point.
Dynatrace leads the pack when you are looking for application performance monitoring, but the other tools are better suited for certain areas of specialty. Elasticsearch is better than Dynatrace at log aggregation. Prometheus is better than Dynatrace at collecting custom …
Dynatrace is a premier tool for hybrid environments. It also happens to be the most expensive. Dynatrace is bad at pricing and customer success. They charge a premium but do offer one of the better solutions on the market.
Senior Director of Engineering Site Reliability, Performance & Capacity
Chose Dynatrace
Dynatrace provides the deep dive analysis on our pure paths like none other. The AI capabilities are very promising and helpful in our drive toward self-healing systems. We also like the bot, Davis, that can help solve some of the ops issues.
It is so much easier to deploy and use that it is almost impossible to compare.
OCI
Verified User
Engineer
Chose Oracle Cloud Infrastructure
Oracle Cloud Infrastructure is great because of the ample storage and quick loading times we receive compared to others. The cost is also very manageable. We like how Oracle is structured and we utilize the machine learning and AI built in tools quite often. We are very pleased …
Datadog may be better suited for teams that have a more out-of-the-box infrastructure, on the primary platforms Datadog supports. You may also have better results if you have a bigger team dedicated to devops and/or a bigger budget. We found that trying to adapt it to our use case (small team, .NET on AWS Fargate) wasn't feasible. We continually ran into roadblocks that required us to dig through documentation (and at times, having to figure out some documentation was wrong), go back and forth with support, and in my opinion, waste money on excessive and unintended usages due to opaque pricing models and inaccurate usage reports, as well as broken/non-functional rate sampling controls.
Dynatrace is well suited to a number of tasks. It is important to determine who the end users are and gather good information to tailor their experience accordingly. For instance, business/marketing should not have access to some of the more technical data, and business metrics can be a distraction for IT operations personnel.
As per our usage Oracle Cloud Infrastructure for almost 6 years hosting 500 + customers I can say its well suited application for any small scale to larger scale application as it can handle that capacity and provide more reliable cloud service only if you need any messaging service like pub/sub or sqs better to consider other services.
The thing which Datadog does really well, one of them are its broad range of services integrations and features which makes it one step observability solution for all. We can monitor all types of our application, infrastructure, hosts, databases etc with Datadog.
Its custom dashboard feature which helps us to visualize the data in a better way . It supports different types of charts through those charts we can create our dashboard more attractive.
Its AI powered alerting capability though that we can easily identify the root cause and also it has a low noise alerting capability which means it correlated the similar type of issues.
We loved Dynatrace's ability to show the data flow - from the front end points through the back end points straight to the database and various API's. It was advanced in its data visualization. This is useful for debugging - showing when/where the errors are. It can even enable non-technical individuals in the corporation to help debug
Dynatrace has some great highly customizable integration options as well as monitoring. You can configure your layout & integration options to create custom monitoring alerts for your applications performance. Further you can increase the extensibility of using a REST API on your architecture.
Some advanced dev-ops systems are utilizing Kubernetes/docker aswell as Node.JS - Dynatrace was able to log and help understand all of our dev-ops needs. It gave us native alerts based off of deviations from the baseline that we set during initial configuration. These metrics are priceless.
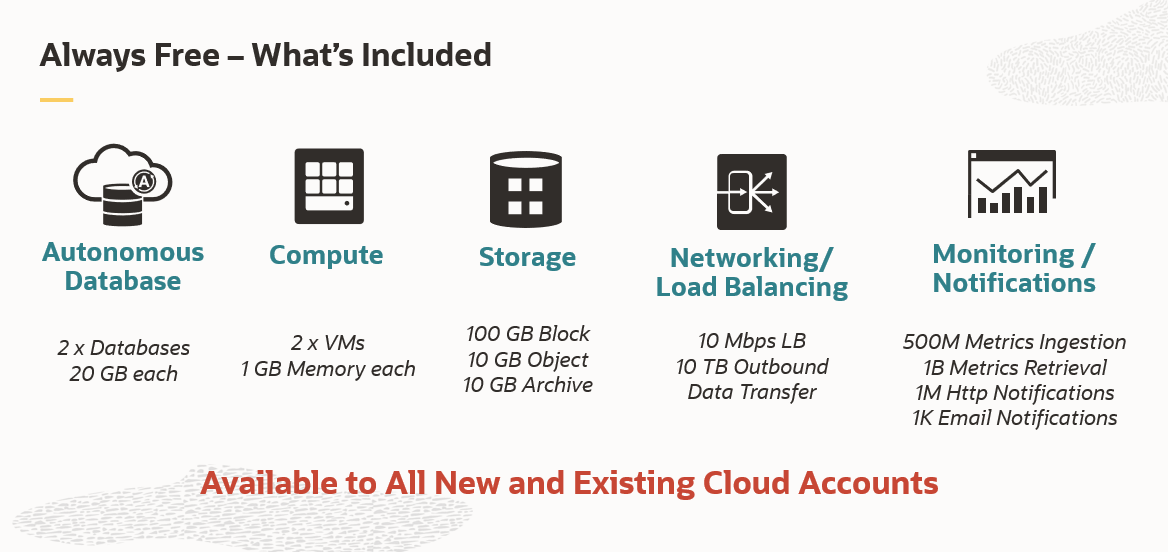
Oracle Cloud Infrastructure has a generous free tier, moreso than other hyperscalers, with an always-free tier that guarantees certain products are always free
Oracle Cloud Infrastructure allows you to size VMs with differing combinations of CPU and RAM, which is contrary to other hyperscalers that have specific pre-defined combinations only
Alert windows cause lag in notifications (e.g. if the alert window is X errors in 1 hour, we won't get alerted until the end of the 1 hour range)
I would appreciate more supportive examples for how to filter and view metrics in the explorer
I would like a more clear interface for metrics that are missing in a time frame, rather than only showing tags/etc. for metrics that were collected within the currently viewed time frame
Dynatrace does not monitor easily on a C-based application.
The way DPGR is addressed by Dynatrace is not very complete, and not clear. One thing is to mask the IP and request attributes but is not enough, the replay session feature is great but raises serious questions about user tracking.
Navigating the UI takes lots of getting used to. It reminds me of older GCP (just to get used to where everything is).
Permission for different things always seemed to be more difficult than it really needed to be. Once you got them set up you were good but updating anything or creating new permissions for just about anything took longer than I thought it should.
Based on how the buttons were laid out, it was pretty easy to delete all of your DNS records, and backing them up was not as intuitive as I'd like with the UI, but it was easy to do using a script.
We have already renewed our purchase with the company. They make it easy for us to get a temporary license for our contingency site that is only used for testing twice a year. We are expanding our license with for this tool. We find it very useful and will renew it again.
Reliability: Very dependable and stable OCI services have been for the business operations.Performance: The speed and efficiency of OCI in meeting their computing and storage needs.Scalability: The ease and effectiveness of scaling resources up or down to accommodate changing demands.Security: The robustness and effectiveness of OCI's security features in protecting their data and applications.
There are so many features that it can be hard to figure out where you need to go for your own use case. For example, RUM monitoring us buried in a "Digital Experience" sidebar setting when this is one of our key use cases that I sometimes struggle to find in the application. It appears that ECS + Fargate monitoring was recently released which is great because we had to build a lambda reporting solution for ephemeral task monitoring. But this new feature was never on my radar until I starting clicking around the application.
Dynatrace is great to use once you understand how to use it correctly and get used to the layout of it. While I do not actively use it every day, whenever I do use it, I do have to get refamiliarized with it. However, once you have your dashboards setup correctly with the data that you want to see when you first login to Dynatrace, it's amazing.
The services & products in Oracle Cloud Infrastructure needs more improvement to beat other Cloud service providers. The price is good & Security processes are good. We are requiring to put more effort in supporting this Oracle Cloud Infrastructure than other Cloud service providers. Probably better ways are there but is not super easy to find or not super available
Yeah sometimes we had to face unplanned outages due to underlying infrastructure issues, so not every time,e but once in a while we face issues with availability. But the good thing is we have redundancy with DR setup and multi region so we can manage.
From the start, I was surprised by response times and image quality accessing windows VMs with RDP. GCP, Azure and -many offerings in AWS- don't perform this speed. Also, that's evident in the quality of Infrastructure Management Team, because I just received one warning regarding a region failure, what confirms that's a mature platform.
The support team usually gets it right. We did have a rather complicate issue setting up monitoring on a domain controller. However, they are usually responsive and helpful over chat. The downside would be I don’t think they have any phone support. If that is important to you this might not be a good fit.
Given that Dynatrace has become an informal industry standard, the plethora of information available on forums is massive. Most problems or roadblocks you come across are most likely (almost certainly, in fact) already solved and solutions available on these forums. The tech support at Dynatrace is also quite good, with prompt and knowledgeable people at their end.
Overall it is amazing, there is always room for improvement. We have weekly updates that tend to slow the program used more and more. We had to change some reports within Oracle because the others wouldn’t load. This is tied to our payroll and the delays are causing many time constraint issues and panic. We have to create a new report when one breaks. Otherwise awesome!
Our logs are very important, and Datadog manages them exceptionally well. We frequently use Datadog services for our investigations. Use case: Monitor your apps, infrastructure, APIs, and user experience.
Key features:
Logs, metrics, and APM (Application Performance Monitoring)
Real-time alerting and dashboards
Supports Kubernetes, AWS, GCP, and other integrations
RUM (Real User Monitoring) and Synthetics
✅ Best for backend, server, and distributed systems monitoring.
Synthetic Monitoring automatically does what other products do only through the use of other tools or through the development of user applications that still have a high cost of maintenance. The other products are not immediately usable and require many customizations. Through the use of configuration automatisms, you can be immediately operational and, in our case, we detected several imperfections in the applications.
We used Microsoft Azure and Docker earlier and faced some difficulties like Microsoft Azure and Docker. Occasionally, the generation of large images can delay deployment. It is also necessary for me to admit that Microsoft Azure and Docker have a somewhat steep learning curve. Proper paperwork needs to be there. Docker has issues with performance on a number of platforms. On the other hand, OCI is easy to deploy and easy to understand.
was not part of initial purchase team. Anyways, i think unit pricing and billing frequency is good compared to other Cloud service providers, when it comes to Cloud Capital expenditure & Operational expenditure. Would be more interested in exploring more options where customers can get more cost relaxations on trying out new cloud services in Oracle Cloud Infrastructure for example a new App or a feature
We have hosted around 500 + customers on this cloud so till day not faced any major issues, so we can use it for any kind of products and it can hold the load and easily scale based on need.
Services & Infra wise is ok to use & host applications & services. Security wise also good for a Cloud service provider. It is a interesting area to explore & using it for day to day needs can be further improvised in future probably. Modern day Services like AI and Machine learning could be improved