The ibi™ WebFOCUS® product is an enterprise business intelligence and analytics solution equipped with data management, visual discovery, predictive analytics, and visualizations. Combining these capabilities and data science in one unified containerized platform, the WebFOCUS® solution can be used to make data-driven decisions across the enterprise and provide reports, dashboards, and customer-facing applications at scale.
N/A
OpenText Magellan
Score 9.0 out of 10
N/A
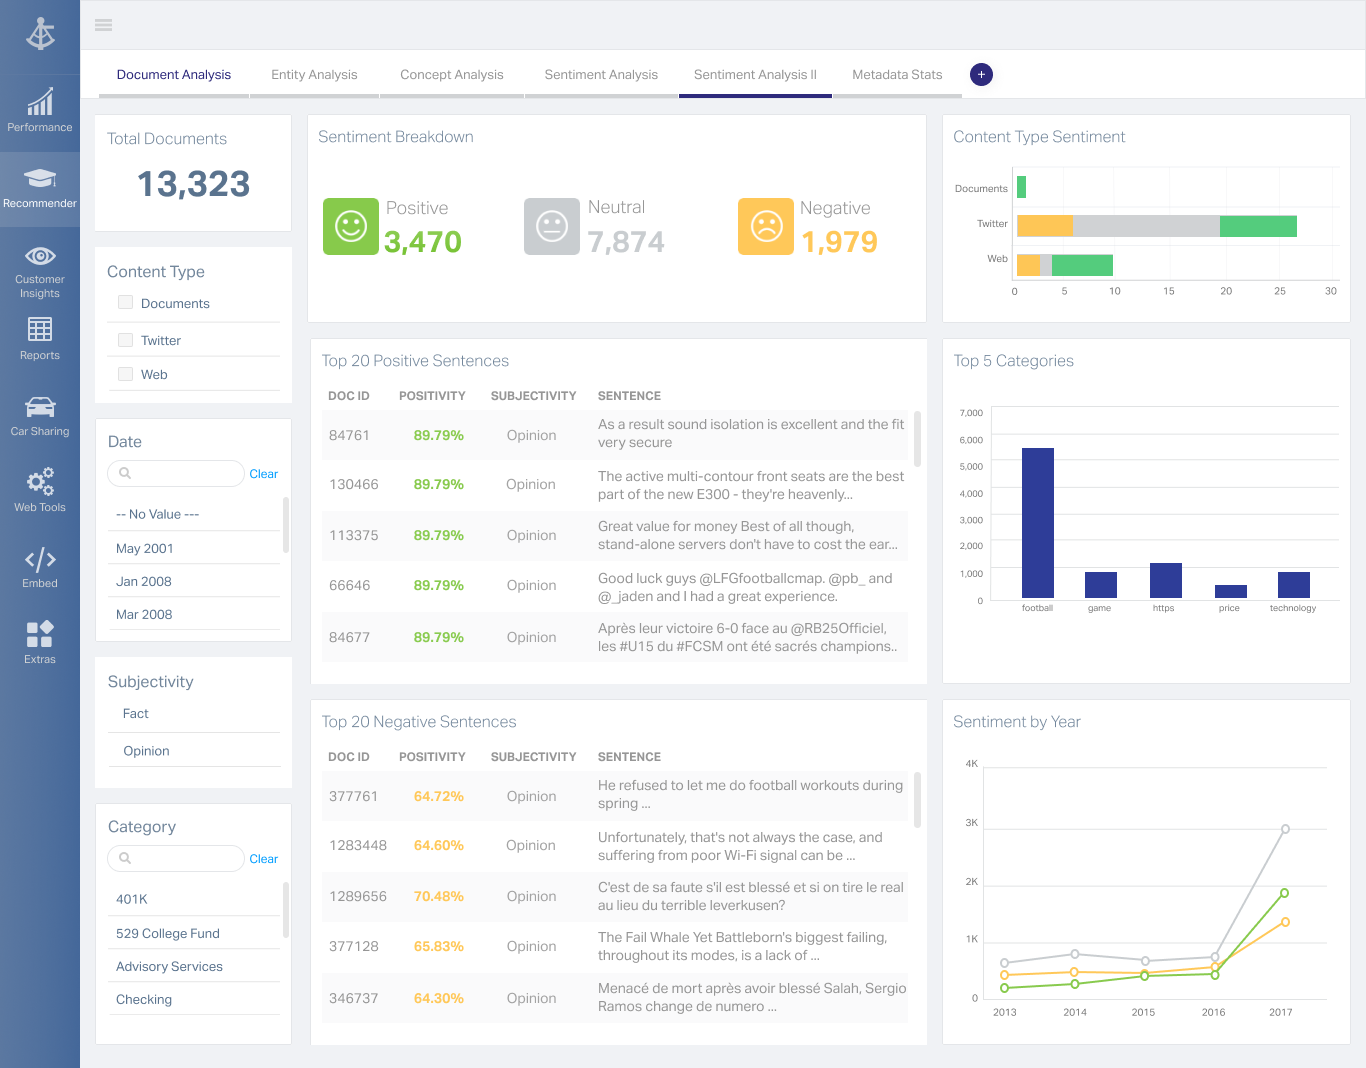
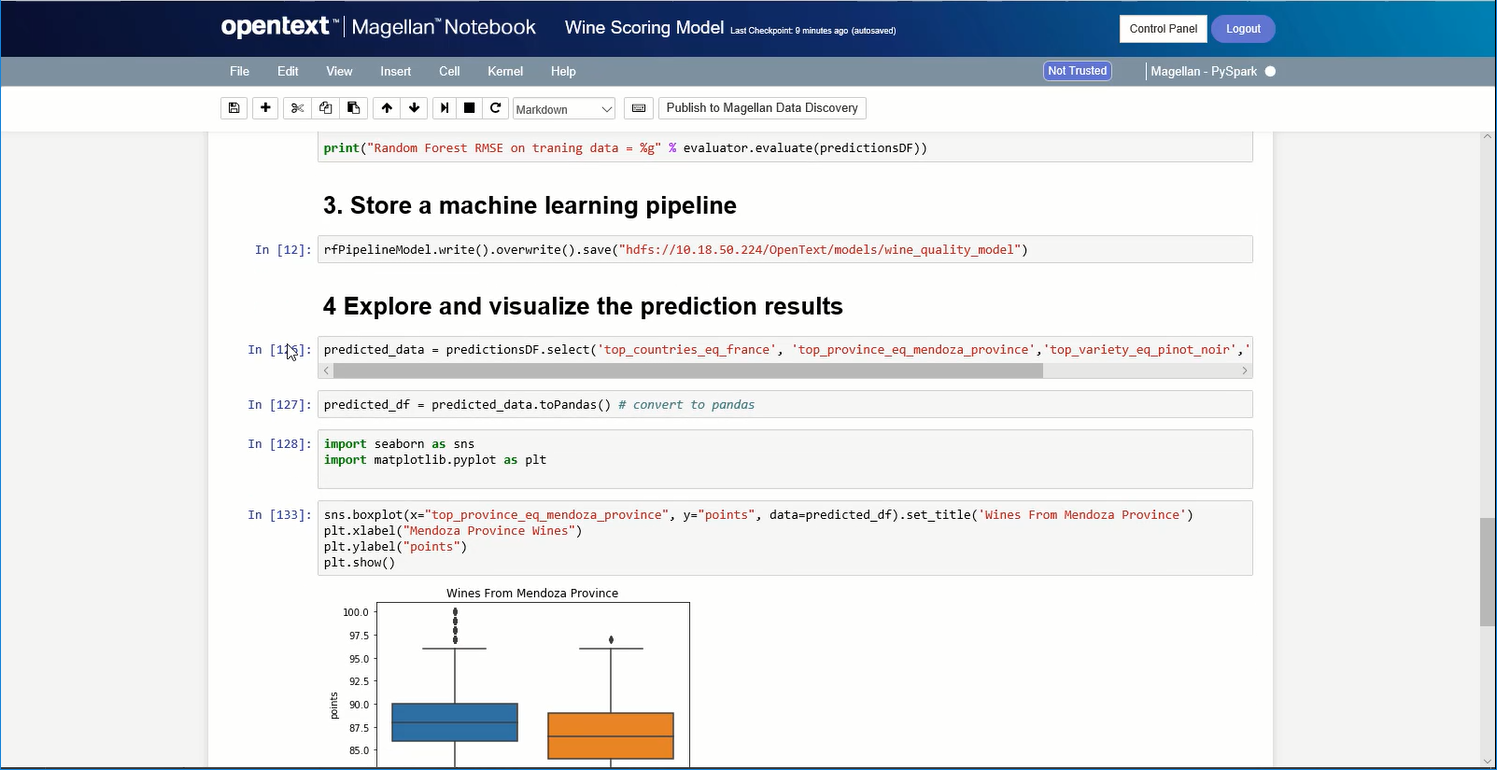
OpenText Magellan Analytics Suite leverages a comprehensive set of data analytics software to identify patterns, relationships and trends through data visualizations and interactive dashboards.
N/A
Sisense
Score 7.2 out of 10
N/A
Sisense is a BI software and analytics platform. With what the vendor calls their In-Chip™ and Single Stack™ technologies, users have access to a comprehensive tool to analyze and visualize large, disparate data sets without IT resources.
N/A
Pricing
ibi WebFOCUS
OpenText Magellan
Sisense
Editions & Modules
No answers on this topic
No answers on this topic
No answers on this topic
Offerings
Pricing Offerings
ibi WebFOCUS
OpenText Magellan
Sisense
Free Trial
No
No
Yes
Free/Freemium Version
No
No
No
Premium Consulting/Integration Services
No
No
No
Entry-level Setup Fee
No setup fee
No setup fee
No setup fee
Additional Details
—
—
Must contact sales team for pricing.
More Pricing Information
Community Pulse
ibi WebFOCUS
OpenText Magellan
Sisense
Considered Multiple Products
ibi WebFOCUS
Verified User
Anonymous
Chose ibi WebFOCUS
Above average. Feature wise [Information Builders WebFOCUS] stands out. User friendliness is OK. It can handle the most complex tasks and its extensions with for example R make it extremely versatile. Support is lagging in western Europe, although i am more than happy with …
We've looked at Tableau as an alternative and the visuals are good in Tableau. One way that WebFOCUS beats Tableau is it doesn't have any issues with a set number of columns in a report. When you need to have an Excel output, which happens, WebFOCUS is far superior. The …
Webfocus handles the side of our business that is involved with our catalogs. Our catalogs is a huge revenue driver for us and this tool has been extremely useful with planning feature catalogs. Tableau is used more for marketing and merchandising purchases since we can filter …
Application Development Analyst and Software Engineer
Chose ibi WebFOCUS
No comparison. Both have their strengths, but WebFocus comes out on top as the clear winner because it is so easy to use and understand for power users. Crystal Reports, like most BI tools, requires more extensive training and is not as easy or user friendly. It is more …
WebFOCUS has a mature and tested product that speaks well to internal personnel who rely on legacy data systems for day-to-day operations and business processes. It is apparent some newer products provide flexibility in user access with limited previous knowledge or experience …
I've used a few other development frameworks, but the desition of the company to use WF was not mine. I came and WF is the tool that the company uses. I think that WF is a very important framework to achieve the goals of the company and I would like this technology to become the …
WebFOCUS is more visual and easier to build for a non-programming user, where with little knowledge on data management and dedication to learn it, you can easily start creating very well presented reporting that is automated. With the Report Caster system it allows you to fully …
Years ago I developed in Business Objects and when it came down to a decision to go with WebFOCUS it was a pretty easy choice. There is really nothing you can't do with the platform given all of the available options to develop the solutions with - HTML pages, parameterized …
I like the ease of development best on webfocus. As compared to Qlikview, it is better at handling large amounts of data and the data access process is much easier in WebFOCUS ( very manual in Qlik). Qlik is better for ad hoc drill through and it is nice how a selector easily …
Business Objects -WebFOCUS is more centered towards the user accessing data without an administrator setting up reporting objects or setting rules on data access. Access is more free form and allows the user more freedom (for better or worse) to design and create the report …
I found WebFOCUS a great tool for reporting purposes as I have used it for a long time. They should compare themselves with new reporting tools like Tableau and Splunk. Tableau's interface is mind blowing. IBI should learn from Tableau and how they have penetrated the big data …
The reason we chose WebFOCUS is because it seemed the easiest to use to create great reporting products. Also, we really liked that the code is transparent and readily available. We were confident in Information Builder's longevity and believed that ultimately, our staff would …
WebFOCUS was selected because of the rich data interface/adapter
OpenText Magellan
Verified User
Anonymous
Chose OpenText Magellan
There is multiple software available in the market to do the reporting and text analytics. Generally, analysts prefer using Python or R. Or we try to use any API available. This software can fulfill almost 80% of those needs without writing the codes. It has the integration …
OpenText Magellan can produce reports that are much more elaborate than PowerBI, which is ideal for users that just need to see a report. On the other hand, PowerBI seems to be better at allowing users to interact with data.
It is vastly superior to these in many ways, for complex reporting it is a much more sophisticated solution. Visualizations are very good. Javascript extensibility is very powerful, others don't support this or as well. Pentaho and MS are both OLAP oriented. Pentaho is moving …
Actuate has been in the industry a while and the open source community make going with Actuate's BIRT a stable decision. Changing report engines can be expensive, so going with a company with a good reputation helps long-term.
Actuate has a HUGE number of features that can tie nicely into almost any ERP but it takes some time to learn and the development community was relatively small compared to the Crystal Reports alternative. Crystal was far easier to learn and had a massive support base. Probably …
Each tool has strengths, but Sisense stands out for its ease of use, scalability, and robust data integration. We chose Sisense for its balance of robust functionality and ease of use. We are happy that it can handle complex data integrations that aligned perfectly with our …
As someone coming from more of an enterprise tool level Sisense seemed like a step down at first. Compared to other tools in the market or tools that it replaced (Looker), it provides far better data integrations and the ability to build their data cubes meant less reliance on …
Sisense was chosen as our BI platform for a few key reasons. Excellent customer support is a key reason why. Additionally, continuing innovation in new product features and the ability to embed reports and do quite a bit in terms of customization.
Sisense truly stacks up against Power BI, Domo or Tableau as one of the most accurate data analysis applications that offers an intuitive approach to data exploration. You can use its web-based interface to tap the expertise of your data analytics team. They can build and share …
Sisense worked out of the box, there was a lot of setup with the other 3. Out of the 3 others Board's was the only one that connected to Salesforce without a problem like Sisense. Sisense pricing destroyed the other 3 as well.
We chose Sisense due to pricing structures as well as its speed and ability to connect to more robust data sources. Ultimately, the differences were minimal in regards to abilities and functionality; we just felt that Sisense provided the most reliable and consistent results …
Sisense does very well against most of the tools in the market. We chose this tool because of its great visualizations and easy to deploy procedures. The reports are very easy to generate and distribute them across departments and organization. It provides a great interface to …
I've used a few different analytical engines over the last few years and none have the efficient ability as both a data manager and a dashboarding tool - usually, other platforms excel in one area or another. To expand further, tools that succeed in data management and …
Sisense can't compare to any tool for the ease of user, intuitive interface and "time to data". I gave been working with both large enterprise and small SMB's using Sisense, and it is amazing to see how small companies quickly learn how to use it and how practical and efficient …
Before purchasing Sisense and began recommending it as a solution to our clients, we tested four other BI visualization tools. All four of these ranked high on the Gartner Magic Quadrant. We researched Domo, Looker, MS Power BI and Tableau. Looker could be a better solution if …
Sisense's greatest advantage is its ability to import the data into sisense, perform in-server data modelling, and then create dashboard reports from the modelled data. This takes load off of your production database servers, and leverages sisense's technology for handling huge …
Sisense can crunch loads more data and has consistently better performance than other modern BI tools; It successfully retains the best of the Cube world and also provides the power of modern in-chip visualization engine.
Senior Manager Business Intelligence Data Architect
Chose Sisense
Sisense allows you to export individual widgets as iframes. It provides cube and row level security and can manage lots of data without interfering with the data sources. Tableau data sources were harder to manage and version. The customer support team with Sisense was head and …
WebFOCUS is a good comprehensive tool for BI for companies. I feel that scenarios where you want the user to interact and be able to ingest data in different formats would be a good use of the tool. Performing data discovery is easier with InfoAssist, especially the most recent versions, and allows users to customize their views and provide comments.
It depends on extensibility, set-up, access & style. Actuate performs fairly well, but has performance issues because it sits on top of eclipse, which sits on top of Java. Extensibility usually comes at that price. Set-up is fairly straightforward and it can be secured.
I believe Sisense is perfectly suited for any organization of any size that have access to the proper resources, as the tool is very expensive. The data connectors come in all shapes and sizes out of the box, which allows a great deal of data control within the ElastiCubes. Additionally, while the platform only runs on Windows platforms, the web application can be accessed on any client: mobile, Apple, Windows, etc. This allows a much more flexible user experience, resulting in data and dashboards reaching further than any other tool.
Webfocus reports all have the option to export to Excel. The excel spreadsheet is always very organized and clean, and the information is very easy to read.
Webfocus is able to maintain data from years prior. We can look up what we featured in catalogs and all the sales history attached with it.
Webfocus is able to provide support to a variety of departments. For example, our buying team uses it for planning in advance and our marketing team uses the tool to see how categories and products as the selling
The biggest pro I found with Sisense is that you do not need a DBA in order to manage the system. This makes the learning curve really easy, which helps lots when thinking of implementation across a whole organization. This reflects well for the tool, since it is powerful, but easy to use.
ALL-IN-ONE! Sisense answered all of my customers and our company's requirements, to include data modelling and complex calculations.
Sisense is as accurate as your data, and best of all, it is real time. After using other visualization tools, I learned that when using multiple sources, errors occur. Sisense prevents this risk by allowing all of the resources to be managed at their engine, maintains connections, and as a developer, the EliastiCube allows you to source large volumes of data with an easy click.
Some functionality is missing as built-in functionality, and can only be added by using Javascript, which requires technical knowledge of JS from the dashboard designer to implement. So although almost anything is possible to implement, some things which should be basic require high-level skills.
Viewers of dashboards have very limited customization options, almost any customization requires the dashboards designer to implement.
Particularly, viewers are unable to select conditional formatting, rename fields, change the order of items, etc.
This software is deeply engrained with my organization and has become a tool that would not easily be replaced without spending more money and resources to get the same results. License cost is comparable to other report writing tools and the capabilities are greater than the competition without having to buy multiple apps to do the same thing.
I am no longer working for the company that was using Actuate but I believe they would continue to use it because the stitching costs would be to high. It would require a complete rewrite of the reports and the never version of Actuate (BIRT) even required an almost complete report rewrite
I think the business and myself as a user has come to rely on SiSense as a dashboarding and quick ad-hoc reporting tool. I am hoping to integrate SiSense dashboards into more parts of the business in the future. We have reduced our report turn-around time for the most part from hours/days to minutes and in some cases almost the speed of thought. Reports are also easier on the eye and more easily distributed. I would also like to say that the support and professionalism from the SiSense team has been excellent.
Best BI tool/product I have used. The others don't compare overall. Some can look fancier, but when you actually use them with large data and data from numerous systems/sources that is where most of the competition falls away. I also don't like downtime. I have basically none for a large user base with WebFocus. Even SAP Crystal Reports went down for 4 days once - 4 days because the admin password got locked out due to a glitch and we had zero reports for 4 days. WebFocus has never had more than a few minutes of downtime. It's like a tank that just keeps rolling. There is no other choice for reliable BI.
It is quite intuitive to use. It is fit specifically for doing sentiment, emotion, and intention analysis as well as text classification and text summarization. I would have given 10 if it is fit for the purpose of doing image processing and analysis as well. There is a huge market to analyze video and image data.
There is no doubt it is easy to use solution. It always equips me with authentic reporting, I can have the detailed analysis of the operations. This tool has helped me to collect every bit of the data and it would be just to say that it has influenced my lead generation and helped to build strong customer relations.
There are very few situations when there is unexpected downtime. Mostly during development, new dashboard implementation and during upgrades. other then that there were very few crashes.
SiSense is usually performing better then other solutions even if going for complex reports/dashboards(of course within reasonable frames). I haven't noticed any bad influence on other systems, usually if something happens it stays within SiSense.
They have extremely knowledgeable techs that I have worked with over the years. Some have actually become really good friends of mine. I see them often at local user groups and when we show them how we are using their tools to save millions of dollars throughout the company
SiSense's support ninjas are very knowledgeable and are exceptionally responsive. So far, all of the issues we ran into were resolved within minimum time. My sense of dealing with the support staff at SiSense is that they are very focused on not just answering your immediate question, but also to delve into the cause of the matter.
Easy and free training that allowed us quickly understand basics in SiSense and start using them. More advanced features requires some browsing through SiSense forums, but there is always support to help, and SiSense support is one of the best whith which I worked so far.
Many examples, videos and scenarios which you try on your own right away. This combined with in-person training gives you enough to utilize most of SiSense's power.
Plan ahead on what data will be accessible and the type of security required on the database and if you will want to use security that is built into the software. It is worth consulting with the vendor on what your plan is and how they recommend you proceed in order to get results you are happy with.
Above average. Feature wise [Information Builders WebFOCUS] stands out. User friendliness is OK. It can handle the most complex tasks and its extensions with for example R make it extremely versatile. Support is lagging in western Europe, although i am more than happy with current level. With takeover by tipco it remains to be seen how European strategy will evolve
It is vastly superior to these in many ways, for complex reporting it is a much more sophisticated solution. Visualizations are very good. Javascript extensibility is very powerful, others don't support this or as well. Pentaho and MS are both OLAP oriented. Pentaho is moving more toward big data, which was not our primary focus. Others are stuck in the Crystal Reports Band metaphor.
Sisense was chosen as our BI platform for a few key reasons. Excellent customer support is a key reason why. Additionally, continuing innovation in new product features and the ability to embed reports and do quite a bit in terms of customization.
We are not yet a success story. Though we've been implementing WebFOCUS for over a year, we have very few products in our Production portal. Of course, this is not all the responsibility of Information Builders, but we were ill-advised by our 'training coordinator' in our training of staff and coming up to speed with the tools has been very slow.
Once skilled analysts and professional IT staff achieve a grasp of the products, they are able to very quickly create polished and well-received products.
The DW/BI project has helped us to establish standards and protocols of communication that will allow us to more quickly meet knowledge transfer requirements
Actuate can handle 50 to 60 sub reports inside a report very well.
Dynamically creating the datasource, chart, graph, reports are the main advantages. We can do any level of drilling, and can create a performance matrix dashboard efficiently.