People.ai is a revenue intelligence platform for go-to-market teams. The platform promises to help sales, marketing and customer success teams uncover every revenue opportunity from every customer. Customers include: Lyft, Gainsight, Tanium and Palo Alto Networks. People.ai helps them capture contacts, activity and engagement and drive actionable insights across all their revenue generation. Founded in 2016, People.ai is based in San Francisco and is backed by Y Combinator and…
N/A
Tableau Cloud
Score 7.9 out of 10
N/A
Tableau Cloud (formerly Tableau Online) is a self-service analytics platform that is fully hosted in the cloud. Tableau Cloud enables users to publish dashboards and invite colleagues to explore hidden opportunities with interactive visualizations and accurate data, from any browser or mobile device.
$15
per month per user
Tableau Server
Score 7.6 out of 10
N/A
Tableau Server allows Tableau Desktop users to publish dashboards to a central server to be shared across their organizations. The product is designed to facilitate collaboration across the organization. It can be deployed on a server in the data center, or it can be deployed on a public cloud.
Tableau Desktop is great because it has much more extensive capabilities. Tableau Prep is great for ETL. It makes it easy to aggregate multiple data sources, union, clean, etc. It is easy to QA within Prep, and takes a lot of the guesswork out of troubleshooting issues with …
Tableau Online is much better at presenting and visualizing and manipulating your data. While Host Analytics is second to none in data consolidation, Tableau has much greater flexibility in exploring that data.
Both Tableau Online and BI solutions provide visualizations. In Power BI we choose the visualization first, then drag the data into it. In Tableau, we select the data and switch between visualizations on the fly. It’s easier to jump between visualizations in Tableau. Power BI …
Verified User
Analyst
Chose Tableau Cloud
From an analyst point of view, Tableau is the most intuitive tool and it's really easy to use. It's simply the most convenient product and gives the biggest possibilities. Of course, it's more expensive and not all features are necessary for some users. I have chosen Tableau …
The choice to use Tableau Server is really made for you if you already have adopted Tableau Desktop. If you're focused on an on-premise solution, Tableau is probably the way that you'll have to go. Looker and Mode are cloud-based (so is Tableau Online) and offer a true …
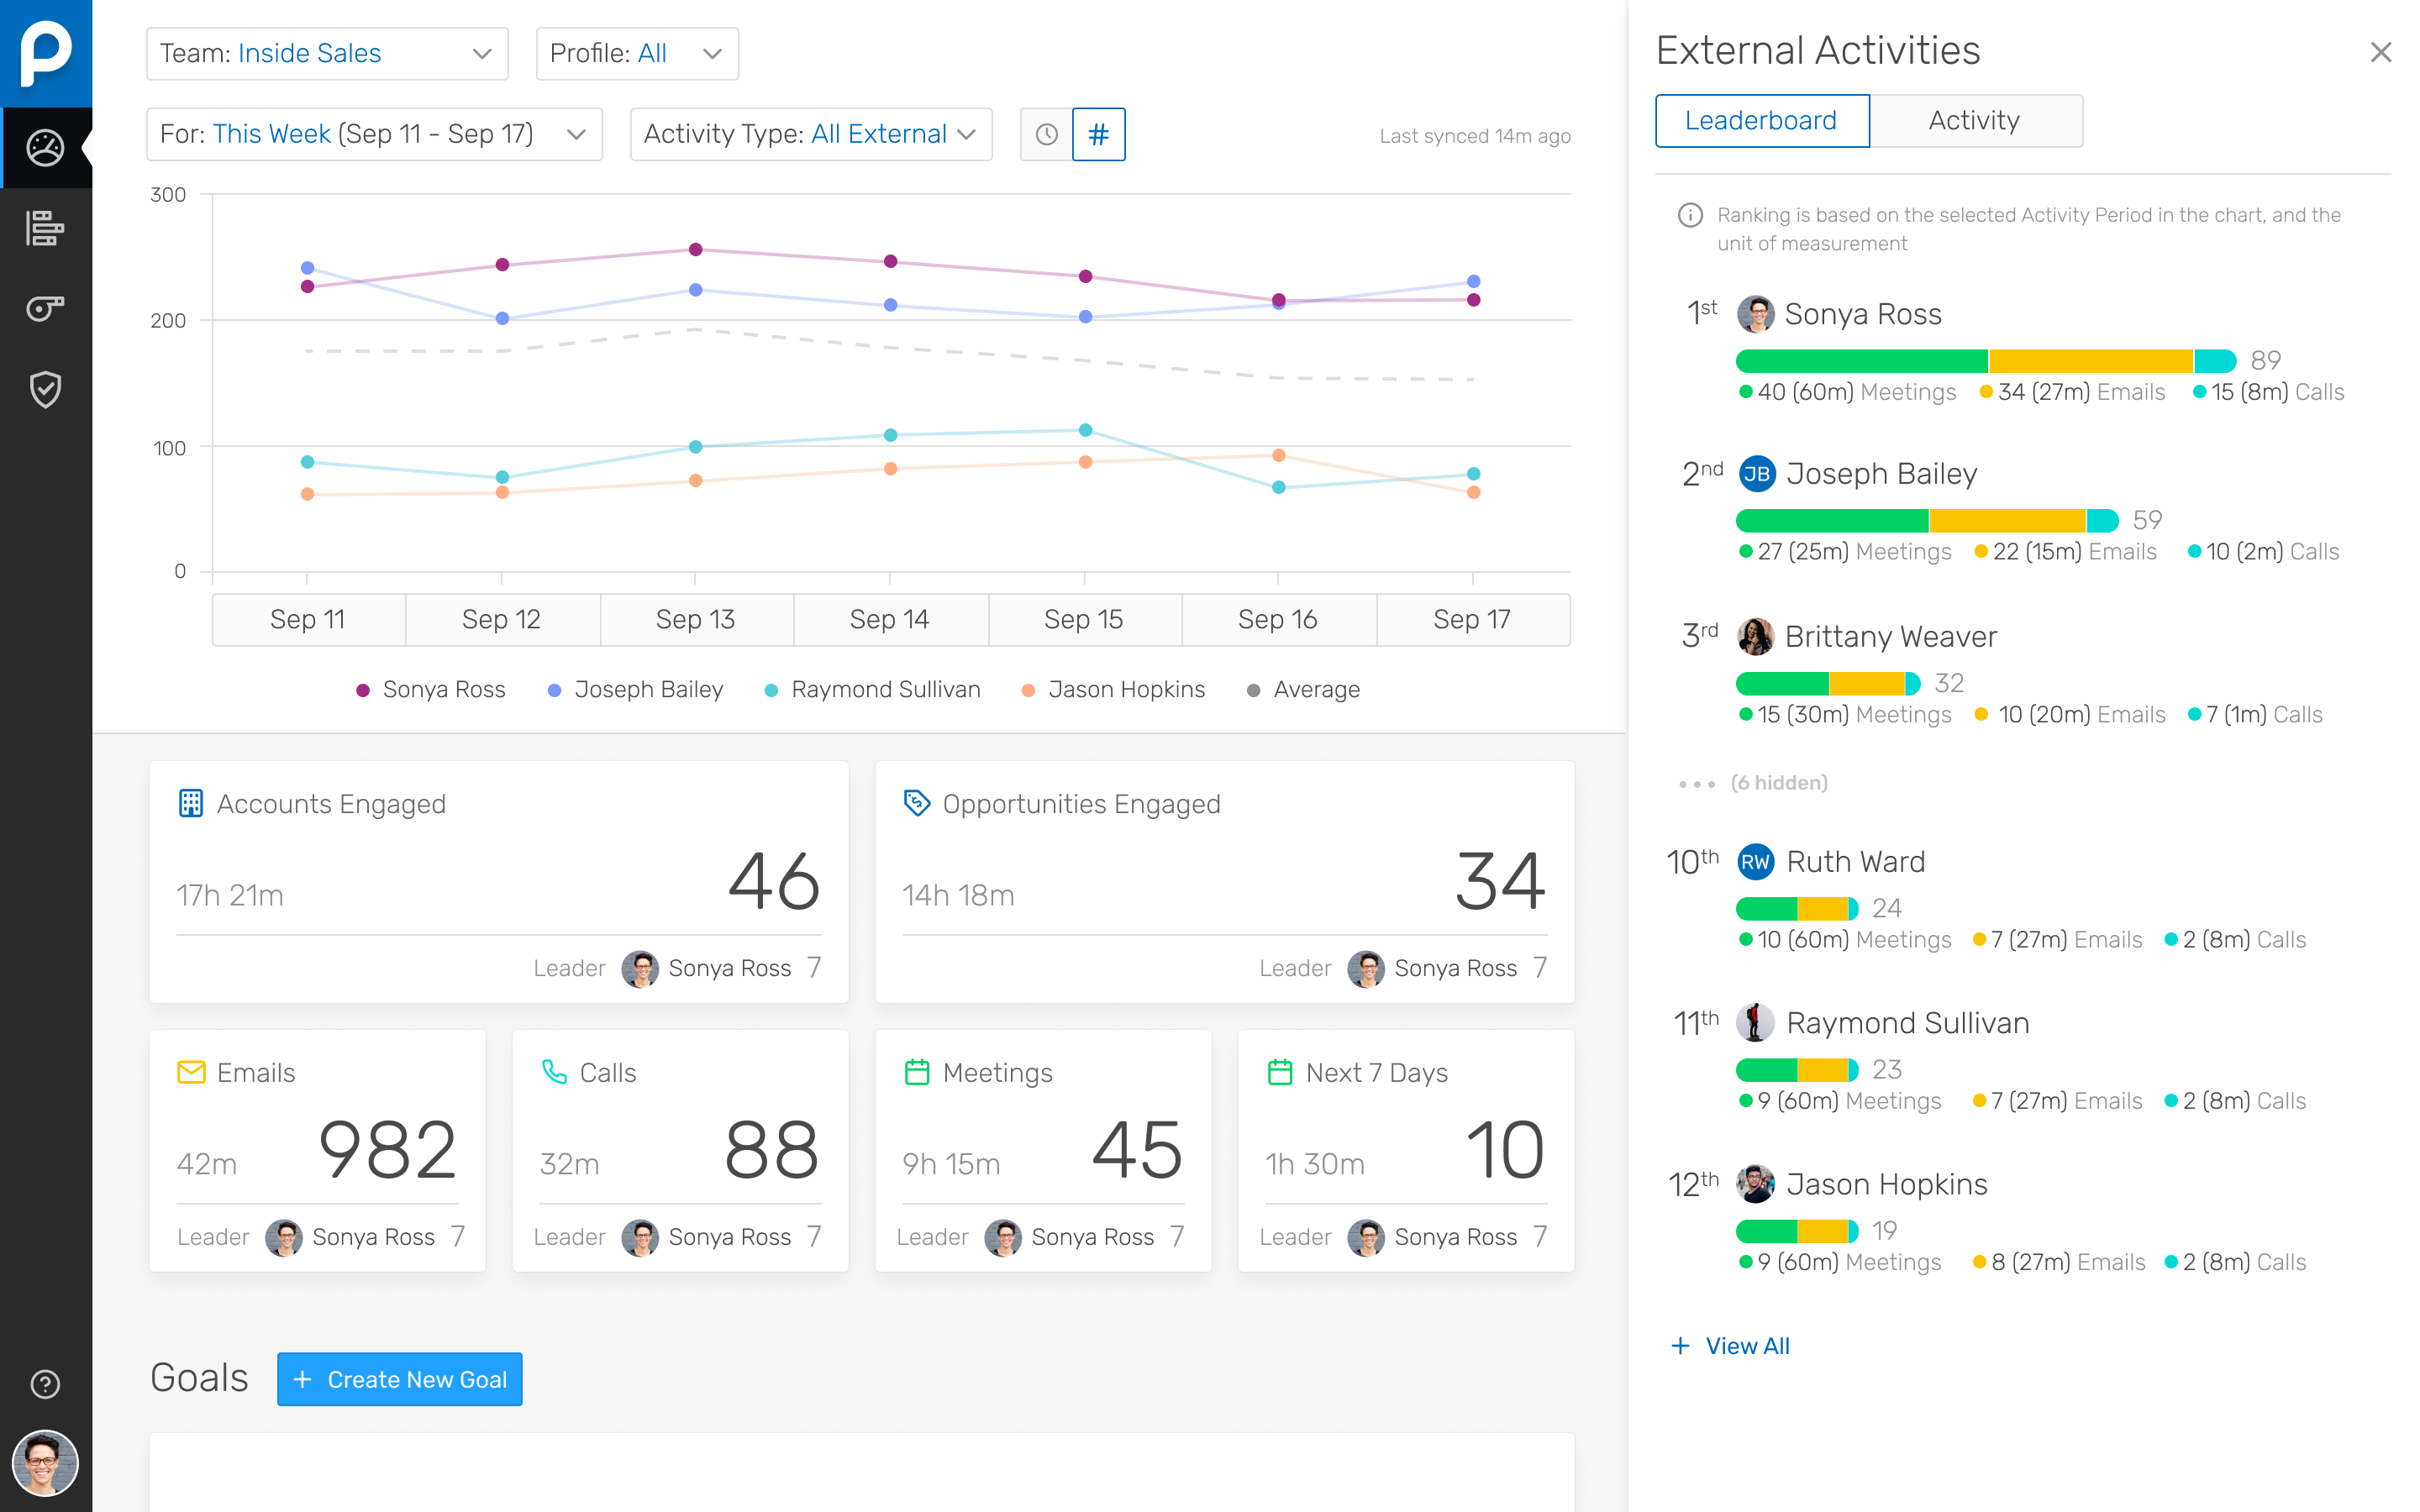
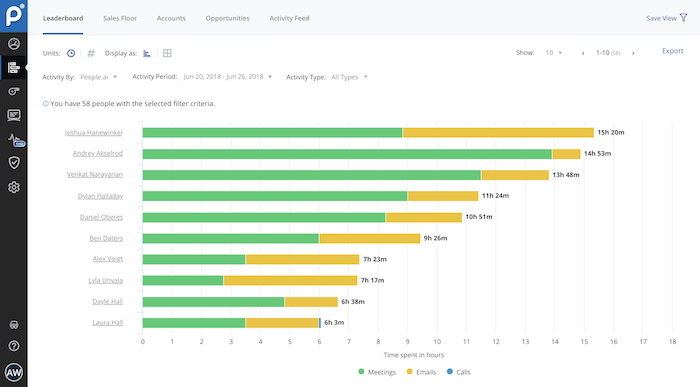
I've been using People.ai for a bit now, and I've been consistently impressed. I use it to track how my team is doing, how my clients are doing, and how I'm doing. I can create custom dashboards with any metric I want to see. I can set goals, and they'll track my progress towards those goals. I can set up competitions between my team, and they'll tell me who's winning and who's losing. You can share these dashboards with your team, which means that everyone can see how everyone else is doing.
If you're using Tableau as the primary BI tool, then Tableau Cloud is well suited to publish and share the results with a wide(r) audience. It is well suited for various degrees of self-service proficiency, from pure consumers of analytical work to more advanced users who can use web editing for smaller or larger adjustments, and even for desktop power users who will publish their work to Tableau Cloud. It has many good ways to organize the content and make it easily accessible via search, favorites, folders, collections ("playlists for your data"), or history ("recents"). It might not be ideally suited if there are many on-prem sources to be used (even though there are options to connect them) or if you have very special requirements regarding custom server setup, which is limited in a shared cloud environment like Tableau Cloud.
Whole funnel and specific channel performance from upper to lower funnel metrics. The ability to view full channel performance for some time, such as weekly, monthly, or quarterly, has truly been monumental in how my team optimizes specific channels and campaigns. Daily performance tracking is a bit overwhelming, with load times and having to refresh specific live views over time. It can be challenging to do so at times, as extensive dashboards take much longer to load.
Their Deal Room presents times when you are multi-threaded, engaged with executives, and have an upcoming meeting scheduled rather than stalking your reps calendar and salesforce activities.
They allow you to create areas performance dashboard with custom KPIs you want to measure
Tableau Online is completely cloud based and that's why the reports and dashboards are accessible even on the go. One doesn't always need to access the office laptop to access the reports.
The visualizations are interactive and one can quickly change the level at which they want to view the information. For example, one person might be more interested in looking at the country level performances rather than client level. This is intuitive and one doesn't need to create multiple reports for the same.
The feature to ask questions in plain vanilla English language is great and helpful. For quick adhoc fact checks one can simply type what they are looking for and the Natural Language Programming algorithms under the hood parse the query, interpret it and then fetch the results accordingly in a visual form.
It's good at doing what it is designed for: accessing visualizations without having to download and open a workbook in Tableau Desktop. The latter would be a very inefficient method for sharing our metrics, so I am glad that we have Tableau Server to serve this function.
Publishing to Tableau Server is quick and easy. Just a few clicks from Tableau Desktop and a few seconds of publishing through an average speed network, and the new visualizations are live!
Seeing details on who has viewed the visualization and when. This is something particularly useful to me for trying to drive adoption of some new pages, so I really appreciate the granularity provided in Tableau Server
People.ai has a robust platform, however, this requires sales reps to log into one more platform and the People.ai platform is not customizable for selecting what can be viewed by users. If People.ai were to make the features in their platform available in Salesforce it would be a huge win for leveraging the data they aggregate. Hoping an API will soon be on the Roadmap
Time Spent. People.ai uses some logic to attribute values on the "time spent" on the activities being captured. They did improve their meeting aggregations so that they were not "double counting" time when multiple meetings were booked in the same time slot for a rep. Email time spent still seems to have some errors as the time spent on emails can show in excess of the weekly working hours of the reps.
Tableau Server has had some issue handling some of our larger data sets. Our extract refreshes fail intermittently with no obvious error that we can fix
Tableau Server has been hard to work with before they launched their new Rest API, which is also a little tricky to work with
It simply is used all the time by more and more people. Migrating to something else would involve lots of work and lots of training. The renewal fee being fair, it simply isn't worth migrating to a different tool for now.
Based on comments from our clients, I awarded it this grade. Non-technical customers frequently compliment us on the ease with which they can utilize Tableau Online. Usability is rarely a source of contention amongst our customers. Few complaints have come from me as a user of our internal products.
Tableau Server takes training and experience in order to unlock the application's full potential. This is best handled by a qualified data scientist or data analytics manager. Tableau user interface layout, nomenclature, and command structure take time and training to become proficient with. Integration and connectivity require proper IT developer support.
Our instance of Tableau Server was hosted on premises (I believe all instances are) so if there were any outages it was normally due to scheduled maintenance on our end. If the Tableau server ever went down, a quick restart solved most issues
While there are definitely cases where a user can do things that will make a particular worksheet or dashboard run slowly, overall the performance is extremely fast. The user experience of exploratory analysis particularly shines, there's nothing out there with the polish of Tableau.
I have not had any issues that require customer support from Tableau at this time, which speaks well to Tableau. I have taken an online course with Tableau and it was very professional and well done, so based on that I would assume a similar level of quality for their customer service.
We have consistently had highly satisfactory results every time we've reached out for help. Our contractor, used for Tableau server maintenance and dashboard development is very technically skilled. When he hits a roadblock on how to do something with Tableau, the support staff have provided timely and useful guidance. He frequently compares it to Cognos and says that while Cognos has capabilities Tableau doesn't, the bottom line value for us is a no-brainer
In our case, they hired a private third party consultant to train our dept. It was extremely boring and felt like it dragged on. Everything I learned was self taught so I was not really paying attention. But I do think that you can easily spend a week on the tool and go over every nook and cranny. We only had the consultant in for a day or two.
The Tableau website is full of videos that you can follow at your own pace. As a very small company with a Tableau install, access to these free resources was incredibly useful to allowing me to implement Tableau to its potential in a reasonable and proportionate manner.
Implementation was over the phone with the vendor, and did not go particularly well. Again, think this was our fault as our integration and IT oversight was poor, and we made errors. Would they have happened had a vendor been onsite? Not sure, probably not, but we probably wouldn't have paid for that either
The easiest comparison would be to email automation vendors like a SalesLoft, Outreach, or Groove. But People.ai doesn't have a template email send like a sequence or cadence feature you would find with them. It is more of a compliment to the email automation vendors than a competitor in my opinion. We want our SDRs to have the ability run sizable outbound campaigns so they still use Outreach. However, we deactivated the Outreach activity sync and run activity syncing through People.ai. If someone gets added into the email CC, People.ai will grab that person and create them as a contact against the matching Salesforce account. For our Sales reps, we want them to have the ability to track opens, link clicks, and send templated emails so we have them use Groove. Again, we deactivated the Salesforce sync and use People.ai syncing. This is a great way to automate the pain away from creating Opportunity Contact Roles and create all relevant contacts in Salesforce from CC's on emails to people added last minute on a calendar invite. My favorite part is how it ingests data directly from Google and doesn't allow a Sales Rep to not to sync an activity to Salesforce, it happens automagically
In determining whether to go with Tableau Online versus Alteryx, two important factors stood out in determining our go-to solution. First, while Alteryx is an impressive tool for data cleansing, it did not stack up in terms of data visualization capabilities. Tableau, on the other hand, provided us everything we needed in terms of visualizing our data and analytics. The second factor is cost. Well neither solution would be considered cheap, Tableau was the more cost effective solution for our needs.
Today, if my shop is largely Microsoft-centric, I would be hard pressed to choose a product other than Power BI. Tableau was the visualization leader for years, but Microsoft has caught up with them in many areas, and surpassed them in some. Its ability to source, transform, and model data is superior to Tableau. Tableau still has the lead in some visualizations, but Power BI's rise is evidenced by its ever-increasing position in the leadership section of the Gartner Magic Quadrant.
Tableau does take dedicated FTE to create and analyze the data. It's too complex (and powerful) a product not to have someone dedicated to developing with it.
There are some significant setup for the server product.
Once sever setup is complete, it's largely "fire and forget" until an update is necessary. The server update process is cumbersome.