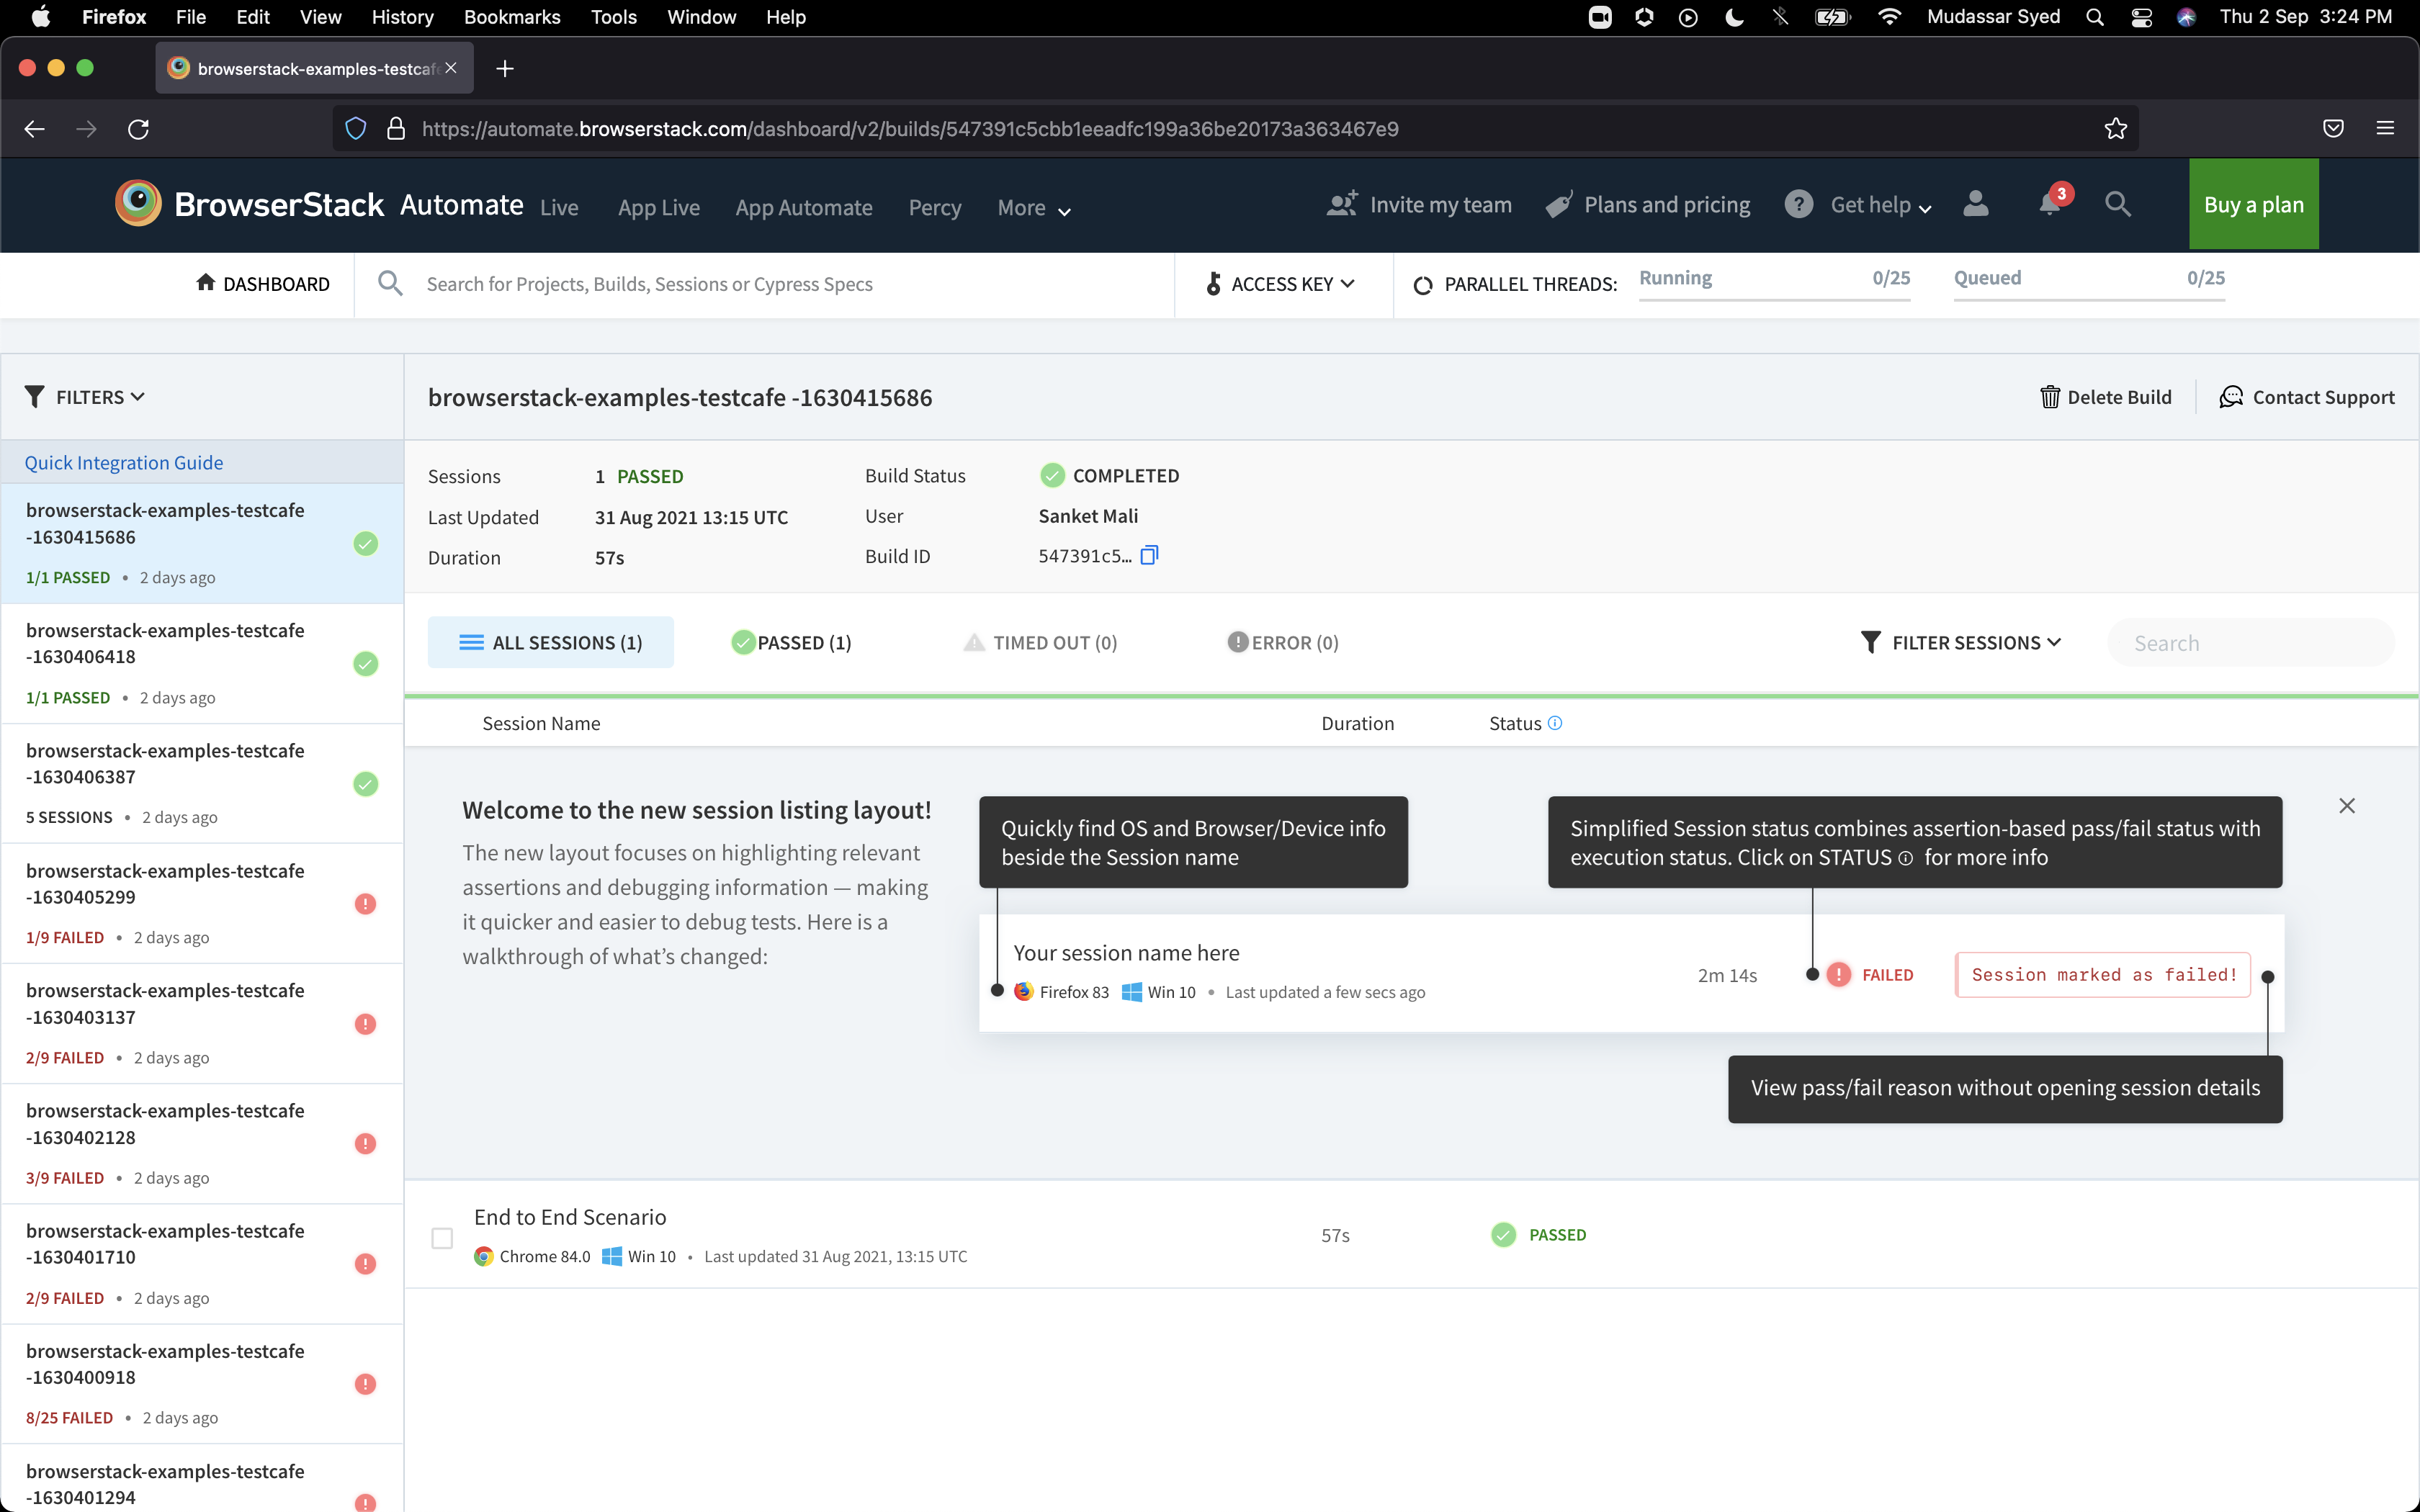
BrowserStack is a test platform built for developers and QAs to expand test coverage, scale and optimize testing with cross-browser, real device cloud, accessibility, visual testing, test management, and test observability. BrowserStack states it currently powers over a billion tests a year for customers who include Amazon, Paypal, Well Fargo Bank, Nvidia, MongoDB, Pfizer, GE, Discovery, React JS, Apache, JQuery and several others rely on BrowserStack to test their web and mobile apps.
$0
per month Unlimited users and 5000 free screenshots
Datadog
Score 8.6 out of 10
N/A
Datadog is a monitoring service for IT, Dev and Ops teams who write and run applications at scale, and want to turn the massive amounts of data produced by their apps, tools and services into actionable insight.
$18
per month per host
Zabbix
Score 8.5 out of 10
N/A
Zabbix is an open-source network performance monitoring software. It includes prebuilt official and community-developed templates for integrating with networks, applications, and endpoints, and can automate some monitoring processes.
N/A
Pricing
BrowserStack
Datadog
Zabbix
Editions & Modules
Percy - Free
$0
per month Unlimited users and 5000 free screenshots
App Percy - Free
$0
per month 5000 free screenshots and 100 minutes of infrastructure
Test Observability - Unlimited Free
$0
Accessibility Testing - Free
$0
Test Observability - Observability Pro
$0.01
per month per test execution
Percy - Desktop
$0.02
per month per screenshot
App Percy - Visual Core
$0.02
per month per screenshot
Percy - Desktop & Mobile
$0.02
per month per screenshot
App Percy - Visual Cloud
$0.03
per month per screenshot
Live - Desktop
$39
per month per user
Live - Desktop & Mobile
$49
per month per user
App Live - Individual
$49
per month per user
Automate - Desktop
$129
per month 1 parallel test
Live - Team
$175
per month 5 users
App Live - Team
$175
per month 5 users
Accessibility Testing - Team
$199
per month 5 users
Automate - Desktop & Mobile
$225
per month 1 parallel test
App Automate - Device Cloud
$249
per month 1 parallel test
App Live - Team Pro
$289
per month 5 users
App Automate - Device Cloud Pro
$299
per month 1 parallel test
Automate - Enterprise
Contact sales team
Percy - Enterprise
Contact Sales
App Automate - Enterprise
Contact Sales
App Live - Enterprise
Contact sales team
Live - Enterprise
Contact sales team
App Automate - Device Cloud Pro + Visual Cloud
Contact Sales
App Percy - Enterprise
Contact Sales
Test Observability - Enterprise
Contact Sales
Accessibility Testing - Enterprise
Contact Sales
Log Management
$1.27
per month (billed annually) per host
Infrastructure
$15.00
per month (billed annually) per host
Standard
$18
per month per host
Enterprise
$27
per month per host
DevSecOps Pro
$27
per month per host
APM
$31.00
per month (billed annually) per host
DevSecOps Enterprise
$41
per month per host
No answers on this topic
Offerings
Pricing Offerings
BrowserStack
Datadog
Zabbix
Free Trial
Yes
Yes
No
Free/Freemium Version
No
Yes
No
Premium Consulting/Integration Services
No
No
No
Entry-level Setup Fee
No setup fee
Optional
No setup fee
Additional Details
—
Discount available for annual pricing. Multi-Year/Volume discounts available (500+ hosts/mo).
Percy by BrowserStack was a bit easier to use and more technically advanced than LambdaTest visual testing tools. I also felt Percy by BrowserStack was more commonly used and trustworthy of a product.
Applitools was the most technically advanced for visual testing but …
Ultimately, Datadog had the most already-built bridges into our existing infrastructure -- third parties that we're using for certain services are far more likely to work with Datadog than other systems. This means that, while expensive, Datadog has done a tremendous amount of …
Datadog empowers us to create dashboards and visualize the state of our infrastructure in real time. It gives us control over what we want to view and how. The graphs provide deep insight into trends and anamoly detectives. These features are lacking in some of the other …
Zabbix is a great, free solution. While not everything is discovered and configured out of the box, it is a powerful tool that allows for complete customization to what your organization needs as far as a monitoring solution. We've invested the time to make Zabbix powerful, …
Zabbix was much better at handling traditional systems, and in ease of customization, both in the system itself, and customizing data sources, such as adding deep MySQL or JMX integrations. It's very good for organizing large-scale (hundreds or thousands of servers) systems; …
I personally prefer Zabbix over any other monitoring software that I have ever tried. Zabbix is so customizable that if there is a feature I need, I can easily implement it. I can then add that feature to a template in no time and have it applied to hundreds, or even thousands, …
More extensive and customizable than SaaS solutions. Much less learning curve than Nagios. Cost is very much lower than SaaS monitoring especially at scales over 1000 hosts ($15,000/month for SaaS!!) Templating systems allows for easy management and monitoring of groups of …
Zabbix is cost effective maybe and certainly a good tool but not the best. The other ones have features that Zabbix is missing and we use couple of them.
Nagios has some advantages over Zabbix like "flapping" detection and multiple alert levels - Error, Warning and OK. However, the disadvantages of Nagios like needing an addon (NRPE) to monitor remote system internals (open files, running processes, memory, etc), no charting of …
If you need immediate testing (for example, from Azure pipelines agents), use BrowserStack instead of LambdaTest (which makes you wait in a "pool" until the device/platform combo you are querying is accessible). If you don't need your tests to be immediate and prefer a wider range of devices, then use Lambdatest.
Datadog may be better suited for teams that have a more out-of-the-box infrastructure, on the primary platforms Datadog supports. You may also have better results if you have a bigger team dedicated to devops and/or a bigger budget. We found that trying to adapt it to our use case (small team, .NET on AWS Fargate) wasn't feasible. We continually ran into roadblocks that required us to dig through documentation (and at times, having to figure out some documentation was wrong), go back and forth with support, and in my opinion, waste money on excessive and unintended usages due to opaque pricing models and inaccurate usage reports, as well as broken/non-functional rate sampling controls.
Zabbix is great for monitoring your servers and seeing alerts when the system uses too much CPU or memory. This allowed the system Engineer to be proactive and add resources to these systems to avoid interrupting the services. Especially servers running operations applications and services. This is one of the best usages for Zabbix.
The thing which Datadog does really well, one of them are its broad range of services integrations and features which makes it one step observability solution for all. We can monitor all types of our application, infrastructure, hosts, databases etc with Datadog.
Its custom dashboard feature which helps us to visualize the data in a better way . It supports different types of charts through those charts we can create our dashboard more attractive.
Its AI powered alerting capability though that we can easily identify the root cause and also it has a low noise alerting capability which means it correlated the similar type of issues.
Collecting hardware data - CPU, Memory, Network, and Disk Metrics are collected and reported on.
Flexible design - It is very easy to build out even very large environments via the templating system. You can also start where you are - network monitoring, server monitoring, etc. and then build it out from there as time and resources permit.
Provides a "plugin architecture" (via XML templates) to allow end users to extend it to monitor all kinds of equipment, software, or other metrics that are not already added into the software already.
Very complete documentation. Almost every aspect of Zabbix has been documented and reported on.
Cost - Zabbix is FOSS software and always free. Support is reasonably priced and readily available.
Alert windows cause lag in notifications (e.g. if the alert window is X errors in 1 hour, we won't get alerted until the end of the 1 hour range)
I would appreciate more supportive examples for how to filter and view metrics in the explorer
I would like a more clear interface for metrics that are missing in a time frame, rather than only showing tags/etc. for metrics that were collected within the currently viewed time frame
It's almost the 3rd year for us and it's renewal time for us. So yes, we are already discussing how many licenses we need to increase as users are increasing internally. So it's 100% sure that we are already planning renewal this year as well BrowserStack with live and app automate.
It is free. It didn't cost anything to implement (other than my time and the cost incurred for it) and it is filling a badly needed gap in our IT infrastructure. Support is available if we have issues and can be done annually or paid for on a per incident basis as needed. Expansion, updates, and all other future lifecycle activities are likewise free of cost, so as long as someone is able to implement/maintain the software (and the OSS project is maintained) then I imagine the company will never leave it.
So many options that it can be a little overwhelming, but the core functions are easy to find and use and it's usually not too hard to figure things out for the more complex tasks. Very easy to boot up a device and a specific browser from the dashboard to begin a manual website test.
There are so many features that it can be hard to figure out where you need to go for your own use case. For example, RUM monitoring us buried in a "Digital Experience" sidebar setting when this is one of our key use cases that I sometimes struggle to find in the application. It appears that ECS + Fargate monitoring was recently released which is great because we had to build a lambda reporting solution for ephemeral task monitoring. But this new feature was never on my radar until I starting clicking around the application.
I think every organization, especially the IT department, needs a tool like this. I know of another product like Zabbix that gives a similar or the same solution, but its range makes it very useful. You can see almost all the device info in one place: disk usage, disk space, network usage, etc.
I rated BrowserStack's availability a 10 because it is consistently reliable, with minimal to no downtime or unplanned outages. The platform is accessible whenever needed, ensuring uninterrupted testing. Its robust infrastructure and proactive monitoring ensure a seamless experience, allowing us to meet deadlines without delays caused by availability issues and all
The tests are fast considering the fact that they're Appium tests. I've seen tests reliably pass or fail when they're supposed to, with next to zero issues on the BrowserStack side of things. Tests launch only seconds after I kick off them off from my CLI.
I've not had much direct interaction with the BrowserStack support team. The help and community are great and we've not run into any issue that has really required us to reach out. I guess having a stable and easy to use system means you may never need to contact support.
The support team usually gets it right. We did have a rather complicate issue setting up monitoring on a domain controller. However, they are usually responsive and helpful over chat. The downside would be I don’t think they have any phone support. If that is important to you this might not be a good fit.
The setup is the most time-consuming portion of using zabbix. It takes a lot of effort to shape it into a usable format and even then it can get very messy. It's not exactly intuitive and as mentioned the UI seems a bit antiquated. If I was to roll out a monitoring solution from scratch, I'd probably look for alternatives which are easier to use and maintain.
Yes, it was online training on meet, and trainer looks like skilled and technical strong, he has covered end to end all the features and he has answers all the queries. because of this trainings we are able to implement it by our own in the organization, thank you for support and training.
It was a quick training from the support of browserstack, it was nice and easy to understand, thanks again for the support given by the team. and regularly I used to receive mails for training from support for any new feature they launch, I was able to spread same training to all my team and dev.
I rated the implementation satisfaction an 8 because while it went smoothly overall, there were some challenges during the initial learning phase and integration with existing tools. Key insights include the importance of providing sufficient training upfront and ensuring seamless integration with other systems to minimize disruptions and improve adoption speed.
We are a mainly Windows environment, so it would be useful if we could have used Active Directory to deploy agents. As of version 4.2, Zabbix has announced a new agent MSI file to allow exactly that. Unfortunately, we didn't have that option. Also, for Linux and MAC deployments, there is no simple way to deploy that. Using remote scripts you may be able to create something, but most places will opt for either SNMP (agentless) or manual installation of agents to add to Zabbix. A way of deploying agents via discovery would go a long way to helping in the adoption of the tool.
BrowserStack products has been found better for low code automations and visual regression techniques. We have been struggling to maintain the API endpoint sanity tests and writing a lot of code for them while releasing the builds, while we chose BrowserStack accessibility solutions, we found it a way easier than we thought and worked it up.
Our logs are very important, and Datadog manages them exceptionally well. We frequently use Datadog services for our investigations. Use case: Monitor your apps, infrastructure, APIs, and user experience.
Key features:
Logs, metrics, and APM (Application Performance Monitoring)
Real-time alerting and dashboards
Supports Kubernetes, AWS, GCP, and other integrations
RUM (Real User Monitoring) and Synthetics
✅ Best for backend, server, and distributed systems monitoring.
We're using the Solarwinds suite as our global monitoring standard, but it is very complex and its licensing model makes it difficult to monitor a wide range of technologies. So, we're using Zabbix as a complement on our monitoring process. Zabbix is a way more flexible and has free integrations to a wide range of technologies. It is also more 'user friendly' and easy to manage.
I may not be the best person to answer this as I am only using it for 1 department and at 1 site but will still try my best As far as Scalability for Devices for Mobile Automation is concerned, it gets a Solid 10, as the users can run cases on upto 10 device parallel and also have the best choices of devices to choose