Chartbeat delivers real-time analytics, insights, and transformative tools for content teams around the world, to help improve audience engagement, inform editorial decisions, and increase loyalty.
N/A
Parse.ly
Score 7.8 out of 10
N/A
Parse.ly is a content optimization platform for online publishers. It provides in-depth analytics and helps maximize the performance of the digital content. It features a dashboard geared for editorial and business staff and an API that can be used by a product team to create personalized or contextual experiences on a website.
$499
per month
Simply Measured (discontinued)
Score 7.2 out of 10
N/A
Simply Measured was a social media analytics and measurement tool for business users that competed with Socialbakers and the Dachis Group Social Business Index. It was acquired by Sprout Social in 2017, and is no longer available. However its features are now contained in the Sprout Social Premium Analytics add-on.
$89
per month per user
Pricing
Chartbeat
Parse.ly
Simply Measured (discontinued)
Editions & Modules
No answers on this topic
No answers on this topic
Standard
$89
per month per user
Professional
$149
per month per user
Advanced
$249
per month per user
Offerings
Pricing Offerings
Chartbeat
Parse.ly
Simply Measured (discontinued)
Free Trial
Yes
Yes
No
Free/Freemium Version
No
No
No
Premium Consulting/Integration Services
Yes
Yes
No
Entry-level Setup Fee
No setup fee
Required
No setup fee
Additional Details
Chartbeat pricing is based on monthly site page views. Discounts are applied to multi-year contracts. The Basic Plan includes the Real-time Dashboard, Historical Dashboard, Heads Up Display, Reports, Big Board, iOS and Android app, and Real-time API endpoints.
The Plus Plan includes all of the Basic Plan features, plus ONE of the following Premium features: Headline Testing, Advanced Queries, or Multi-Site View.
The Premium Plan includes all of the Basic Plan features, plus ALL Premium features: Headline Testing, Advanced Queries, Multi-Site View, and enterprise-level support and custom trainings.
—
Sprout Social’s pricing starts at $99 per user per month for the Standard plan. The Professional plan offers additional features for businesses at $169 per user per month, and the Advanced plan offers solutions for businesses at scale at $279 per user per month. Annually, the Standard plan costs $1,068 per user, the Professional plan is $1,788 per user annually, and the Advanced plan is $2,988 per user per year.
In a previous job I had use of Parse.ly and, while at the time I thought it was a very useful tool, it wasn't as detailed as the Chartbeat metrics. Chartbeat gives you more insight into concurrents on your website at a given time, rather than just individual stories, and when …
Larger analytics suites like Google Analytics and Omniture simply do not provide the kind of real-time data that Chartbeat does. I have used Parse.ly which has some interesting real-time features as well; I would say Parse.ly is similar in terms of ease of use, though Chartbeat …
Other products like Chartbeat that I've used are Parse.ly, GA, and Omniture. Parse.ly is the only tool, in my opinion, that offers more real-time data, but the interface is lacking and isn't as intuitive as Chartbeat.
I used Parse.ly before I used Chartbeat. We shifted away from Parse.ly because it's social standing wasn't as good, it was mostly for site readership and we needed a bigger concentration on social media that Parse.ly couldn't provide. It's not listed, but we now use Social Flow …
Chartbeat is certainly better at visualizing content and segmenting the data all on one screen. We can filter by section, author, channel and more without leaving the main dashboard page. Combining properties together in roll up groups is another key feature. We're able to …
When I referenced a Parse.ly competitor earlier in my review, I was referencing Chartbeat, the platform used in every newsroom I encountered before my current employer switched to Parse.ly. Both get the job done, but as I said earlier, whether it be reality or perception, Chartb…
Parse.ly is easier to understand with more detail that is relevant to the team. Google Analytics, while some parts of the business still use it in conjunction with Parse.ly, can be confusing with so many options to choose from. Chartbeat doesn't have as many features as …
Parse.ly was already used at my company when I started, we stayed because they'd done a lot of work on their end to make sure that our site's architecture was properly read in our system. We appreciated the work they put into making the system work for us. I did miss the …
Having used both Parse.ly and Chartbeat I personally just think Parse.ly is a better product. The UI is better and the features are more optimal and well thought out, again fitting publisher needs very well. In addition, whilst Chartbeat is certainly an improvement on GA in …
Parse.ly does pretty well compared to Chartbeat, particularly when it comes to historical information and analysis options that are easy for employees to use after some short training. The onboarding for Parse.ly is intuitive, and the scheduled reports take away basically all …
Parse.ly seems to be more user-friendly than Adobe and is on the same user-friendly level as Chartbeat. Chartbeat had features that I would love to see integrated into Parse.ly like an overlay feature that showed where website users were dropping from that page. Chartbeat also …
Parse.ly is easier to use and more self-explanatory than Google Analytics. The site essentially explains itself upon visiting it. Chartbeat was quite good but I believe Parse.ly provides more granular details on web traffic and gives the user more insights into how and why …
Firstly, I didn't make the business decision to use Parse.ly. I'm just an employee using it. However, the first thing you notice is the change in appearance. Parse.ly's dashboard looks far more complicated than Chartbeat's and the black, white, and green theme [are] not as …
Doesn't come with an integrated overlay like Chartbeat, but is more intuitive (just) than GA. Seems more accurate and detailed than Chartbeat but less than GA. It's my go-to for day-to-day traffic engagement but monthly I'm more likely to look at in-house GA-generated reports.
Verified User
Employee
Chose Parse.ly
Parse.ly provides clearer insights into what stories are performing strongly in real time. Its interface is more user-friendly and it is easy to compare different time periods, titles or author statistics. Chartbeat had a website overlay to show where readers are going on site, …
Verified User
Manager
Chose Parse.ly
Parse.ly is the most comprehensive interface and system.
Parsely has the best UI, best reports, best real-time data, and the best historical data that I've used. I'd never go back to any of the tools I've used before.
Verified User
Manager
Chose Parse.ly
One of the things users first say when they start with Parse.ly is how easy it is to navigate through a lot of data thanks to the design. Parse.ly also has several data points and metrics that their competitors do not track. The automated reporting also makes it much easier to …
As GA and AA are more general purpose digital analytics tools, they can be configured to do any type of web analytics tracking. However, Parse.ly is custom-made for editorial teams and newsrooms. Parse.ly is far more intuitive and easy to use. It's a fantastic tool for …
Verified User
Program Manager
Chose Parse.ly
It's not as powerful or reliable as Google Analytics (e.g. it's missing demographic data, and doesn't integrate with Google Search Console or AdWords), but it meets most of the basic requirements that we need. It's a difference user experience in general, and slightly more …
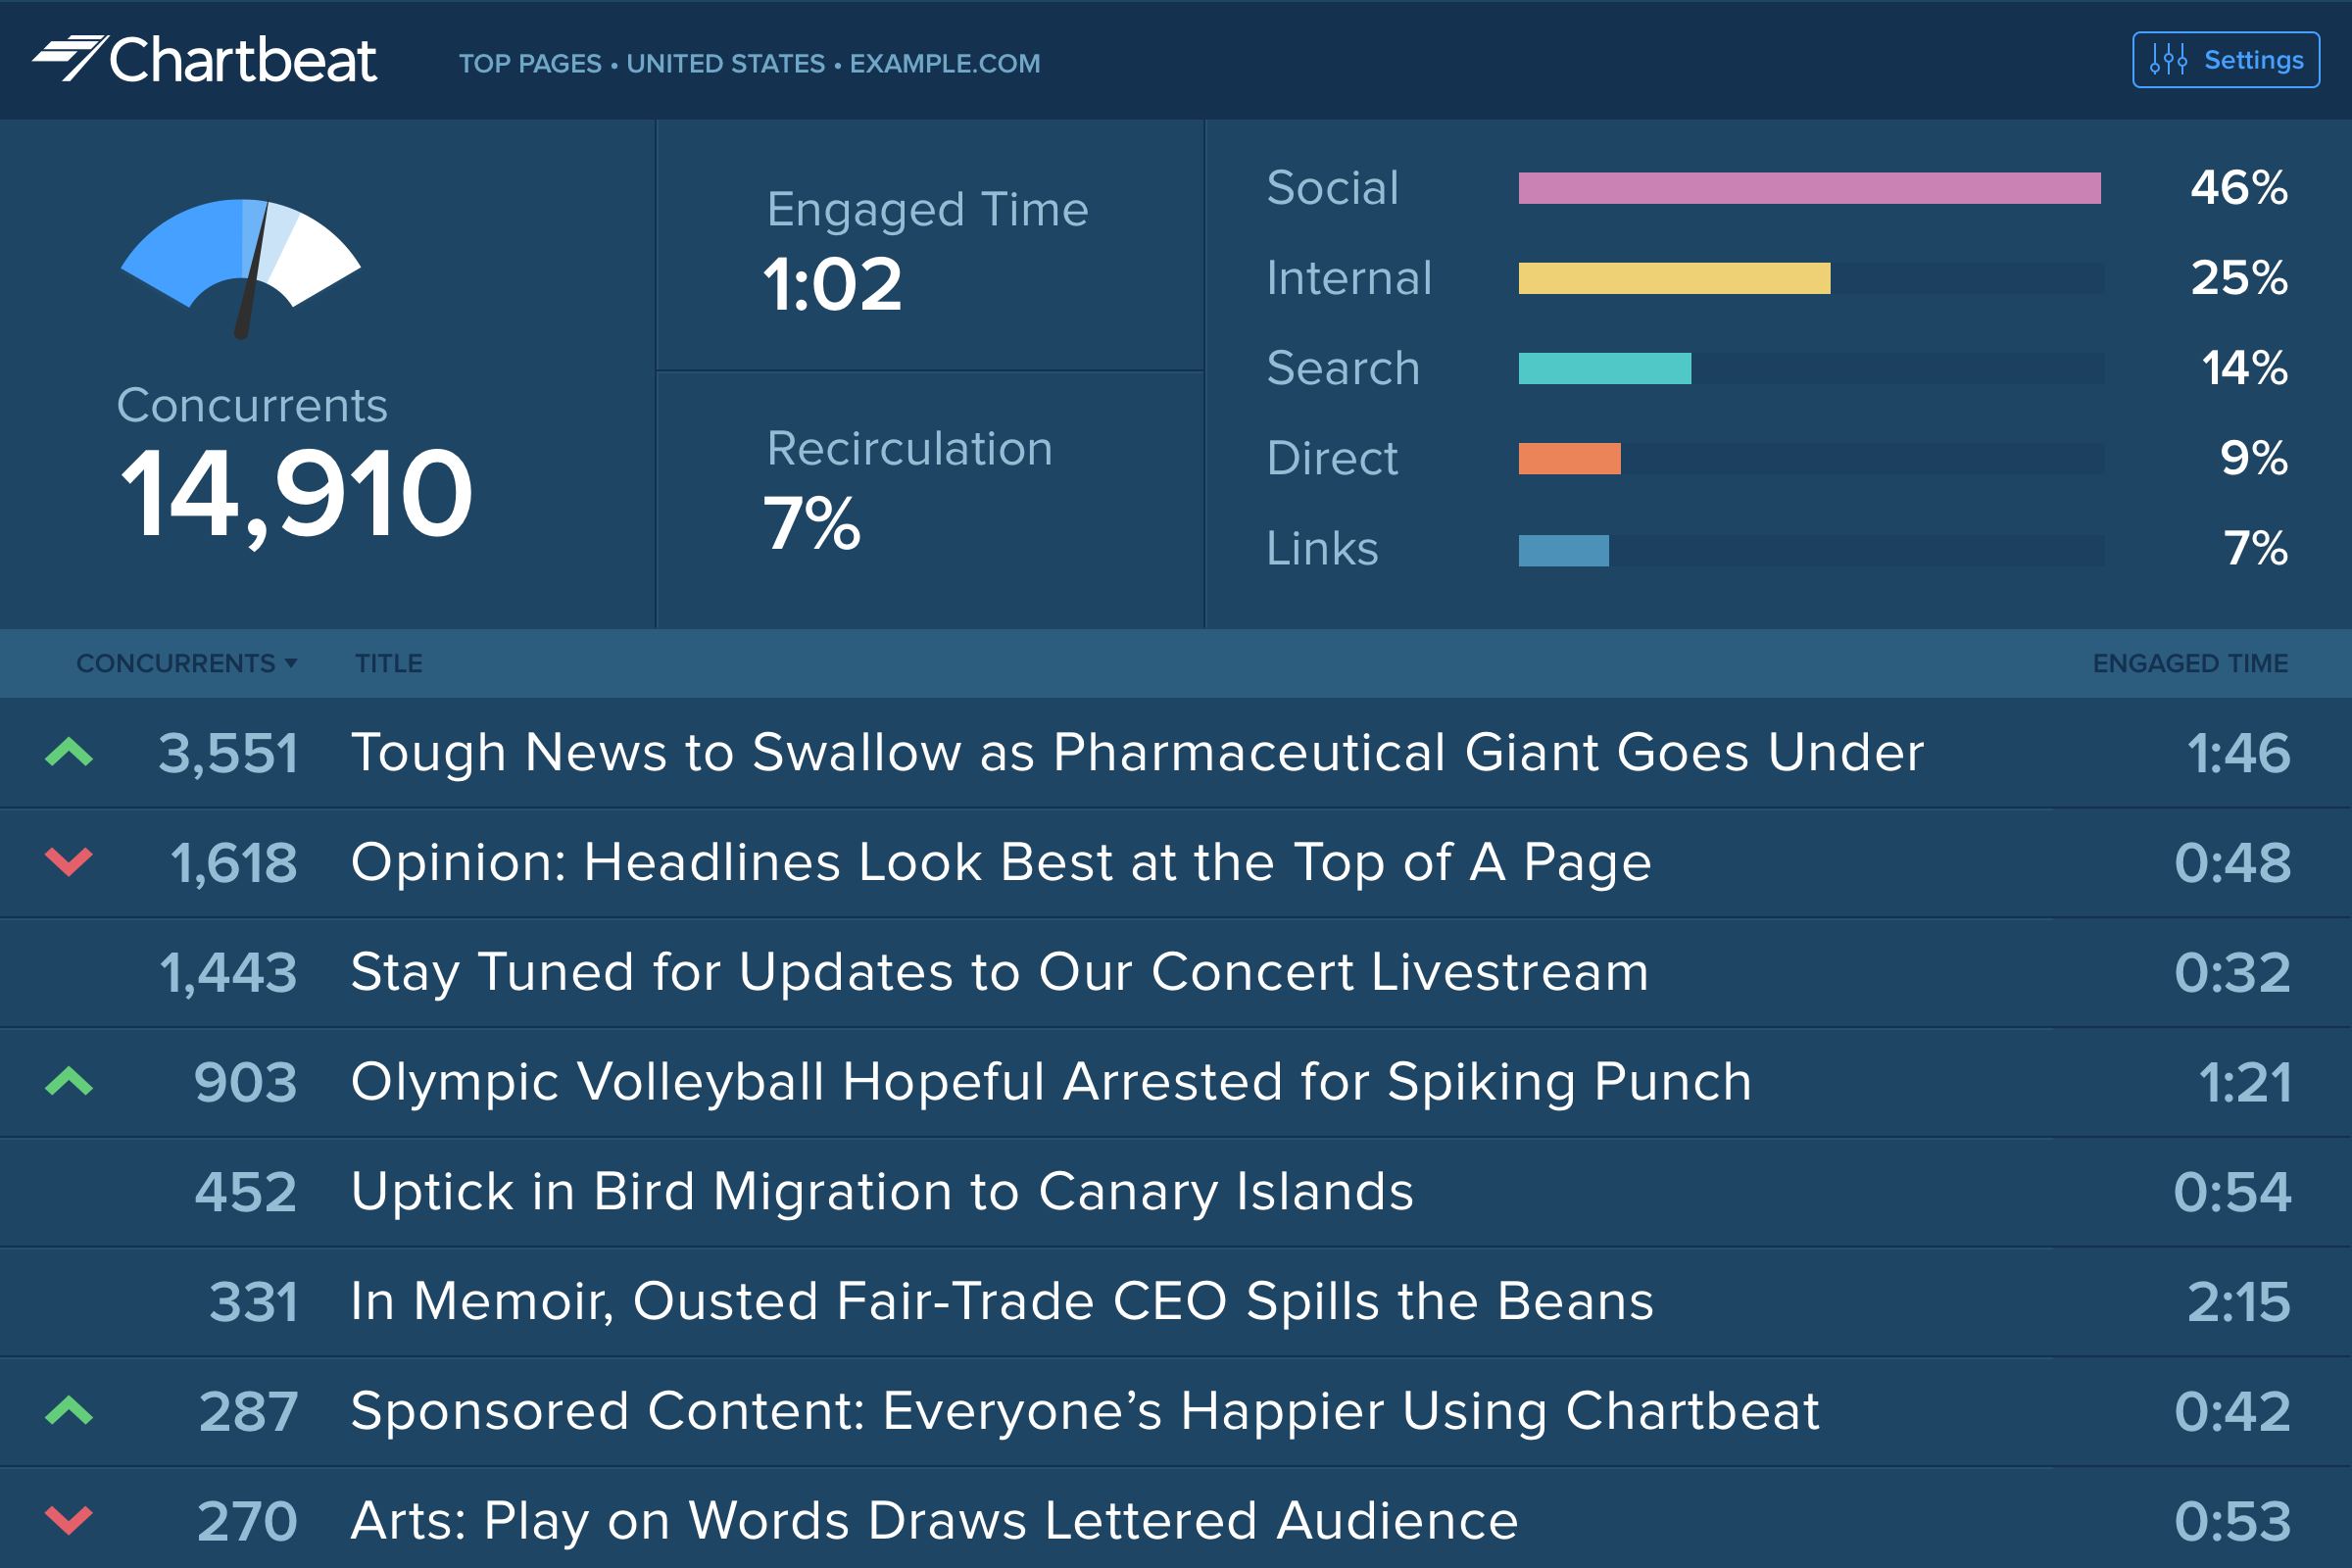
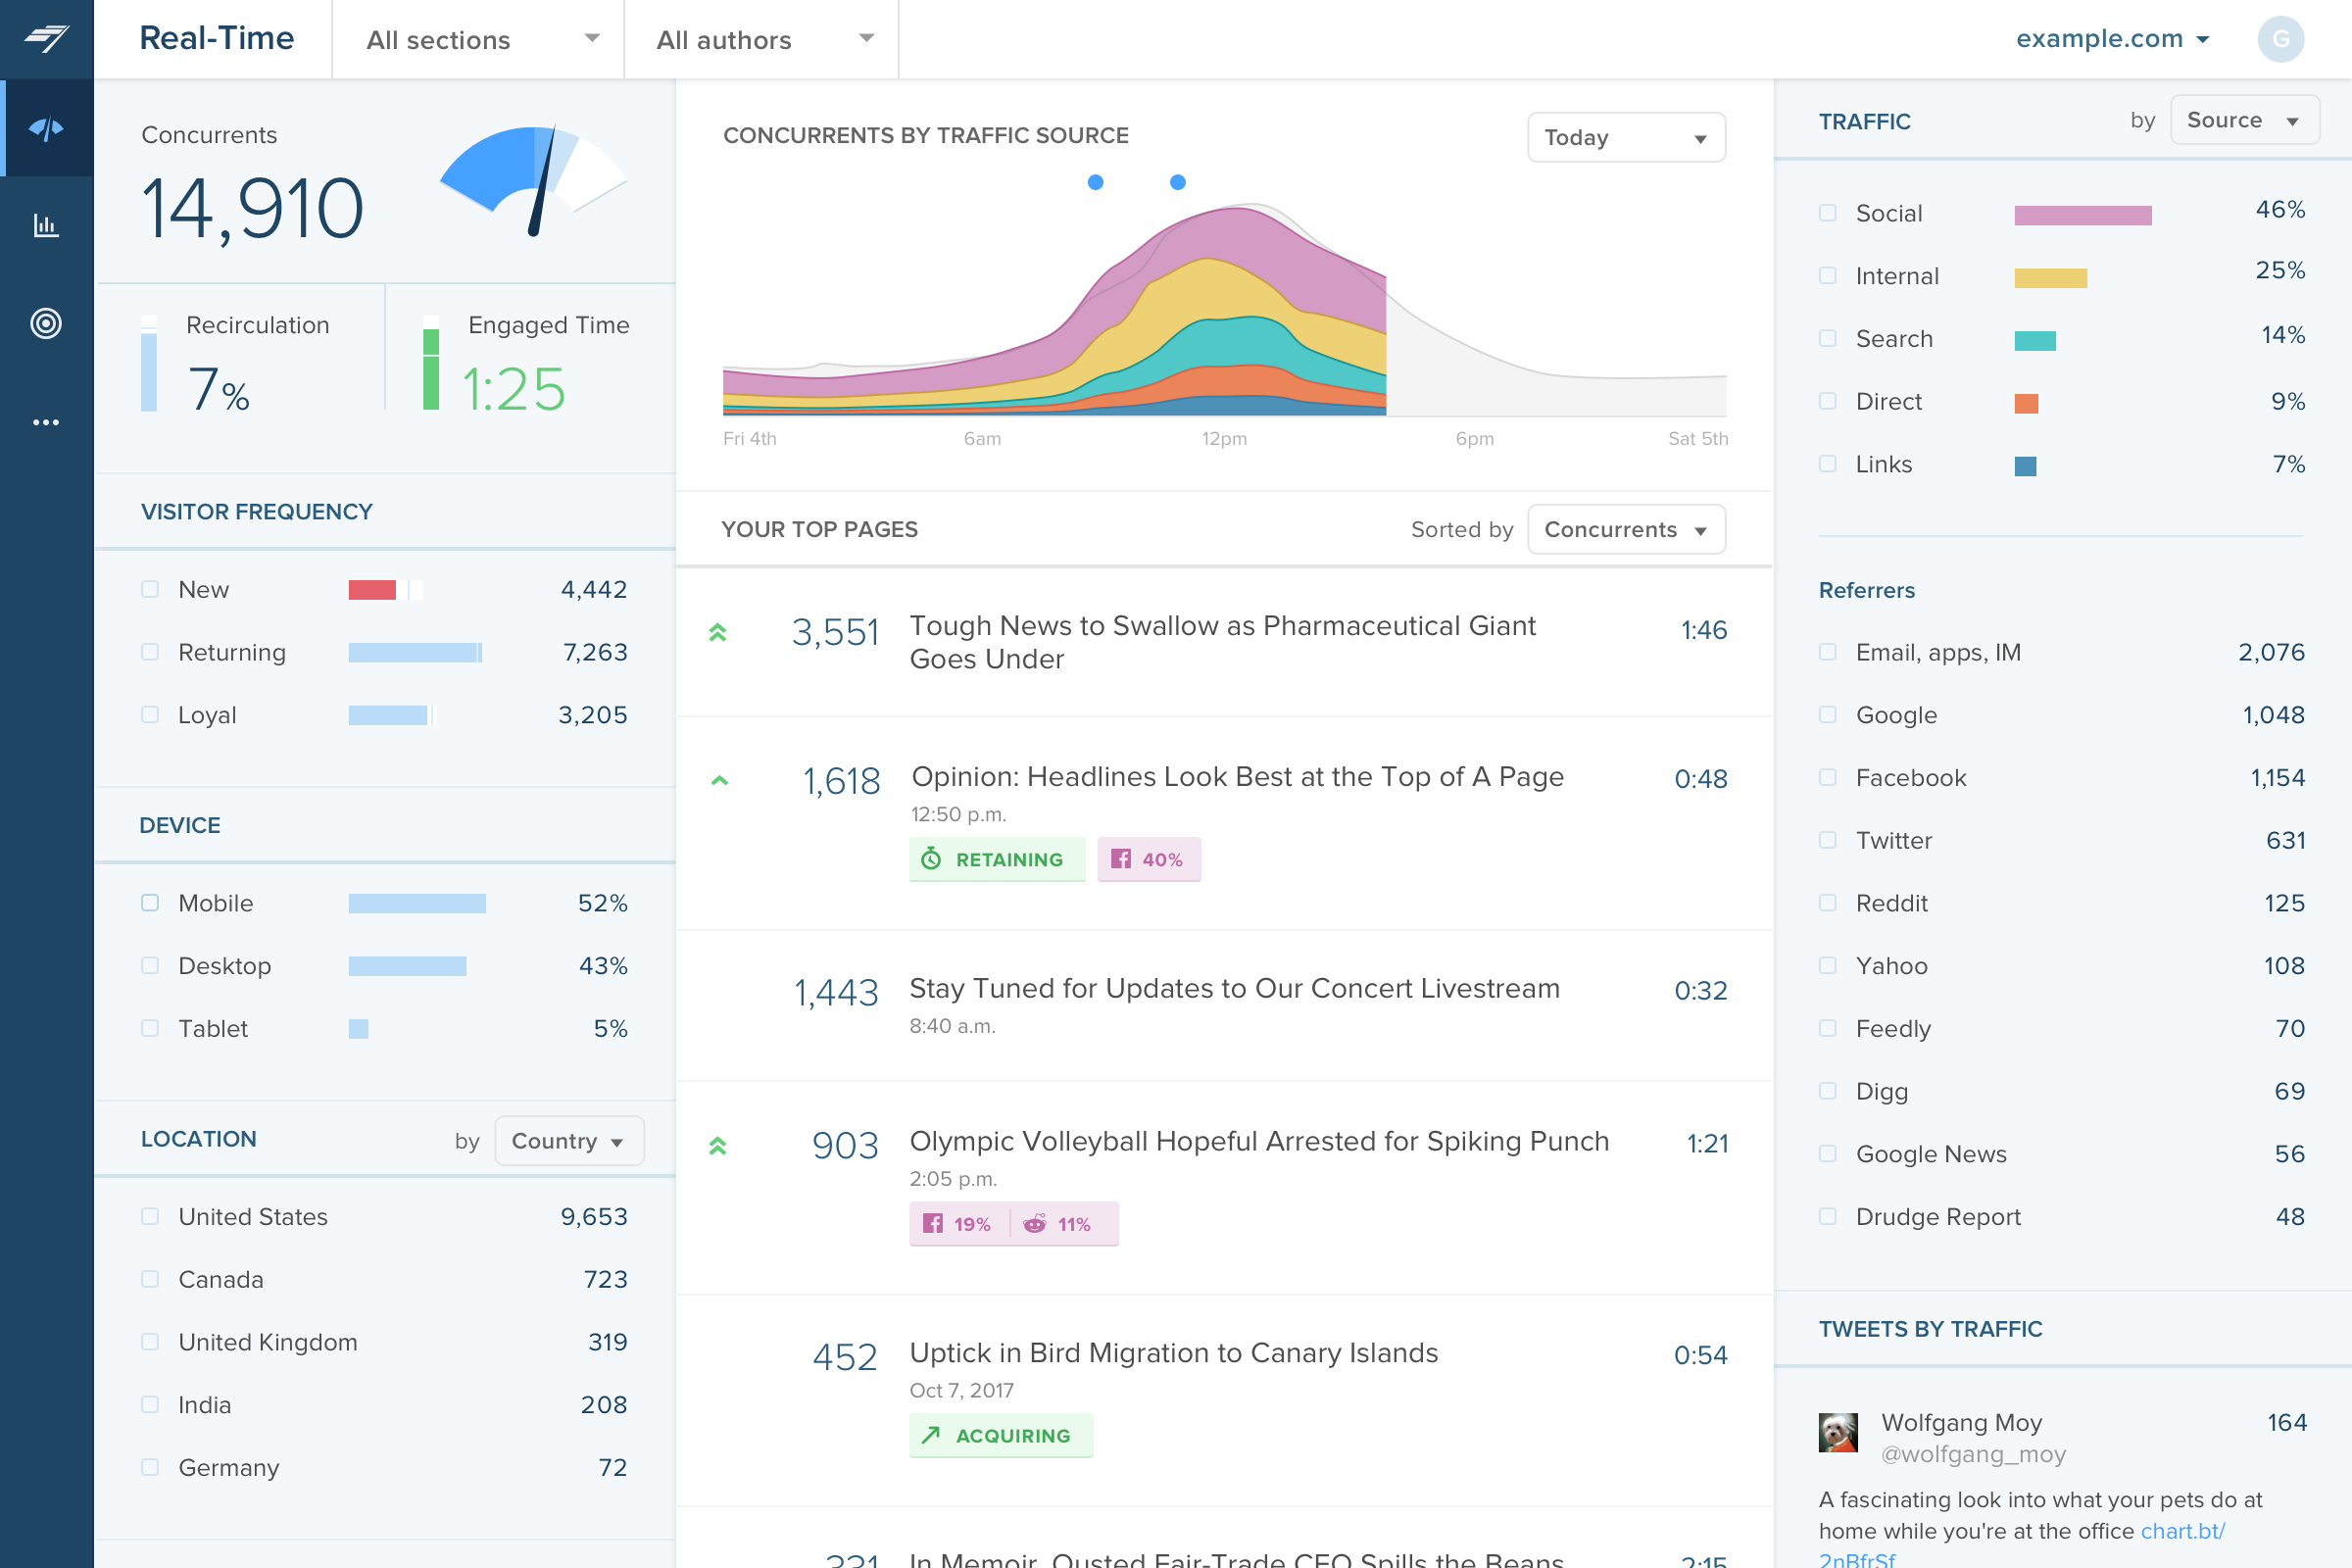
The main point of benefit is the realtime data. This is vital to our team as we are publishing a lot of content per day, so we have a busy homepage to manage and it's important to know which content is performing well. We also like to get an understanding as quickly as possible - which Chartbeat offers - of where traffic is coming from. Often we will see an example where a page is getting high traffic from Google, for example, and we know that might not need to be placed so prominently on the homepage because the traffic is arriving to us externally anyway. Without that depth of understanding what is performing best and why - updated immediately, unlike in Google Analytics now - our homepage would not be as well optimised for users coming to us direct
Parse.ly is a great tool for publishers who want to track engagement and audience behaviour across websites. With Parse.ly, we can easily track metrics like pageviews, time spent on page, and scroll depth to see which content is resonating with our audience and optimize our content strategy accordingly. Our marketers found Parse.ly to be an excellent tool for tracking the effectiveness of our campaigns. We can use Parse.ly to track metrics like referral sources, conversion rates, and engagement by audience segment to see which channels and tactics are driving the most engagement and conversions.
When we we're determining what's important to us we think budget, are we stuck in a contract; can it grow with our needs without hurting our pockets; can it solve our needs because we're such a large company that we almost need several solutions in one. Reporting - am I able to provide management the details they need to know to prove ROI? Also can we prove that demand generation efforts lead to closed deals?
Customer service analysis has been extremely useful for determining sentiment and adding context to real time crisis situations.
Convenience of pulling data for all social channels at one time is extremely effective in making decisions in real time and to compare against other channel performance. The cross channel export minimizes a great deal of time for exporting data. Nearly all social channel data is available.
Reports are extremely user friendly, visual and easy to export. Also the ability to see the raw data and to have it for historical reference is great.
Key insights generated in the dashboard page help add fast context for performance.
Source of traffic needs improvement. Search and social make sense, but "internal" and "links" is a grey area. It would be helpful to define those with an organization and provide an information icon so users can easily remember what each of those buckets is tracking.
More ways to customize the real-time board. For example, with video content, that's great that I can see a user has started a video, but what is the completion rate, was that only on O&O or can that track Facebook, too?
Would like to see demo (age) information included as a way to slice the data so I can see what's working with my older and younger demo.
While it incorporates MOST platforms not all of them, I believe Pinterest was still in trial. They will need to keep up to date as new platforms emerge.
Not a super user friendly interface. I found it to be a bit clunky and dated looking.
While their training was good, and they had good support resources, I think they good do more with marketing and education to help my team uncover more value from the software.
I gave Chartbeat a 5 for a renewal rating, because, while it delivers clear and understandable content, Google Analytics also provides many of the same features for free. For a small to medium website, I believe it would be more cost effective to use Google Analytics. A website with a high amount of traffic, however, could merit spending the money on Chartbeat to maximize their potential.
As an employee, this is difficult for me to comment as I am not directly funding or making these business decisions. However, it is a tool many get on with for surface level data that is useful to editorial teams.
For my current client, it's not right - they would not be actionable with the data to really need this tool. For my past clients, I would suggest they stay on it and i think they would agree.
I am able to "set it and forget it," keeping it up on my monitor for either constant checking or just keeping an eye on the numbers during the day. I'm also able to keep track of what times are perfect to post a story and which stories rack up the most traffic.
The Parse.ly platform is very user-friendly and easy to use. User management is simple, and reporting setup only takes a few minutes. They provide very helpful documentation for implementing the scripts on your site and have great customer support to help with custom development such as implementing their content recommendation engine.
I have had limited experience of support for Chartbeat but whenever I have needed help it has been there. Recently there was an issue of seeing different forms of data in real time - app and otherwise effectively, and the issue was being clearly dealt with and communicated back to us.
I rate this question this way solely because I haven't requested any support. I feel where I will eventually get support would be when we take Parse.ly up on some training that is being offered. We are looking to do that at some point after the first of the year and when our schedules support it.
Extremely fast response and they go above and beyond without asking. The support team has provided me data beyond our limit before and it was not an issue and not an extra cost, really good business support.
Omnilytics is more robust, detailed, and catered for an intermediate media user, while I think Chartbeat is a more user-friendly and beginner-oriented piece of technology. That being said, there is an impressive amount of lift for Chartbeat, and it's evident that simplicity is the key to using a software daily (which is absolutely the point in the content world).
Parse.ly does pretty well compared to Chartbeat, particularly when it comes to historical information and analysis options that are easy for employees to use after some short training. The onboarding for Parse.ly is intuitive, and the scheduled reports take away basically all of the inconvenience associated with regular metrics reviewing. But Chartbeat wins in its social audience tracking because it can source traffic to a specific social post, which can show you exactly how your audience is coming to your content and where you need to put your content to be sure you get that audience.
Simply Measured has more in-depth reports than other tools in this category. Other tools may feature a lower price and are easier to learn. Others focus on only one channel, let's say Twitter. Simply Measured is comprehensive, extensive and has the depth to match. It's one of the few tools that can measure the impact of an individual message as opposed to the account in aggregate.
Sometimes in meetings our editorial director will point out stories that didn't perform well. To us, that means readers don't really care about the topic, so we'll pivot away from writing about that in the future. That might not be "business objectives" though.
Increased efficiency of reporting. Although I still keep my own spreadsheets and create a few charts and graphs, Simply Measured's reports have saved me countless hours.
Greater Visibility: Simply Measured's reports have helped increase the visibility of what the social media team is doing. What executive doesn't like a smart report?