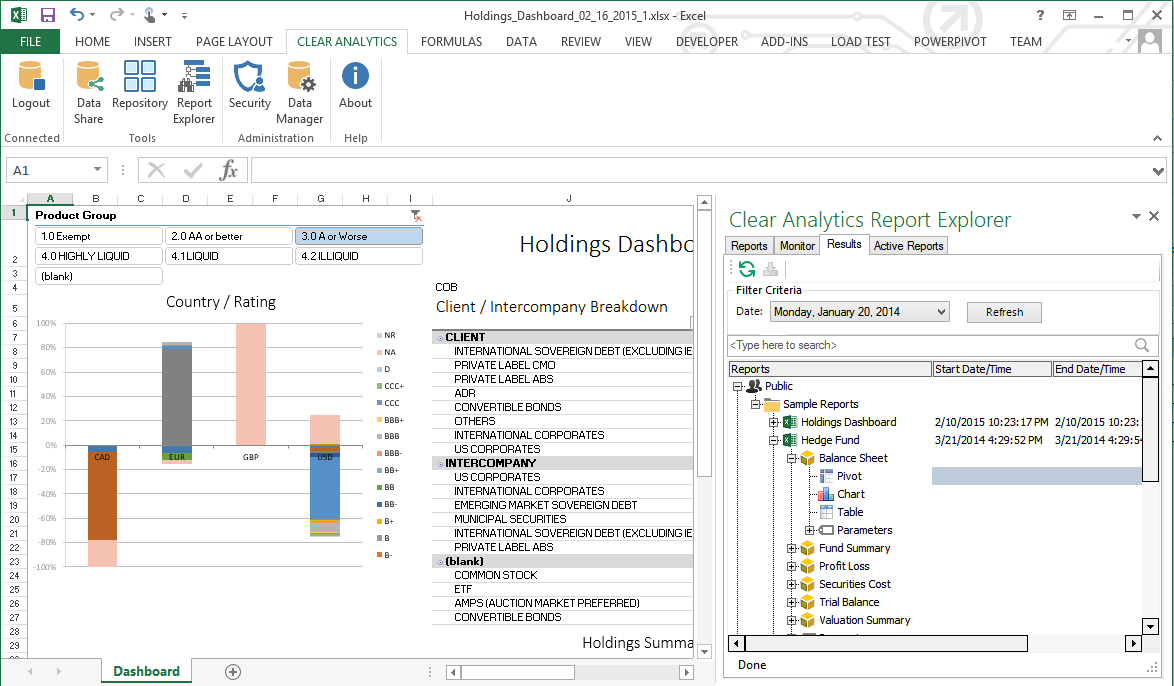
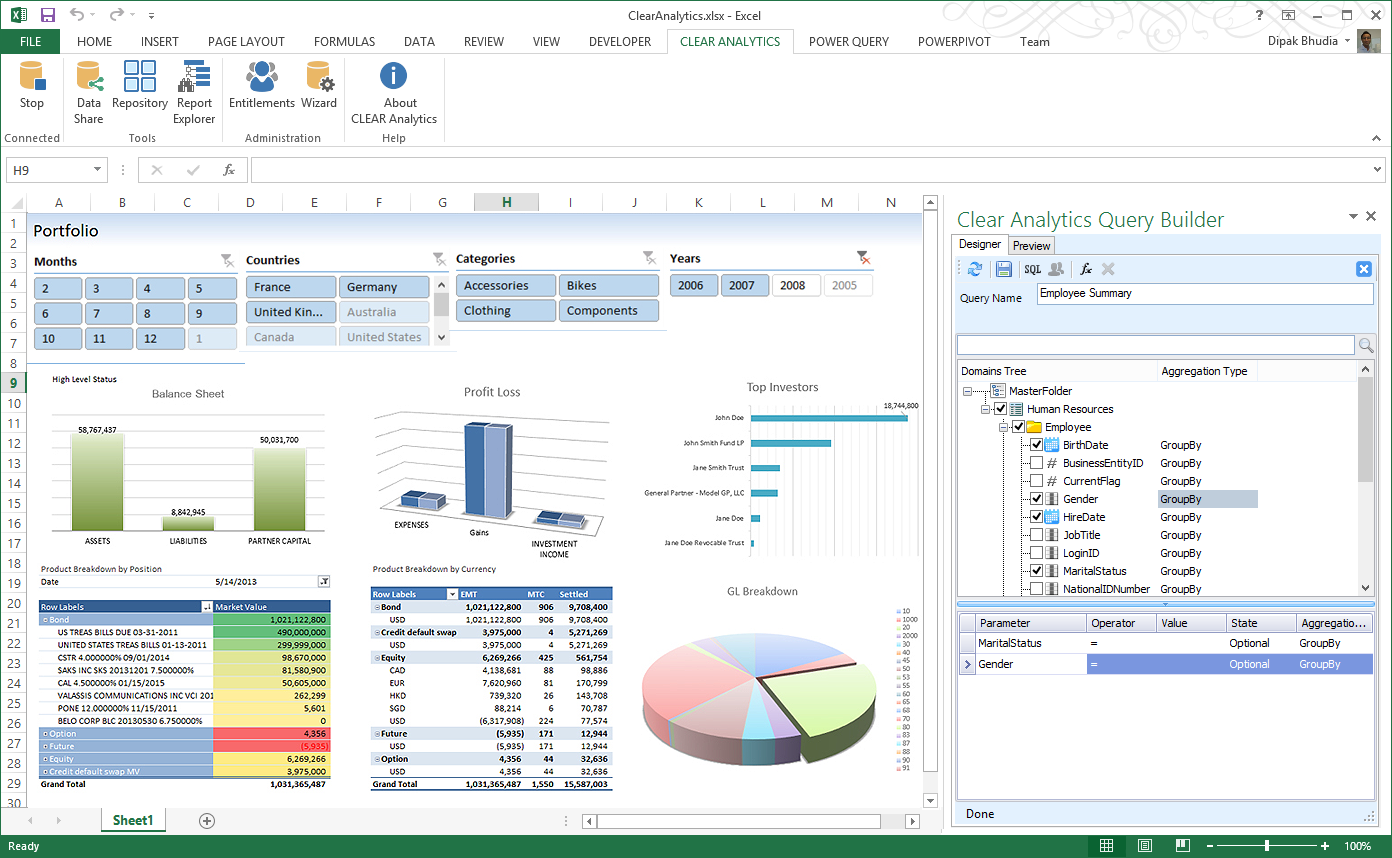
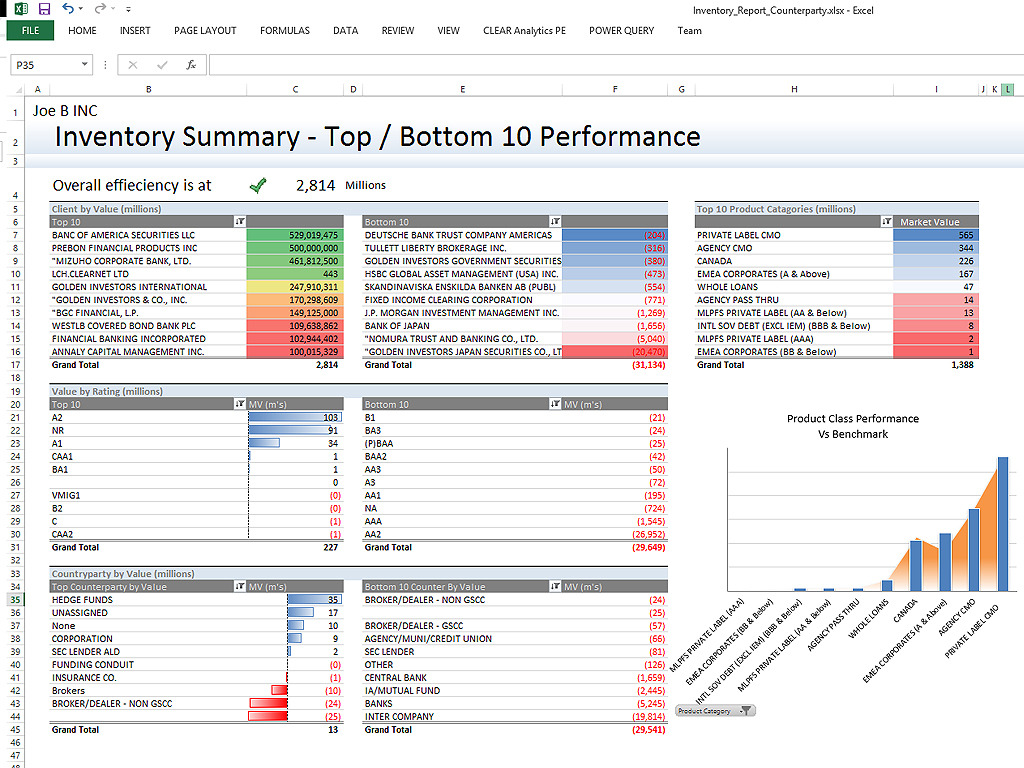
Clear Analytics is a business intelligence solution that enables non technical end users to perform analytics by leveraging existing knowledge of Excel coupled with a built in query builder. Some key features include: Dynamic Data Refresh, Data Share and In-Excel Collaboration.
$29
Per Seat per Month
Looker
Score 8.3 out of 10
N/A
Looker is a BI application with an analytics-oriented application server that sits on top of relational data stores. It includes an end-user interface for exploring data, a reusable development paradigm for data discovery, and an API for supporting data in other systems.
N/A
Looker Studio
Score 8.1 out of 10
N/A
Looker Studio is a data visualization platform that transforms data into meaningful presentations and dashboards with customized reporting tools.
$9
per month per user per project
Pricing
Clear Analytics
Looker
Looker Studio
Editions & Modules
Personal
$29
Per Seat per Month
Team
$165
upto 10 Seat per Month
Department
$265
upto 25 Seat per month
Organization
$565
Upto 100 per seat per month
No answers on this topic
Looker Studio Pro
$9
per month per user per project
Looker Studio
No charge
Offerings
Pricing Offerings
Clear Analytics
Looker
Looker Studio
Free Trial
Yes
Yes
No
Free/Freemium Version
No
No
Yes
Premium Consulting/Integration Services
Yes
Yes
No
Entry-level Setup Fee
$800 Initial OnBoarding
Required
No setup fee
Additional Details
Certain Enterprise level features can be made available to Small Business edition at additional cost. Such services include Scheduler and OLAP connectivity.
Custom adapters can also be created to connect to SaaS services.
Senior Manager, Digital Advertising & E-Commerce Team
Chose Looker
Google Looker Studio is an online tool for converting data into customizable, informative reports and dashboards. It is a free tool that turns performance data into informative, easy-to-read, easy-to-share, and fully customizable dashboards & reports. Google Looker Studio turns …
Looker works and exists in the Google ecosystem. If you are a Google Cloud Platform user, Looker is a no brainer. There is also Looker Studio, the small (free) brother with less features which is basically a report only viewer/creator. The reason we choose Looker is because can …
The dev/production environment distinction is constructive. Before, in Data Studio, all changes had to be made, which was very inefficient and risky as far as version control goes. Having a more centralized and organized space for all our data visualization is more helpful than …
Looker provides really excellent customer service in comparison to other similar products. The sharing aspect of Looker is also a big plus, which allows multiple users to access the data at the same time. We have also found it to stand out among competitors with its dashboard …
Unfortunately, I was not in charge of the decision to select Looker as it was before my time. I can see why the decision was made as I do see the potential. We have felt the need to supplement Looker with another free tool and, if our integrations weren't so deep and our …
The free version of Looker Studio is still better than the leading enterprise-embedded BI tools, despite its weaknesses. The leading embedded BI platforms have terrible visualizations that can be spotted a mile away. They are also primarily locked to a grid, making it very hard …
Looker Studio is great for free, simple Google-centric dashboards, while Power BI offers strong Microsoft integration, AI, and deep data prep (Power Query/DAX) for corporate users. Tableau excels in advanced visual exploration for complex data, though often much pricier. Fullst…
Google Data Studio is widely available and accessible, can be shared easily, and it only takes 20-30 min to build a rudimentary dashboard. It has very little setup and does not rely on internal data architecture and development. For later development purposes, Tableau, Power …
This is starting to feel redundant but we just Google Data Studio to supplement the areas that are lacking in our other BI tools. Because it's free it's an easy decision to make. It does not allow us the deep diving that we get with others but is often simpler to use, more …
Clear Analytics has almost all the features which are mostly required by the organizations for their data analytics and transformation activities. Clear Analytics is built on the support of a parallel query engine which makes it handle large volume requests and also provides optimized results. However, every solution has some limitations, Clear Analytics lacks advanced features such as Predictive Analytics which is a very demanding feature in the market as most organizations are adopting AI/ML automation for their businesses. Also, it needs to add a lot of advanced visualizations so that the user has the choice of selection. Overall a good solution to be recommended.
When data drives potential for new orders, Looker earns its place in our tech stack. If, on the other hand, we are hoping for pipeline generation, Looker is useful if you are willing to repeatedly go check customer utilizations .... it is not appropriate if you are hoping to automate data analysis for this purpose.
Visualizing cross-channel campaign performance can blend data from a few different sources to compare performance metrics like spend, clicks, and conversions side-by-side in a single view, which helps in quick budget reallocation decisions. When dealing with massive volumes of data (millions of rows) or highly complex queries, Looker Studio dashboards can become slow, laggy, or even crash. Performance issues are a frequent complaint when working with large datasets, making it unsuitable for enterprise-level companies
Show visited pages - sessions, pageviews - which programs are viewed the most.
Displays session source/medium views to see where users are coming from.
It shows the video titles, URLs, and event counts so we can monitor the performance of our videos.
It gives a graphic face to the numbers, such as using bar charts, pie graphs, and other charts to show user trends or which channels are driving engagement.
Our clients like to see the top pages visited for a month.
I like the drop-and-drag approach, and building charts is a little easier than it was before.
Breath of data - the number of ways to interrogate the data is endless, and the options to view metrics alongside each other make for comprehensive datasets.
Data visualisation and customisation - the options for presenting data and separating out across pages allow for clean visuals and segmented information.
Easy shareability/usability - a quick and simple tool to introduce colleagues to, and easy to grant access for them to be able to view the data, without having to understand the setup itself.
It needs better handling of complex logic. We often need workarounds to perform complex custom calculations, and it can be really unpleasant at times.
Felt it got slow with a larger data set, and in one minor report, we had to set up time filters so that calculations during spikes could be traced more quickly.
Compare to competition they need to improve with notification things.
I give it this rating because it deems as effective, I am able to complete majority of my tasks using this app. It is very helpful when analyzing the data provided and shown in the app and it's just overall a great app for Operational use, despite the small hiccups it has (live data).
It is the simplest and least expensive way for us to automate our reporting at this time. I like the ability to customize literally everything about each report, and the ability to send out reports automatically in emails. The only issue we have been having recently is a technical glitch in the automatic email report. Sadly, there is almost no support for this tool from Google, but is also free, so that is important to take into consideration
I have really enjoyed working with Clear Analytics. This platform has contributed to increased production and reliable data control processes. It has flexible user interface that can be operated by any organization member. Reports are shared on simple and transparent way in the dashboard for easy access. Data analytics from all departments have created manageable working environment that have increased production.
Looker is relatively easy to use, even as it is set up. The customers for the front-end only have issues with the initial setup for looker ml creations. Other "looks" are relatively easy to set up, depending on the ETL and the data which is coming into Looker on a regular basis.
Looker Studio is easy to use, and it offers a sufficient variety of predefined visualizations to choose from. It's easy for us, and anyone can set up basic reporting without extensive data visualization skills. The interface layout is easy to understand, and it doesn't take long to get used to.
Somehow resources heavy, both on server and client. I recommned at least 50Mbs data rate and high performance desktop comouter to be abke to run comolex tasks and configure larger amount of data. On the other hand, the client does not need to worry when viewing, the performance is usually ok
I have had multiple scenarios where I had to reach out to the support team of Clear Analytics, be it access-related, general queries, during initial implementation, etc. My overall experience has always been good. I got the needed support every time without any delay. I can definitely recommend Clear Analytics simply on the basis of its excellent support team.
Never had to work with support for issues. Any questions we had, they would respond promptly and clearly. The one-time setup was easy, by reading documentation. If the feature is not supported, they will add a feature request. In this case, LDAP support was requested over OKTA. They are looking into it.
I give it a lower support rating because it seems like our Dev team hasn't gotten the support they need to set up our database to connect. Seems like we hit a roadblock and the project got put on pause for dev. That sucks for me because it is harder to get the dev team to focus on it if they don't get the help they need to set it up.
There are other great tools that are out there but Clear Analytics is reasonable for our business and provides a lot of features that we specifically needed
Looker Studio, you can easily report on data from various sources without programming. Looker Studio is available at no charge for creators and report viewers. Enterprise customers who upgrade to Looker Studio Pro will receive support and expanded administrative features, including team content management. So it's good.
Looker Studio is far easier to implement, stand up, and learn. The interface is simpler and user-friendly for various levels of data visualization/analysis knowledge and experience. The biggest benefit of Looker Studio, however, is its ease of connection to GA data and speed. Furthermore, since it is an online program/tool, it requires less CPU/battery/storage on the user's device.
Looker has a poignant impact on our business's ROI objectives. As an advertising exchange we have specific goals for daily requests and fill, and having premade Looks to monitor this is an integral piece of our operational capability
To facilitate an efficient monthly billing cycle in our organization, Looker is essential to track estimated revenue and impression delivery by publisher. Without the Looks we have set up, we would spend considerably more time and effort segmenting revenue by vertical.
Looker's unique value proposition is making analytical tools more digestible to people without conventional analytical experience. Other competing tools like Tableau require considerably more training and context to successfully use, and the ability to easily plot different visualizations is one of its greatest selling points.