Datadog is a monitoring service for IT, Dev and Ops teams who write and run applications at scale, and want to turn the massive amounts of data produced by their apps, tools and services into actionable insight.
$18
per month per host
Dynatrace
Score 8.3 out of 10
N/A
Dynatrace is an APM scaled for enterprises with cloud, on-premise, and hybrid application and SaaS monitoring. Dynatrace uses AI-supported algorithms to provide continual APM self-learning and predictive alerts for proactive issue resolution.
$0
per synthetic request
Matomo Analytics
Score 8.6 out of 10
N/A
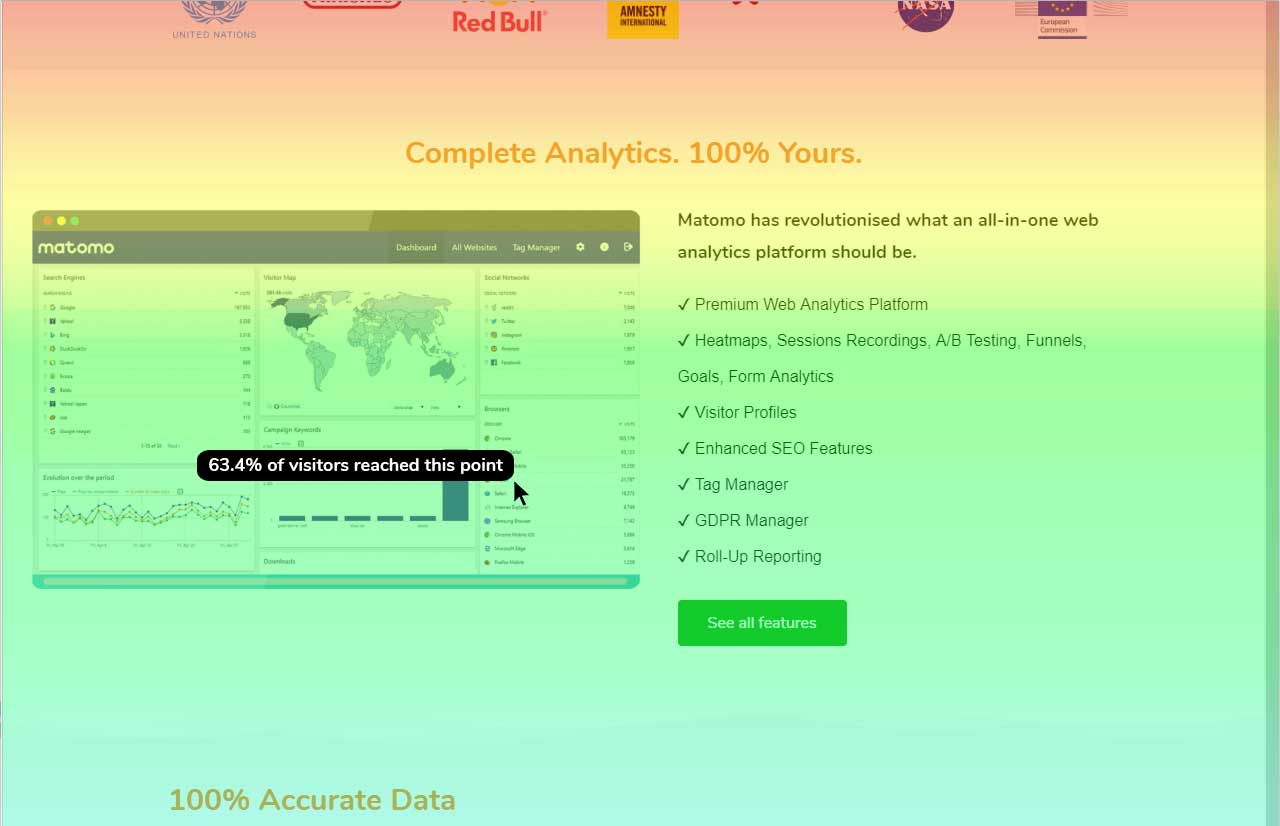
Piwik is an open source analytics platform that enables users to measure web and mobile apps as well as intranet portals. It protects the privacy of users through advanced privacy features and its approach to data ownership. Piwik offers On-premises and Cloud deployment options.
Available in over 50 languages, it is fully customisable and vendor-independent. Piwik offers over 70 integrations with Content Management Systems, Ecommerce solutions, Forums as well as other mobile and web platforms.…
$0
Pricing
Datadog
Dynatrace
Matomo Analytics
Editions & Modules
Log Management
$1.27
per month (billed annually) per host
Infrastructure
$15.00
per month (billed annually) per host
Standard
$18
per month per host
Enterprise
$27
per month per host
DevSecOps Pro
$27
per month per host
APM
$31.00
per month (billed annually) per host
DevSecOps Enterprise
$41
per month per host
Synthetic Monitoring
$0.001
per synthetic request
Kubernetes Platform Monitoring
$0.002
per hour for any size pod
Real User Monitoring
$0.00225
per session
Application Security
$0.018
per hour for 8 GIB host
Infrastructure Monitoring
$0.04
per hour for any size host
Full-Stack Monitoring
$0.08
per hour for 8 GIB host
Free download (open source)
$0
Free 30 day trial
$0
limited to 30 days
Essential
$9
number of pageviews (monthly traffic)
Business
$29
number of pageviews (monthly traffic)
Enterprise
$199
your requirements and monthly traffic
Content Optimization Bundle
$579
per installation
Growth Bundle
$1,149
per installation
Premium Bundle
$1,499
per installation
Email Support Subscription
$2,090
per installation
Offerings
Pricing Offerings
Datadog
Dynatrace
Matomo Analytics
Free Trial
Yes
No
Yes
Free/Freemium Version
Yes
No
Yes
Premium Consulting/Integration Services
No
No
Yes
Entry-level Setup Fee
Optional
No setup fee
Optional
Additional Details
Discount available for annual pricing. Multi-Year/Volume discounts available (500+ hosts/mo).
—
On-premise Edition is free to download and install on one's own servers.
Easier to set up and integrate with other auxiliary tools. The cost was also a benefit along with self-service capabilities. We could set up Data Dog by ourselves, versus needing to bring additional consulting efforts to setup Dynatrace. Reliability of results (less false …
Dynatrace was cheaper but, in my opinion, its setup, features, and overall user experience do not come close to what Datadog can offer, making it more of a pain to use and not worth the cheaper cost over Datadog (especially if migrating away from Datadog to Dynatrace).
First think first - it's easy to use, and very easy to implement in any infrastructure. It provides a custom dashboard and monitors. I’ve used or evaluated Grafana, Prometheus, Amazon CloudWatch, and Dynatrace, and each tool has strong capabilities. Prometheus + Grafana provide …
Datadog is best for cloud-native and fast-setup. It is more mature for infrastructure and real-time observability. The UI is more user-friendly and provides wide coverage of app insights.
UI of the Datadog is easy to understand and integration steps are easy to understand. It also provides the troubleshooting steps which are easy to understand. Supports multi cloud integrations which is very important for all the customers to know about the cloud service's …
Verified User
Engineer
Chose Datadog
I selected Datadog because of its features and the wide range of integration support. As I already told it supports more that 600+ integrations which helps and organization to keep everything in a single place and also its AI feature which is reducing the time for root cause …
Datadog crushed the competition on price and offering more solutions in one product cutting down on implementation time and effort while ensuring that the "integration" between one of their offerings was completely compatible with any of the others. I'm sure it's not the case …
The first reason for selecting Datadog was of course it's pricing which is quite better in terms of competitor like AppDynamics and splunk. Second thing is versatile services which they are offering on one platform which means entire end to end services can be monitor at one …
It's a one-stop solution for all our needs whereas in other open-source tools, we have an operational overhead to keep and manage the uptime of these tools as well and also manage their versioning, upgrade, and patching cycle. Also if there are any bugs then we have to raise an …
Datadog is a little harder to use from an end user standpoint but is probably a little more flexible from a script/automation perspective; it has more granular permissions but default access is not ideal for our usage. Sensu doesn't do application performance monitoring. …
There are many pros and cons. For some use cases, Dynatrace far exceeds the capabilities of the competition--for instance in automatically detecting issues and performing root-cause analysis, Dynatrace is clearly ahead of the others. For cloud monitoring, Datadog seems to have …
Datadog is a good system but does lack a lot of features provided by Dynatrace, and more importantly, it does not have the support Dynatrace provides. Many other systems, Zabbix, Nagio, AppDynamics also exist, but so far, Dynatrace really shines above them all.
Dynatrace gives the overall picture of the application usage and performance by default with minimal configurations whereas in Datadog a lot of manual intervention is required to analyze the application performance and troubleshooting the issues. Dynatrace is user-friendly when …
Our technical team showed me the completeness of Dynatrace against the competitors. Also, the breadth of services Dynatrace offered was a selling point.
Dynatrace leads the pack when you are looking for application performance monitoring, but the other tools are better suited for certain areas of specialty. Elasticsearch is better than Dynatrace at log aggregation. Prometheus is better than Dynatrace at collecting custom …
Dynatrace is a premier tool for hybrid environments. It also happens to be the most expensive. Dynatrace is bad at pricing and customer success. They charge a premium but do offer one of the better solutions on the market.
Senior Director of Engineering Site Reliability, Performance & Capacity
Chose Dynatrace
Dynatrace provides the deep dive analysis on our pure paths like none other. The AI capabilities are very promising and helpful in our drive toward self-healing systems. We also like the bot, Davis, that can help solve some of the ops issues.
Datadog may be better suited for teams that have a more out-of-the-box infrastructure, on the primary platforms Datadog supports. You may also have better results if you have a bigger team dedicated to devops and/or a bigger budget. We found that trying to adapt it to our use case (small team, .NET on AWS Fargate) wasn't feasible. We continually ran into roadblocks that required us to dig through documentation (and at times, having to figure out some documentation was wrong), go back and forth with support, and in my opinion, waste money on excessive and unintended usages due to opaque pricing models and inaccurate usage reports, as well as broken/non-functional rate sampling controls.
Dynatrace is well suited to a number of tasks. It is important to determine who the end users are and gather good information to tailor their experience accordingly. For instance, business/marketing should not have access to some of the more technical data, and business metrics can be a distraction for IT operations personnel.
If you want to balance data-driven marketing and a privacy-minded approach to analytics, Matomo Analytics is for you. It's easy to be compliant with GDPR and other regulations while still having detailed (anonymized) analytics that help inform what content is resonating vs what content is not resonating. And of course you also get all of the rich referral, campaign, and goal conversion data to help you optimize your marketing.
The thing which Datadog does really well, one of them are its broad range of services integrations and features which makes it one step observability solution for all. We can monitor all types of our application, infrastructure, hosts, databases etc with Datadog.
Its custom dashboard feature which helps us to visualize the data in a better way . It supports different types of charts through those charts we can create our dashboard more attractive.
Its AI powered alerting capability though that we can easily identify the root cause and also it has a low noise alerting capability which means it correlated the similar type of issues.
We loved Dynatrace's ability to show the data flow - from the front end points through the back end points straight to the database and various API's. It was advanced in its data visualization. This is useful for debugging - showing when/where the errors are. It can even enable non-technical individuals in the corporation to help debug
Dynatrace has some great highly customizable integration options as well as monitoring. You can configure your layout & integration options to create custom monitoring alerts for your applications performance. Further you can increase the extensibility of using a REST API on your architecture.
Some advanced dev-ops systems are utilizing Kubernetes/docker aswell as Node.JS - Dynatrace was able to log and help understand all of our dev-ops needs. It gave us native alerts based off of deviations from the baseline that we set during initial configuration. These metrics are priceless.
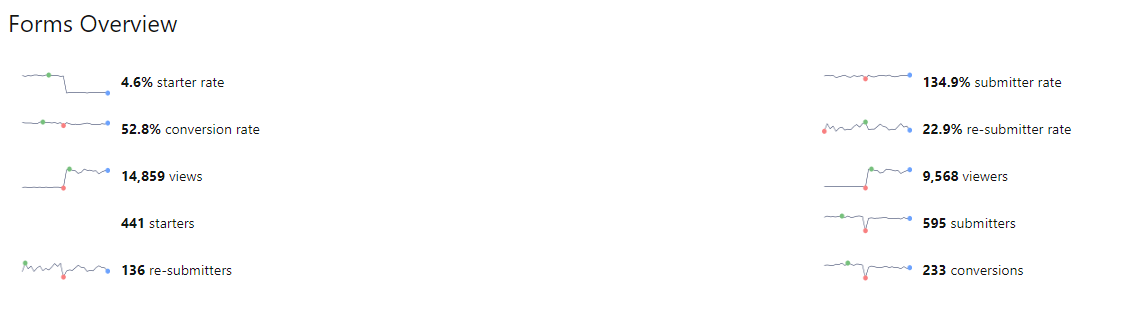
One of Piwik's strengths is the provision of customizable widgets for different bits of analytics data. The ability to add and remove them, change dates and more makes this a flexible way to visualize data.
The visitor log section is also rich, providing date, keywords, actions and more in a single table, which makes it easy to identify your most effective content.
And the visitor actions table includes both bounce rate and time on site, so you can quickly tell which pages have the most engagement.
Data display is a strength for Piwik, as you have access to overview charts while simultaneously being able to drill deeper.
Alert windows cause lag in notifications (e.g. if the alert window is X errors in 1 hour, we won't get alerted until the end of the 1 hour range)
I would appreciate more supportive examples for how to filter and view metrics in the explorer
I would like a more clear interface for metrics that are missing in a time frame, rather than only showing tags/etc. for metrics that were collected within the currently viewed time frame
Dynatrace does not monitor easily on a C-based application.
The way DPGR is addressed by Dynatrace is not very complete, and not clear. One thing is to mask the IP and request attributes but is not enough, the replay session feature is great but raises serious questions about user tracking.
From a user security standpoint it would be useful to provide users the ability to have two-factor authentication. While stats data is not necessarily sensitive in aggregate, some users may feel that certain portions need to be more secure.
It would be nice if there was a tighter integration with the Google search/referrer API so that "keyword not defined" would be replaced more often with the actual keyword that is being used to send a visitor to a site.
An easier branding method, maybe in the form of an API function set, that pulled branding URLs from a set of database fields would be great as well.
We have already renewed our purchase with the company. They make it easy for us to get a temporary license for our contingency site that is only used for testing twice a year. We are expanding our license with for this tool. We find it very useful and will renew it again.
At this point, there is not a single conceivable reason as to why we would not renew and continue to use Piwik Analytics. Especially since it is a free program and open source. The product will only get better over time as more people look into it and donate to cause so that development can continue.
There are so many features that it can be hard to figure out where you need to go for your own use case. For example, RUM monitoring us buried in a "Digital Experience" sidebar setting when this is one of our key use cases that I sometimes struggle to find in the application. It appears that ECS + Fargate monitoring was recently released which is great because we had to build a lambda reporting solution for ephemeral task monitoring. But this new feature was never on my radar until I starting clicking around the application.
Dynatrace is great to use once you understand how to use it correctly and get used to the layout of it. While I do not actively use it every day, whenever I do use it, I do have to get refamiliarized with it. However, once you have your dashboards setup correctly with the data that you want to see when you first login to Dynatrace, it's amazing.
Piwik succeeds in presenting me (and my associates and my clients...) large amounts of data in a user friendly way. The interface and functionality can easily be customized. While some enhancements do need technical background (API calls by programming language from the webserver or javascript), others are easy to use (goal / event tracking)
The support team usually gets it right. We did have a rather complicate issue setting up monitoring on a domain controller. However, they are usually responsive and helpful over chat. The downside would be I don’t think they have any phone support. If that is important to you this might not be a good fit.
Given that Dynatrace has become an informal industry standard, the plethora of information available on forums is massive. Most problems or roadblocks you come across are most likely (almost certainly, in fact) already solved and solutions available on these forums. The tech support at Dynatrace is also quite good, with prompt and knowledgeable people at their end.
The best thing about the Matomo support is that they have a forum which basically you can find the answer to almost all of your questions and most of the time you don't need to contact them regarding your questions and problems but if you need help they will answer in a reasonable time slots.
Our logs are very important, and Datadog manages them exceptionally well. We frequently use Datadog services for our investigations. Use case: Monitor your apps, infrastructure, APIs, and user experience.
Key features:
Logs, metrics, and APM (Application Performance Monitoring)
Real-time alerting and dashboards
Supports Kubernetes, AWS, GCP, and other integrations
RUM (Real User Monitoring) and Synthetics
✅ Best for backend, server, and distributed systems monitoring.
Synthetic Monitoring automatically does what other products do only through the use of other tools or through the development of user applications that still have a high cost of maintenance. The other products are not immediately usable and require many customizations. Through the use of configuration automatisms, you can be immediately operational and, in our case, we detected several imperfections in the applications.
It is much more robust out of the box, easier to set up and more intuitive to use. The reports are set up already and it requires little to no setup after installation to start gathering insights.