ConnectWise PSA (formerly Manage) is a business management platform for companies that sell, service, and support technology. The platform is cloud-based and integrates automation, help desk and customer service, sales, marketing, project management, and business analytics. It is the hub of the ConnectWise suite.
$35
Per Tech Per Month
Tableau Cloud
Score 7.9 out of 10
N/A
Tableau Cloud (formerly Tableau Online) is a self-service analytics platform that is fully hosted in the cloud. Tableau Cloud enables users to publish dashboards and invite colleagues to explore hidden opportunities with interactive visualizations and accurate data, from any browser or mobile device.
$15
per month per user
Tableau Desktop
Score 8.4 out of 10
N/A
Tableau Desktop is a data visualization product from Tableau. It connects to a variety of data sources for combining disparate data sources without coding. It provides tools for discovering patterns and insights, data calculations, forecasts, and statistical summaries and visual storytelling.
$1,380
per year (purchased via a Creator license)
Pricing
ConnectWise PSA
Tableau Cloud
Tableau Desktop
Editions & Modules
Subscription
$35.00
Per Tech Per Month
Tableau Viewer
$15
per month billed annually per user
Enterprise Viewer
$35
per month billed annually per user
Tableau Explorer
$42
per month billed annually per user
Enterprise Explorer
$70
per month billed annually per user
Tableau Creator
$75
per month billed annually per user
Enterprise Creator
$115
per month billed annually per user
Tableau+
Contact Sales
Tableau Creator License
$115
per month (billed annually) per user
Offerings
Pricing Offerings
ConnectWise PSA
Tableau Cloud
Tableau Desktop
Free Trial
No
No
No
Free/Freemium Version
No
No
Yes
Premium Consulting/Integration Services
No
No
Yes
Entry-level Setup Fee
No setup fee
No setup fee
No setup fee
Additional Details
—
—
All pricing plans are billed annually. A Creator license includes Tableau Desktop, Tableau Prep Builder, and Tableau Pulse. Discounts sometimes available for volume.
I feel like Tableau is easier to use compared with the SAP Business Objects. Both have a bit of a learning curve but I felt that Tableau Online was still more intuitive and user friendly. Tableau Desktop is a powerhouse. It has a very steep learning curve but once you master …
Tableau Online is much simpler than other Business Intelligence tools such as SAS and SAP Lumira. While SAS allows you to create algorithms to display a set, Tableau Online provides a more friendly user interface for ease of access. Although it does not stack up too well with …
From an analyst point of view, Tableau is the most intuitive tool and it's really easy to use. It's simply the most convenient product and gives the biggest possibilities. Of course, it's more expensive and not all features are necessary for some users. I have chosen Tableau …
Tableau Online is much better at presenting and visualizing and manipulating your data. While Host Analytics is second to none in data consolidation, Tableau has much greater flexibility in exploring that data.
Tableau Desktop is great because it has much more extensive capabilities. Tableau Prep is great for ETL. It makes it easy to aggregate multiple data sources, union, clean, etc. It is easy to QA within Prep, and takes a lot of the guesswork out of troubleshooting issues with …
Like previously mentioned, Online and Desktop were eventually rolled together to be one offering the last time I checked. If you'll be sharing reports with other Tableau users then Desktop would be just fine.
Looker ended up as the winning product due to its easy to use and flexibility. It's easy for nontechnical stakeholders to learn how to create their Explores. But Tableau gives us more flexibility in creating highly customized visualizations so analysts still rely on it.
When weighing the pros and cons of Tableau Online vs. SAP ERP, two key considerations emerged as clear winners. SAP ERP is a powerful data purification tool, but it doesn't measure up to the competition in terms of data presentation. When it came to data visualization and …
Sisense offers a powerful backend database, Elasticube that integrates well with Web Service data sources. Tableau enables better visualization flexibility and functionality without having to write javascript.
Both Tableau Online and BI solutions provide visualizations. In Power BI we choose the visualization first, then drag the data into it. In Tableau, we select the data and switch between visualizations on the fly. It’s easier to jump between visualizations in Tableau. Power BI …
Verified User
Analyst
Chose Tableau Cloud
I think Tableau is better for a bigger firm with more data than MicroStrategy is. While MicroStrategy seems to be more user-friendly in terms of customization on the fly, and I find it a bit better organized - which is simply my preference of organizational style - my …
With Tableau Desktop, it's easy to create a report in the
context quickly. It allows for the seamless management of the data sources,
which is convenient for the data users. Because it is simple to use, it is
Verified User
Analyst
Chose Tableau Desktop
The online and public versions are only good for the hobbyist because they are not secure enough for most business applications. Dapresy is a marketing tool that is supposed to give executives a snapshot of marketing results. It's not very customizable and the results are …
We were interested in expedience at reasonable cost and so didn't do any sort of bakeoff, but tried Tableau first as a potential solution for moving beyond Excel for large scale data analytics. We picked it because it more than met our functional needs at a very reasonable …
Verified User
Analyst
Chose Tableau Desktop
I feel like Tableau is easier to use and offers a greater selection of visualizations. I feel that the dashboards are easier to put together and offer a great amount of flexibility for the end-user. Tableau has an excellent user support group. I find the community to be …
My current work environment uses both Tableau Online, MicroStrategy & SSRS in parallel. Tableau is much closer to the SSRS in terms of visualization tool where as MicroStrategy is an enterprise data modeling and reporting tool.
Based on the use case we use different tools. Here …
Cass evaluated Domo, QlikView and Birst prior to selecting Tableau. It came down to cost (and by a significant margin); the others have relatively high implementation, hosting and other costs. Additionally, based on a recent Gartner "Magic Quadrant", Tableau exceeds all others …
BrightGauge lets us know when we have critical issues that need solving. A massive influx of tickets all at the same time triggers an investigation. Usually, it is tied to a server going down, which we can address. It would not be helpful for a small MSP or IT department with just a few daily tickets. The stats are better used to track a large amount of clients.
If you're using Tableau as the primary BI tool, then Tableau Cloud is well suited to publish and share the results with a wide(r) audience. It is well suited for various degrees of self-service proficiency, from pure consumers of analytical work to more advanced users who can use web editing for smaller or larger adjustments, and even for desktop power users who will publish their work to Tableau Cloud. It has many good ways to organize the content and make it easily accessible via search, favorites, folders, collections ("playlists for your data"), or history ("recents"). It might not be ideally suited if there are many on-prem sources to be used (even though there are options to connect them) or if you have very special requirements regarding custom server setup, which is limited in a shared cloud environment like Tableau Cloud.
The best scenario is definitely to collect data from several sources and create dedicated dashboards for specific recipients. However, I miss the possibility of explaining these reports in more detail. Sometimes, we order a report, and after half a year, we don't remember the meaning of some data (I know it's our fault as an organization, but the tool could force better practices).
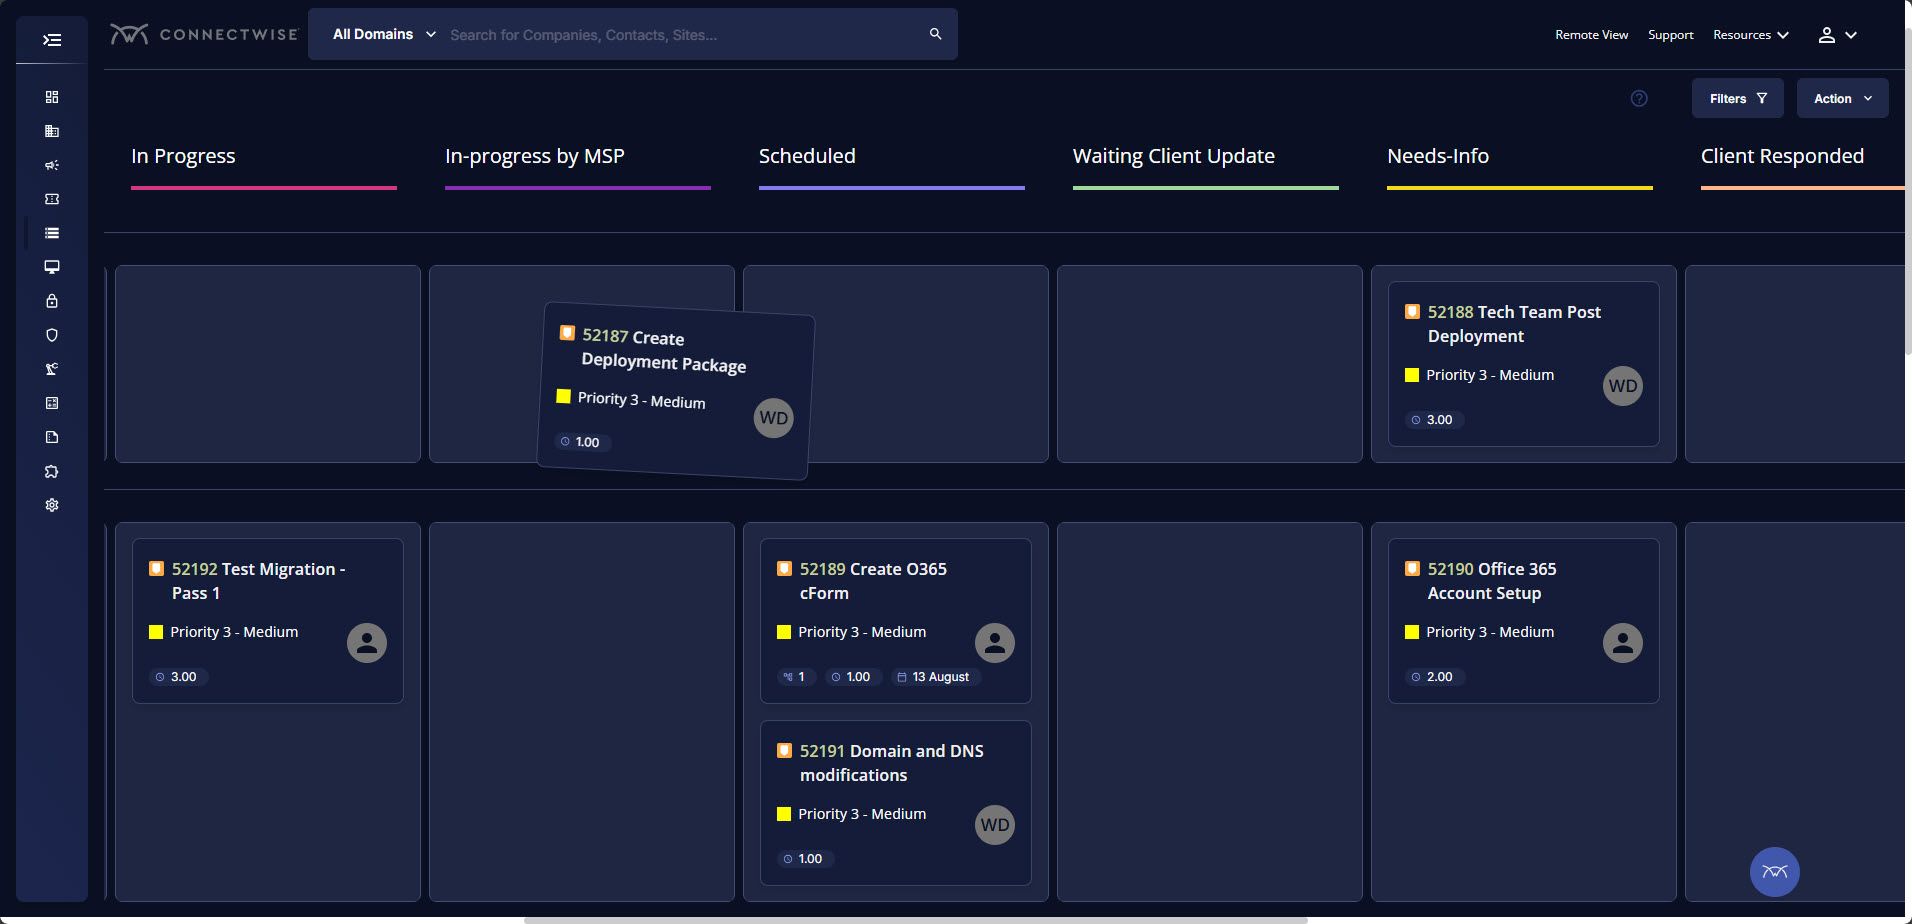
Tickets- Customers can email and a ticket is generated and falls under their profile for historical records. You can save documents and select if they are customer facing or only internal facing. The option as well to have communication in tickets whether its internal facing or customer facing is nice to have when you're trying to keep a record or important details for just internal means and the customer doesn't have to see all the jargon.
Procurement - It's great to have this integrate with Quosal Sell. Quotes being processed into opportunities and then into a sales order which connects to a ticket or project is pretty easy to use. It does have a learning curve but once you get the hang of it, it's straightforward. Everything is pretty connected, whether keeping track of products customers have purchased historically through us, to knowing what ticket is associated to an RMA.
Tableau Online is completely cloud based and that's why the reports and dashboards are accessible even on the go. One doesn't always need to access the office laptop to access the reports.
The visualizations are interactive and one can quickly change the level at which they want to view the information. For example, one person might be more interested in looking at the country level performances rather than client level. This is intuitive and one doesn't need to create multiple reports for the same.
The feature to ask questions in plain vanilla English language is great and helpful. For quick adhoc fact checks one can simply type what they are looking for and the Natural Language Programming algorithms under the hood parse the query, interpret it and then fetch the results accordingly in a visual form.
An excellent tool for data visualization, it presents information in an appealing visual format—an exceptional platform for storing and analyzing data in any size organization.
Through interactive parameters, it enables real-time interaction with the user and is easy to learn and get support from the community.
Annual or more than annualized data is desperately needed for MSPs to show trends, current limitation is previous 240 days for ConnectWise tickets
Alerts when datasets do not sync properly, I have to rely on my team to notice vs get an automated alert from BrightGauge
Small thing, but it would be nice to have more options on the report scheduler to enable a start date. If you wish to do it quarterly, you have to start the schedule exactly 3 months from the next run.
ConnectWise has uniquely positioned themselves with the Modern Office Suite to have direct integration with a nearly full suite of tools for MSPs. Although each tool may not necessarily be the absolute best tool on the market, the efficiencies leveraged through direct integration make the entire suite an obvious choice for most companies.
Our use of Tableau Desktop is still fairly low, and will continue over time. The only real concern is around cost of the licenses, and I have mentioned this to Tableau and fully expect the development of more sensible models for our industry. This will remove any impediment to expansion of our use.
I have been using ConnectWise since 2004 and I am impressed with the progress they have made. However, there are still bugs that don't work quite like they should. If I were to run reports and get consistent answers along with a couple other annoyances, then I would score CW as a 10
Based on comments from our clients, I awarded it this grade. Non-technical customers frequently compliment us on the ease with which they can utilize Tableau Online. Usability is rarely a source of contention amongst our customers. Few complaints have come from me as a user of our internal products.
Tableau Desktop has proven to be a lifesaver in many situations. Once we've completed the initial setup, it's simple to use. It has all of the features we need to quickly and efficiently synthesize our data. Tableau Desktop has advanced capabilities to improve our company's data structure and enable self-service for our employees.
We use the cloud version of ConnectWise and in the last 5 years it has never been down for us during business hours. I can only recall 1 time when it was not available during off hours when we wanted to use it.
When used as a stand-alone tool, Tableau Desktop has unlimited uptime, which is always nice. When used in conjunction with Tableau Server, this tool has as much uptime as your server admins are willing to give it. All in all, I've never had an issue with Tableau's availability.
Some tab for certain areas load speeds could be better. Dashboards can load slowly when they reference multiple reports. Some reports can load slowly based on the tables and views they are accessing. At times the SQL queries being performed in the background can actually timeout and a tab or screen will fail to load.
Tableau Desktop's performance is solid. You can really dig into a large dataset in the form of a spreadsheet, and it exhibits similarly good performance when accessing a moderately sized Oracle database. I noticed that with Tableau Desktop 9.3, the performance using a spreadsheet started to slow around 75K rows by about 60 columns. This was easily remedied by creating an extract and pushing it to Tableau Server, where performance went to lightning fast
The front line support techs are wildly inconsistent when it comes to the level of support. Sometimes you get someone who just wants to throw links to University documentation at you, sometimes you get someone who truly tries to understand your issue and confers with peers and managers to find an answer, and sometimes you get someone who just wants to create a ticket and escalate immediately. If you ask three different techs the same question you will probably get three different answers, one of them being, "That's not possible."
I have not had any issues that require customer support from Tableau at this time, which speaks well to Tableau. I have taken an online course with Tableau and it was very professional and well done, so based on that I would assume a similar level of quality for their customer service.
Tableau support has been extremely responsive and willing to help with all of our requests. They have assisted with creating advanced analysis and many different types of custom icons, data formatting, formulas, and actions embedded into graphs. Tableau offers a weekly presentation of features and assists with internal company projects.
It is admittedly hard to train a group of people with disparate levels of ability coming in, but the software is so easy to use that this is not a huge problem; anyone who can follow simple instructions can catch up pretty quickly.
We are a telecoms company. Whilst CW were very happy to sell us their product and tell us how good it is for telecoms. All the training material is geared towards IT MSP's. The on-line training material was virtually useless. We found the implementation a bit of a joke. They tried telling us 12 hours of implementation time would be sufficient to launch the product. We erred on the side of caution and paid for 24 hours. This was quickly eaten away and we were nowhere near ready to go-live. I find the on-line chat facility is of much more use for us.
I think the training was good overall, but it was maybe stating the obvious things that a tech savvy young engineer would be able to pick up themselves too. However, the example work books were good and Tableau web community has helped me with many problems
Rather than letting them sell you a block of time for implementation, create a list of things that must be completed do declare the implementation complete. The implementer will have the discretion on what they set up and in what order. They will be trying to end their services in as little time as possible and may not get things set up right. You are best advised to hire a third-party wizard that has done many of these setups. Record the audio and video of all of your implementation sessions.
Again, training is the key and the company provides a lot of example videos that will help users discover use cases that will greatly assist their creation of original visualizations. As with any new software tool, productivity will decline for a period. In the case of Tableau, the decline period is short and the later gains are well worth it.
Everyone but dynamics had holes in it. Dynamics is good, but it requires more development time. I spoke with some people that have CW and liked it. But when I inquired after our frustrations, I discovered they had a full time scheduling & logistics CW manager and the field people were using it purely like any other more simplistic ticket system. They said it would be impossible otherwise. The one big difference is the transparency of the sales effort. The other sales people were honest on the limitations or potential challenges and worked with us. They also worked with our agenda. At CW they don't have that option. The consulting time is eaten through a pre-formatted agenda which they communicate too you, not with you.
In determining whether to go with Tableau Online versus Alteryx, two important factors stood out in determining our go-to solution. First, while Alteryx is an impressive tool for data cleansing, it did not stack up in terms of data visualization capabilities. Tableau, on the other hand, provided us everything we needed in terms of visualizing our data and analytics. The second factor is cost. Well neither solution would be considered cheap, Tableau was the more cost effective solution for our needs.
I have used Power BI as well, the pricing is better, and also training costs or certifications are not that high. Since there is python integration in Power BI where I can use data cleaning and visualizing libraries and also some machine learning models. I can import my python scripts and create a visualization on processed data.
ConnectWise seems to have a good understanding of the IT service industry. During the required onboarding training, they even preach configuring only features that you need right now, as you can always scale up later. The feature set for the most part takes into considerations all aspects of an IT business, whether small or enterprise, or growing from one to the next.
Tableau Desktop's scaleability is really limited to the scale of your back-end data systems. If you want to pull down an extract and work quickly in-memory, in my application it scaled to a few tens of millions of rows using the in-memory engine. But it's really only limited by your back-end data store if you have or are willing to invest in an optimized SQL store or purpose-built query engine like Veritca or Netezza or something similar.
Tableau was acquired years ago, and has provided good value with the content created.
Ongoing maintenance costs for the platform, both to maintain desktop and server licensing has made the continuing value questionable when compared to other offerings in the marketplace.
Users have largely been satisfied with the content, but not with the overall performance. This is due to a combination of factors including the performance of the Tableau engines as well as development deficiencies.