Chose Microsoft Power BI
Just because we wanted single-party integration environment and a player which can take ownership of Big Data Analysis. Microsoft Power BI is better in these features as compared to other key BI players like Tableau.
| Product | Rating | Most Used By | Product Summary | Starting Price |
|---|---|---|---|---|
 Microsoft Power BI | N/A | Microsoft Power BI is a visualization and data discovery tool from Microsoft. It allows users to convert data into visuals and graphics, visually explore and analyze data, collaborate on interactive dashboards and reports, and scale across their organization with built-in governance and security. | $10 per month per user | |
 SnapLogic | N/A | SnapLogic is a cloud integration platform with a self-service capacity supported by over 450 prebuilt modifiable connectors. SnapLogic also offers real-time and batch integration processes for interfacing with external data sources, a drag-and-drop interface, and use of the vendors’ Iris AI. | N/A | |
 Tableau Desktop | N/A | Tableau Desktop is a data visualization product from Tableau. It connects to a variety of data sources for combining disparate data sources without coding. It provides tools for discovering patterns and insights, data calculations, forecasts, and statistical summaries and visual storytelling. | $75 per month |
| Microsoft Power BI | SnapLogic | Tableau Desktop | ||||||||||||||||||||||
|---|---|---|---|---|---|---|---|---|---|---|---|---|---|---|---|---|---|---|---|---|---|---|---|---|
| Editions & Modules | No answers on this topic | No answers on this topic |
| |||||||||||||||||||||
| Offerings |
| |||||||||||||||||||||||
| Entry-level Setup Fee | No setup fee | Optional | No setup fee | |||||||||||||||||||||
| Additional Details | — | — | All pricing plans are billed annually. | |||||||||||||||||||||
| More Pricing Information | ||||||||||||||||||||||||
| Microsoft Power BI | SnapLogic | Tableau Desktop | |
|---|---|---|---|
| Considered Multiple Products | Microsoft Power BI  David Jensen Operations Manager, Customer Success Chose Microsoft Power BI Microsoft Power BI excels against its competition in being a great combination between feature set and scalability. Tableau is more integrated with Salesforce but it has a high starting price point whereas Microsoft Power BI can start out with a single license for less than $20 …  Matt Aldridge Learning Analytics Lead Chose Microsoft Power BI Power BI is much simple to use, and more modern than BusinessObjects, which has now been discontinued. It costs much less to license than Tableau which is perhaps more niche and designed better. It is also much more powerful for data analysis than excel, Smartsheet, Airtable, …  Edson Pinheiro Data Engineer Chose Microsoft Power BI Much more instinctive  Mohamed Adil Shaikh Process Data Engineer Chose Microsoft Power BI For Visualization and Reporting Power BI is way ahead of MS Excel, not only it has the functionality of MS Excel for cleaning and processing of data in the advance Query tab but also the add-on of more eye appealing and customizable Visualizations. MS Excel is more focused on … |  SnapLogic  Jacob Rasmussen Data Engineer Chose SnapLogic SnapLogic was a lot cheaper and does not have as steep of a learning curve |  Tableau Desktop  Afia Tamanna Information Technology Business Consultant Chose Tableau Desktop Tableau Desktop is preferred over other BI software because it allows for more data visualization, storytelling, and dashboards. Microsoft Power BI may be a better option if you need to perform data modeling, however. Tableau Desktop is an excellent tool for nearly all other …  Manidipa Kundu Data Analyst Chose Tableau Desktop Both power bi and Tableau Desktop has its own pros and cons. Microsoft Power BI is best to work with Microsoft products. however for fast connection with diverse range of integration with data sources Tableau Desktop is best. if you are cost sensitive power bi is best option …  Liz Brandon Sr Manager Performance Analytics Chose Tableau Desktop Tableau Desktop has a more easy to use drag and drop interface and is easier to learn. It also allows greater customization of charts than Power BI. However, Tableau Desktop costs more than Power BI which is bundled into our Microsoft contract at no additional charge. Power BI …  Amanda McCombs Director Client Operations & Analysis Chose Tableau Desktop The visualizations are far and away more powerful and it is more user friendly than Power BI. It would take 3-4 times as long to create the types of reports in Excel that I can create in Tableau Desktop and there are a slew of ways I can present the data in Tableau Desktop that …  Shubham Tiwari Data analyst Chose Tableau Desktop Tableau can create visually attractive customizable dashboards than can quickly by drag-drop while in power bi we can create simple dashboard. Power bi support lesser data source while in Tableau there is a lot of options When we talk about data handling tableau is a clear …  Tohidul Islam Information Technology Team Lead Chose Tableau Desktop With Tableau Desktop, it's easy to create a report in the
context quickly. It allows for the seamless management of the data sources,
which is convenient for the data users. Because it is simple to use, it is  Orin Mamun Junior Frontend Developer Chose Tableau Desktop For complex data visualization, Tableau Desktop shines. Even though it uses highly granular databases, it has a powerful engine that can process large amounts of data quickly and produce high-quality charts. It has the broadest range of APIs and is extremely simple. The …  Jason Guinn Chief Financial Officer Chose Tableau Desktop Tableau hands-down wins based upon functionality, interoperability with a wide variety of enterprise-class data connections, end-user support, and quality of visualizations. Tableau Desktop offers a substantially more robust, refined, and mature product. It became quickly …  Akhilesh Arya Assistant Professor Chose Tableau Desktop We shifted to Tableau as it performs better than power BI. Tableau can handle data from multiple data sources while Power BI is restricted to limited data sources.  Karan Gupta Sr. Associate - Marketing Analytics Chose Tableau Desktop I use both in my Organisation. Both of them have advantages and disadvantages. I prefer Tableau [Desktop] as it provides larger options to play around with the data. Power BI has an advantages that it connects well with the MS application where Tableau lacks. |
| Microsoft Power BI | SnapLogic | Tableau Desktop | |||||||||||||||||||||||||||
|---|---|---|---|---|---|---|---|---|---|---|---|---|---|---|---|---|---|---|---|---|---|---|---|---|---|---|---|---|---|
| BI Standard Reporting |
| ||||||||||||||||||||||||||||
| Ad-hoc Reporting |
| ||||||||||||||||||||||||||||
| Report Output and Scheduling |
| ||||||||||||||||||||||||||||
| Data Discovery and Visualization |
| ||||||||||||||||||||||||||||
| Access Control and Security |
| ||||||||||||||||||||||||||||
| Mobile Capabilities |
| ||||||||||||||||||||||||||||
| Application Program Interfaces (APIs) / Embedding |
| ||||||||||||||||||||||||||||
| Cloud Data Integration |
|
| Microsoft Power BI | SnapLogic | Tableau Desktop | |
|---|---|---|---|
| Small Businesses |  Yellowfin Score 8.7 out of 10 |  Make Score 9.3 out of 10 | Yellowfin Score 8.7 out of 10 |
| Medium-sized Companies |  Reveal Score 10.0 out of 10 |  IBM App Connect Score 9.2 out of 10 | Reveal Score 10.0 out of 10 |
| Enterprises |  Kyvos Semantic Layer Score 9.5 out of 10 | IBM App Connect Score 9.2 out of 10 | Kyvos Semantic Layer Score 9.5 out of 10 |
| All Alternatives | View all alternatives | View all alternatives | View all alternatives |
| Microsoft Power BI | SnapLogic | Tableau Desktop | |
|---|---|---|---|
| Likelihood to Recommend | 8.5 (197 ratings) | 8.1 (24 ratings) | 8.8 (203 ratings) |
| Likelihood to Renew | 9.5 (3 ratings) | 9.0 (2 ratings) | 7.5 (41 ratings) |
| Usability | 8.3 (113 ratings) | 7.0 (1 ratings) | 8.3 (73 ratings) |
| Availability | - (0 ratings) | - (0 ratings) | 10.0 (11 ratings) |
| Performance | - (0 ratings) | - (0 ratings) | 8.0 (10 ratings) |
| Support Rating | 10.0 (52 ratings) | 8.5 (4 ratings) | 1.0 (57 ratings) |
| In-Person Training | - (0 ratings) | - (0 ratings) | 9.4 (4 ratings) |
| Online Training | - (0 ratings) | - (0 ratings) | 8.0 (5 ratings) |
| Implementation Rating | 9.0 (1 ratings) | 9.0 (1 ratings) | 8.0 (34 ratings) |
| Configurability | - (0 ratings) | - (0 ratings) | 7.0 (3 ratings) |
| Ease of integration | - (0 ratings) | - (0 ratings) | 10.0 (1 ratings) |
| Product Scalability | - (0 ratings) | - (0 ratings) | 9.0 (4 ratings) |
| Vendor post-sale | - (0 ratings) | - (0 ratings) | 10.0 (1 ratings) |
| Vendor pre-sale | - (0 ratings) | - (0 ratings) | 10.0 (1 ratings) |
| Microsoft Power BI | SnapLogic | Tableau Desktop | |
|---|---|---|---|
| Likelihood to Recommend | Microsoft
| Snaplogic
| Tableau
 Karol Kozłowski Project manager |
| Pros | Microsoft
| Snaplogic
| Tableau
Afia Tamanna Information Technology Business Consultant |
| Cons | Microsoft
| Snaplogic
| Tableau
|
| Likelihood to Renew | Microsoft
David Jensen Operations Manager, Customer Success | Snaplogic
 Tony Kowalick Assistant Director of Enterprise Systems | Tableau
|
| Usability | Microsoft
| Snaplogic
Jacob Rasmussen Data Engineer | Tableau
 Al Mubassir Muin Software Engineer |
| Reliability and Availability | Microsoft No answers on this topic | Snaplogic No answers on this topic | Tableau
 Brad Llewellyn Associate Data Analytics Consultant |
| Performance | Microsoft No answers on this topic | Snaplogic No answers on this topic | Tableau
|
| Support Rating | Microsoft
| Snaplogic
| Tableau
|
| In-Person Training | Microsoft No answers on this topic | Snaplogic No answers on this topic | Tableau
 Jon Boeckenstedt Associate Vice President |
| Online Training | Microsoft No answers on this topic | Snaplogic No answers on this topic | Tableau
|
| Implementation Rating | Microsoft
 Anuj Sant Technical Supply chain professional Senior buyer | Snaplogic
Jacob Rasmussen Data Engineer | Tableau
 David Fickes Decision Sciences - Modeling, Simulation & Analysis |
| Alternatives Considered | Microsoft
| Snaplogic
| Tableau
|
| Scalability | Microsoft No answers on this topic | Snaplogic No answers on this topic | Tableau
|
| Return on Investment | Microsoft
| Snaplogic
| Tableau
|
| ScreenShots | Microsoft Power BI Screenshots      | SnapLogic Screenshots  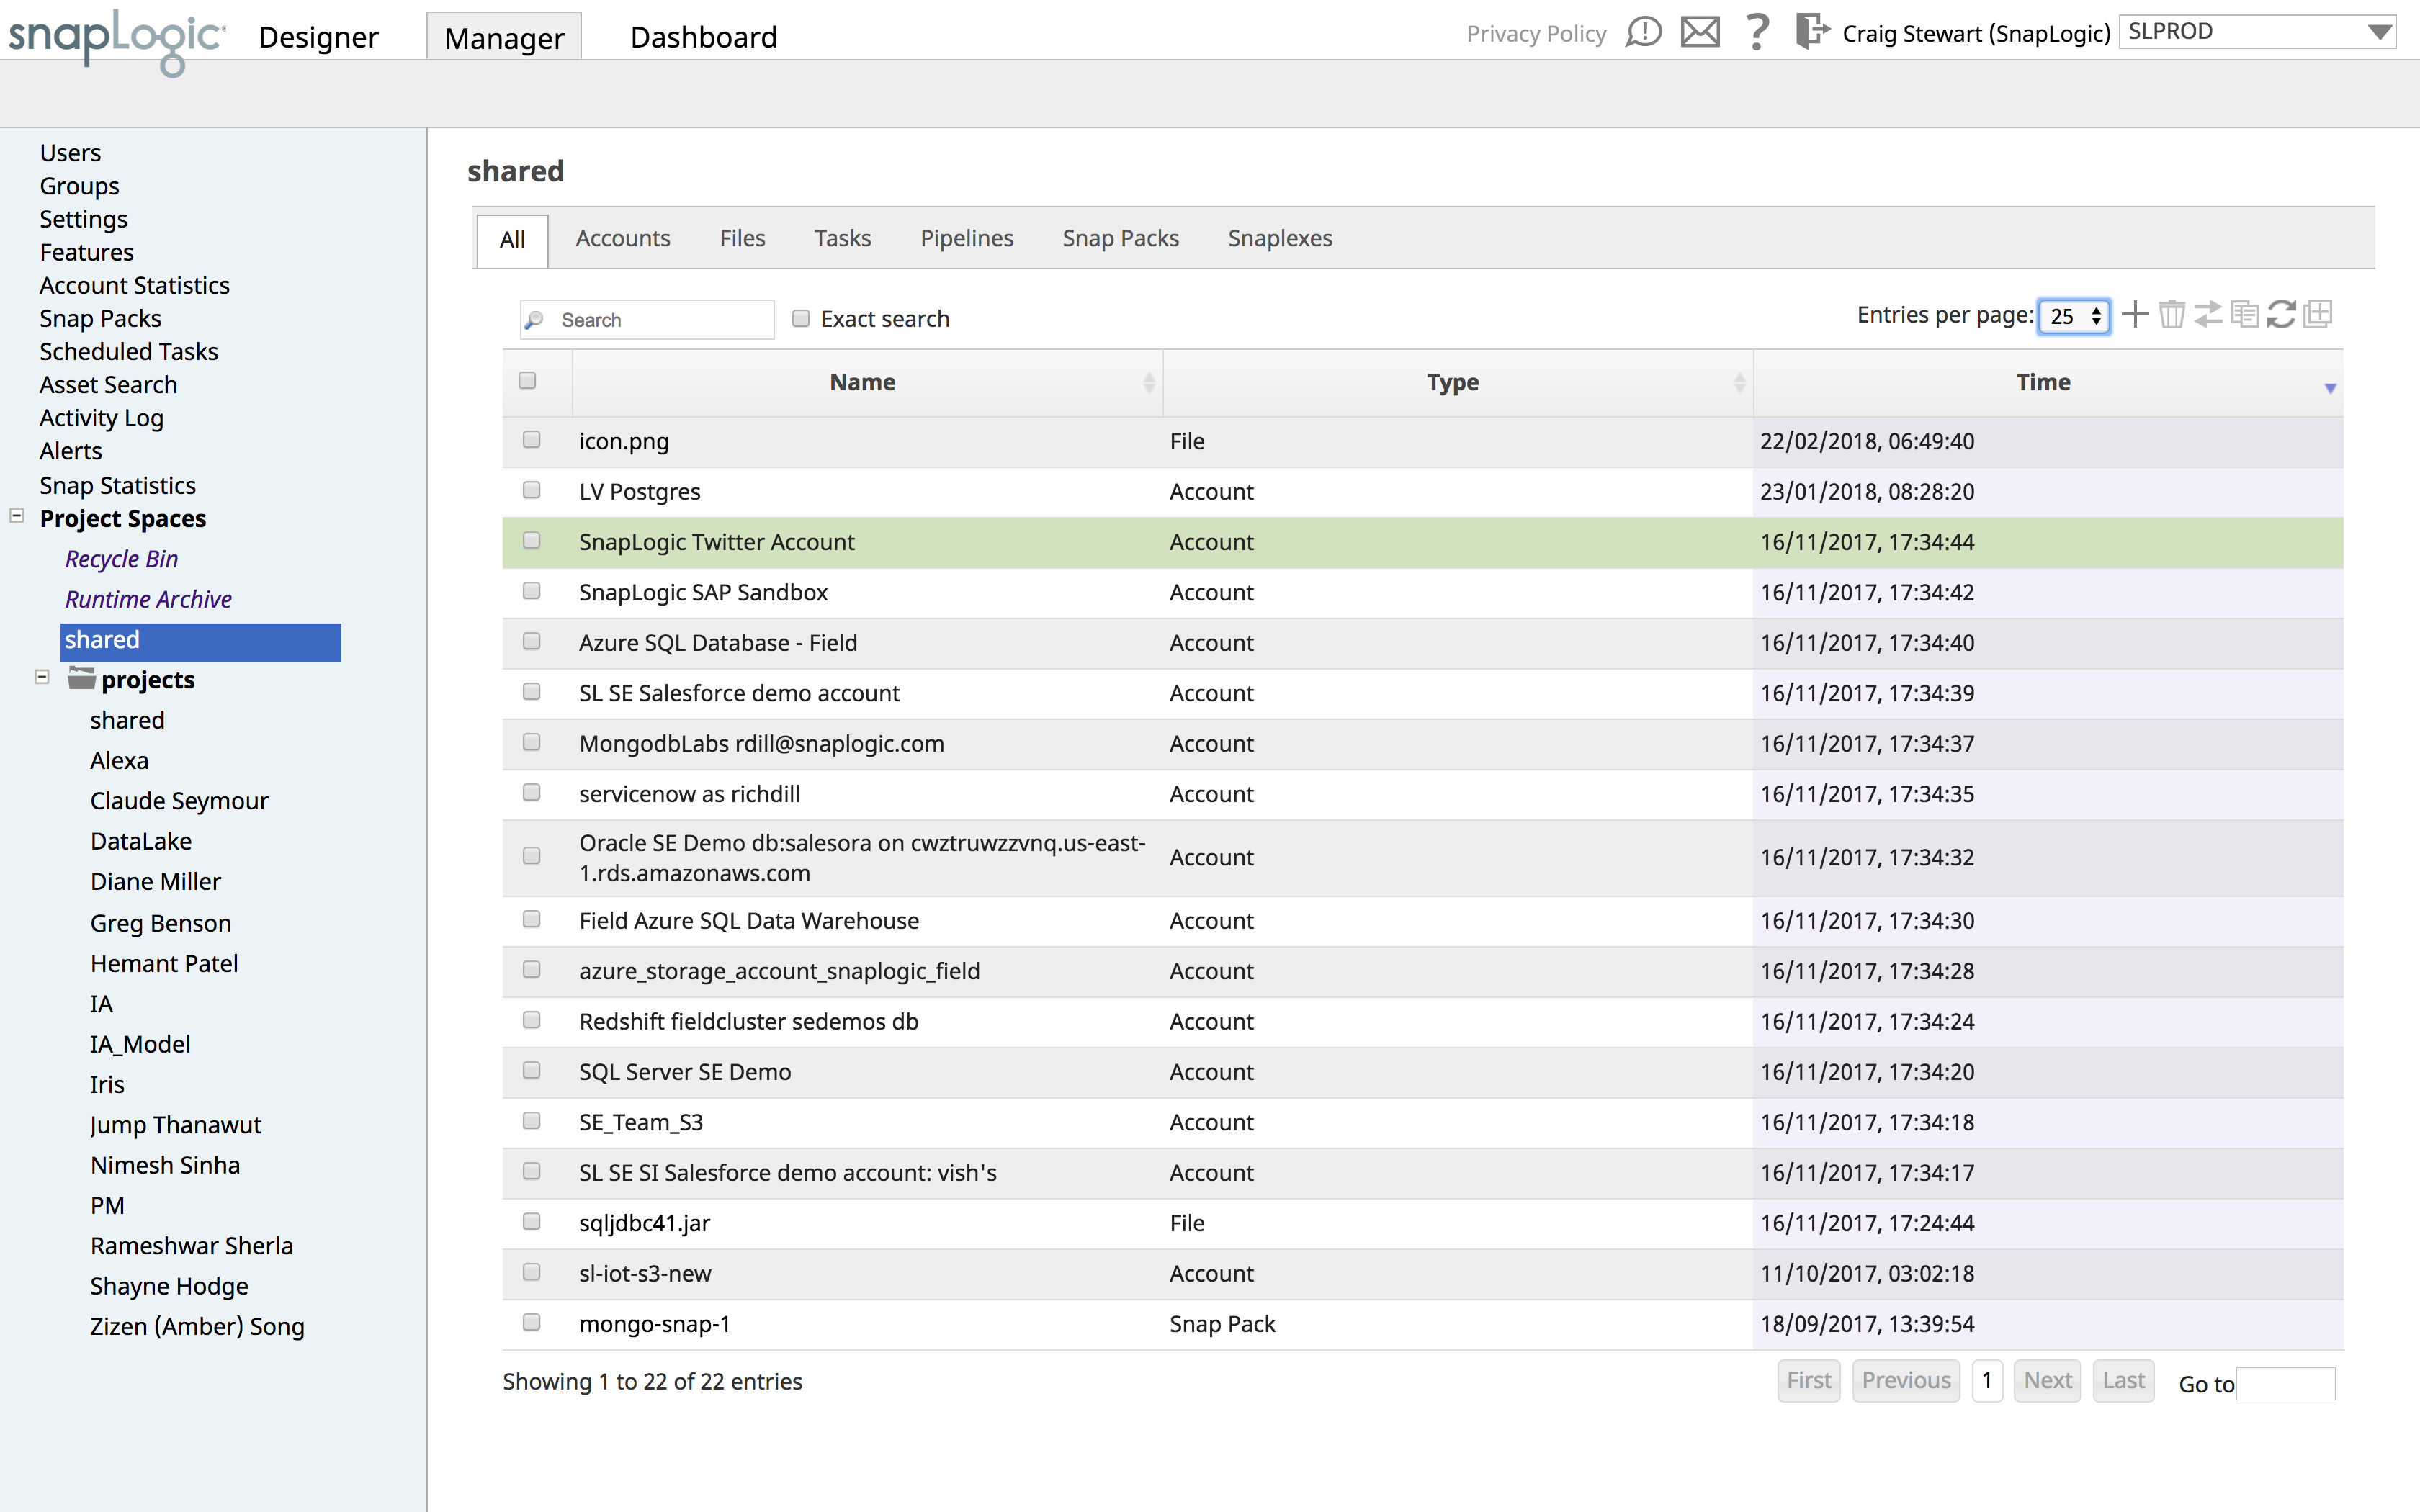 |