TrustRadius
OneStream

OneStream

Overview

What is OneStream?

OneStream is an enterprise finance platform that unifies financial and operational data, embeds AI for better decisions and productivity, and can extend to meet the evolving needs of businesses without adding technical debt. Presented as an operating system for modern…

Read more
Recent Reviews

OneStream Review

8 out of 10
March 30, 2024
Incentivized
We're in the middle of implementing OneStream for Global Financial Close and Consolidation module as well as Task Manager. We're currently …
Continue reading

The Future of EPM is here!

10 out of 10
March 30, 2024
As a OneStream Diamond Partner, we work with a number of companies who present us with various issues associated with their close or …
Continue reading

OneStream Rocks

10 out of 10
March 30, 2024
OneStream is our financial reporting for the Magnet Wire Northa American Business Unit. Forecasting & Budgeting was time consuming. …
Continue reading

OneStream

10 out of 10
March 30, 2024
OneStream has been a complete game changer for our organization. We were able to move away from very large and complicated excel based …
Continue reading

OneStream Review

10 out of 10
March 29, 2024
OneStream is our global consolidation and budgeting/planning solution. It facilitates a singular environment to enable teams across 50 …
Continue reading

OneStream Review

10 out of 10
March 29, 2024
I have implemented OneStream for many organizations, some small and some large. I have found OneStream to be highly flexible and the …
Continue reading

TrustRadius Insights

OneStream is a versatile software solution that has been utilized by multinational electronics manufacturers, allowing them to streamline …
Continue reading
Read all reviews

Awards

Products that are considered exceptional by their customers based on a variety of criteria win TrustRadius awards. Learn more about the types of TrustRadius awards to make the best purchase decision. More about TrustRadius Awards

Popular Features

View all 46 features
  • Financial data consolidation (44)
    9.5
    95%
  • Financial Statement Reporting (44)
    9.2
    92%
  • Management reporting (44)
    9.1
    91%
  • Management Reporting (44)
    8.9
    89%

Reviewer Pros & Cons

View all pros & cons
Return to navigation

Pricing

View all pricing
N/A
Unavailable

What is OneStream?

OneStream is an enterprise finance platform that unifies financial and operational data, embeds AI for better decisions and productivity, and can extend to meet the evolving needs of businesses without adding technical debt. Presented as an operating system for modern Finance, it…

Entry-level set up fee?

  • Setup fee required
For the latest information on pricing, visithttps://hubs.li/H0MLW9X0

Offerings

  • Free Trial
  • Free/Freemium Version
  • Premium Consulting/Integration Services

Would you like us to let the vendor know that you want pricing?

52 people also want pricing

Alternatives Pricing

What is Budgyt?

Budgyt is a platform made to simplify business budgeting. With built-in functions designed for data integrity, team collaboration, and scenario planning & analysis, Budgyt is presented as an optimized budgeting experience that rids users of complex, error-prone spreadsheets and the time-consuming…

What is PlanGuru?

PlanGuru is budgeting, forecasting and financial analytics software for SMB's, Nonprofits and the Accountants/ Advisors that work with them.

Return to navigation

Product Demos

OneStream Live Lifetime Deal and Product Tutorial or Demo ( Christmas New year 2023 Special Offer)

YouTube

Live with OneStream

YouTube

OneStream - A New Way To Share Your Content | OneStream Tutorial | OneStream Demo

YouTube

OneStream Studio Updates

YouTube

OneStream Demo

YouTube

OneStream Live Review & Demo: Live Stream Pre-Recorded Videos on 40+ Platforms [AppSumo Deal]

YouTube
Return to navigation

Features

BI Standard Reporting

Standard reporting means pre-built or canned reports available to users without having to create them.

8.6
Avg 8.0

Ad-hoc Reporting

Ad-Hoc Reports are reports built by the user to meet highly specific requirements.

7.6
Avg 8.3

Report Output and Scheduling

Ability to schedule and manager report output.

8.7
Avg 8.2

Data Discovery and Visualization

Data Discovery and Visualization is the analysis of multiple data sources in a search for patterns and outliers and the ability to represent the data visually.

7.7
Avg 7.6

Access Control and Security

Access control means being able to determine who has access to which data.

8.9
Avg 8.7

Mobile Capabilities

Support for mobile devices like smartphones and tablets.

6.7
Avg 8.0

Budgeting, Planning, and Forecasting

These activities are designed to assist with both data-driven operational, short-term planning and strategic long term planning

8.3
Avg 8.3

Consolidation and Close

Consolidation of data from multiple entities with currency management, reporting and audit trails.

8.9
Avg 8.0

Financial Reporting and Compliance

Financial statements and regulatory filings

8.6
Avg 8.2

Analytics and Reporting

Dashboards and scorecards for KPI monitoring and benchmarking

8.6
Avg 8.0

Integration

Ability to integrate with external applications.

9.1
Avg 8.3
Return to navigation

Product Details

What is OneStream?

OneStream is an enterprise finance platform that unifies financial and operational data, embeds AI for better decisions and productivity, and can extend to meet the evolving needs of businesses without adding technical debt.

Presented as an operating system for modern Finance, it unifies core financial functions and empowering the CFO to become a critical driver of business strategy, innovation, and growth. It is a cloud-based platform that modernizes the Office of the CFO. The Digital Finance Cloud unifies key financial and operational data and processes, embeds AI for faster and better planning and forecasting, and is extensible so customers can add new utility and achieve more value as their business needs evolve.

OneStream is an independent software company backed by private equity investors KKR, Tidemark, Partners Fund Capital and Alkeon Capital Management. Their operating system for modern Finance digitizes core financial functions to empower the CFO to become a critical driver of business strategy.

OneStream Features

Budgeting, Planning, and Forecasting Features

  • Supported: Long-term financial planning
  • Supported: Financial budgeting
  • Supported: Forecasting
  • Supported: Scenario modeling
  • Supported: Management reporting

Consolidation and Close Features

  • Supported: Financial data consolidation
  • Supported: Journal entries and reports
  • Supported: Multi-currency management
  • Supported: Intercompany Eliminations
  • Supported: Minority Ownership
  • Supported: Local and consolidated reporting
  • Supported: Detailed Audit Trails

Financial Reporting and Compliance Features

  • Supported: Financial Statement Reporting
  • Supported: Management Reporting
  • Supported: Excel-based Reporting
  • Supported: Automated board and financial reporting

Analytics and Reporting Features

  • Supported: Personalized dashboards
  • Supported: Color-coded scorecards
  • Supported: KPIs
  • Supported: Cost and profitability analysis
  • Supported: Key Performance Indicator setting
  • Supported: Benchmarking with external data

Integration Features

  • Supported: Flat file integration
  • Supported: Excel data integration
  • Supported: Direct links to 3rd-party data sources

BI Standard Reporting Features

  • Supported: Pixel Perfect reports
  • Supported: Customizable dashboards
  • Supported: Report Formatting Templates

Ad-hoc Reporting Features

  • Supported: Drill-down analysis
  • Supported: Formatting capabilities
  • Supported: Predictive modeling
  • Supported: Report sharing and collaboration

Report Output and Scheduling Features

  • Supported: Publish to Web
  • Supported: Publish to PDF
  • Supported: Report Versioning
  • Supported: Report Delivery Scheduling

Data Discovery and Visualization Features

  • Supported: Pre-built visualization formats (heatmaps, scatter plots etc.)
  • Supported: Location Analytics / Geographic Visualization
  • Supported: Predictive Analytics
  • Supported: Support for Machine Learning models

Access Control and Security Features

  • Supported: Multi-User Support (named login)
  • Supported: Role-Based Security Model
  • Supported: Multiple Access Permission Levels (Create, Read, Delete)
  • Supported: Report-Level Access Control
  • Supported: Table-Level Access Control (BI-layer)
  • Supported: Field-Level Access Control (BI-layer)
  • Supported: Single Sign-On (SSO)

Mobile Capabilities Features

  • Supported: Responsive Design for Web Access
  • Supported: Dashboard / Report / Visualization Interactivity on Mobile

Additional Features

  • Supported: Account Reconciliations
  • Supported: Disclosure Management
  • Supported: Transaction Matching
  • Supported: People Planning
  • Supported: Capital Planning
  • Supported: Sales Planning
  • Supported: Profitability Analysis

OneStream Screenshots

Screenshot of OneStream DashboardScreenshot of Profitability AnalysisScreenshot of Product and Customer ProfitabilityScreenshot of Account ReconciliationsScreenshot of Cash PlanningScreenshot of Financial SignalingScreenshot of Task ManagementScreenshot of Predictive Analytics

OneStream Video

OneStream Software | Company Overview

OneStream Technical Details

Deployment TypesOn-premise, Software as a Service (SaaS), Cloud, or Web-Based
Operating SystemsWindows
Mobile ApplicationApple iOS, Android, Windows Phone, Blackberry, Mobile Web
Supported CountriesAmericas, EMEA, South Africa, APAC

Frequently Asked Questions

Reviewers rate Flat file integration highest, with a score of 9.7.

The most common users of OneStream are from Enterprises (1,001+ employees).

OneStream Customer Size Distribution

Consumers0%
Small Businesses (1-50 employees)0%
Mid-Size Companies (51-500 employees)0%
Enterprises (more than 500 employees)100%
Return to navigation

Comparisons

View all alternatives
Return to navigation

Reviews and Ratings

(70)

Community Insights

TrustRadius Insights are summaries of user sentiment data from TrustRadius reviews and, when necessary, 3rd-party data sources. Have feedback on this content? Let us know!

OneStream is a versatile software solution that has been utilized by multinational electronics manufacturers, allowing them to streamline their Balance Sheet Accounts Reconciliation Process. With over 1500 users and 50,000 accounts, OneStream has effectively addressed the challenges associated with the previous manual approach, including disintegrated processes, lack of standardization, and a consolidated list of action items. This software also serves as a budgeting and forecasting solution, enabling better tracking of utilization, billing rates, customer work, and financial impact. By loading data weekly and providing clear visualization of time allocation across customers and resources, OneStream facilitates informed decision-making and analysis capabilities for senior management through monthly reports. The software's continuous improvement through regular feature updates sets it apart from competitors in terms of functionality. CEOs and executives find OneStream valuable in gaining a comprehensive understanding of various fields such as accounting, sales, and collections, leading to quicker and more efficient decision-making. Moreover, OneStream's versatility extends beyond finance and accounting departments with its detailed reporting capabilities that cater to operational needs while also offering marketplace solutions for other business problems. With its scalability and ability to handle growth, OneStream proves to be an invaluable tool for companies of varying sizes and industries including manufacturing, oil & gas, healthcare, and retail. By reducing cycle times and serving as a single source of truth for financial planning and people planning, it saves customers time and money on a monthly basis.

Time-saving Account Reconciliation: Several users have found OneStream's Account Reconciliation solution to be a significant time-saver compared to navigating through spreadsheets. They appreciate being able to see an overview of their reconciliations, which allows them to consolidate data from integrated source systems at a detailed transactional level.

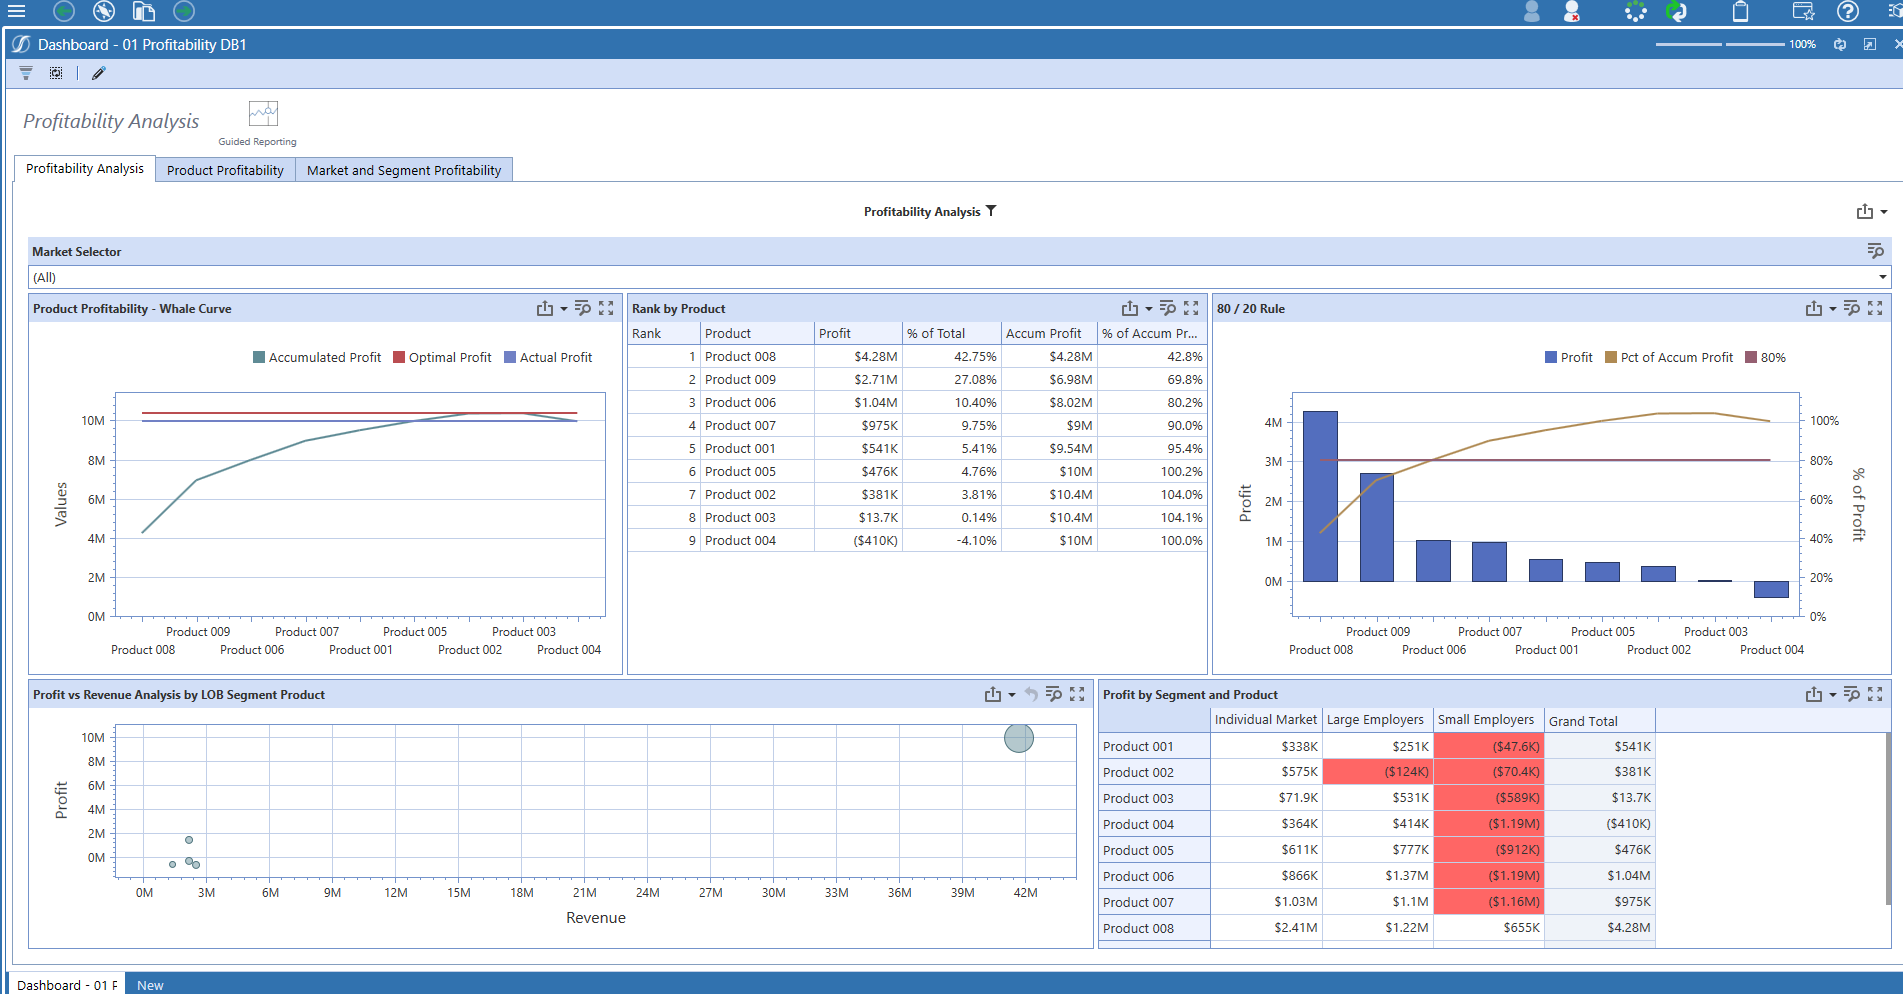
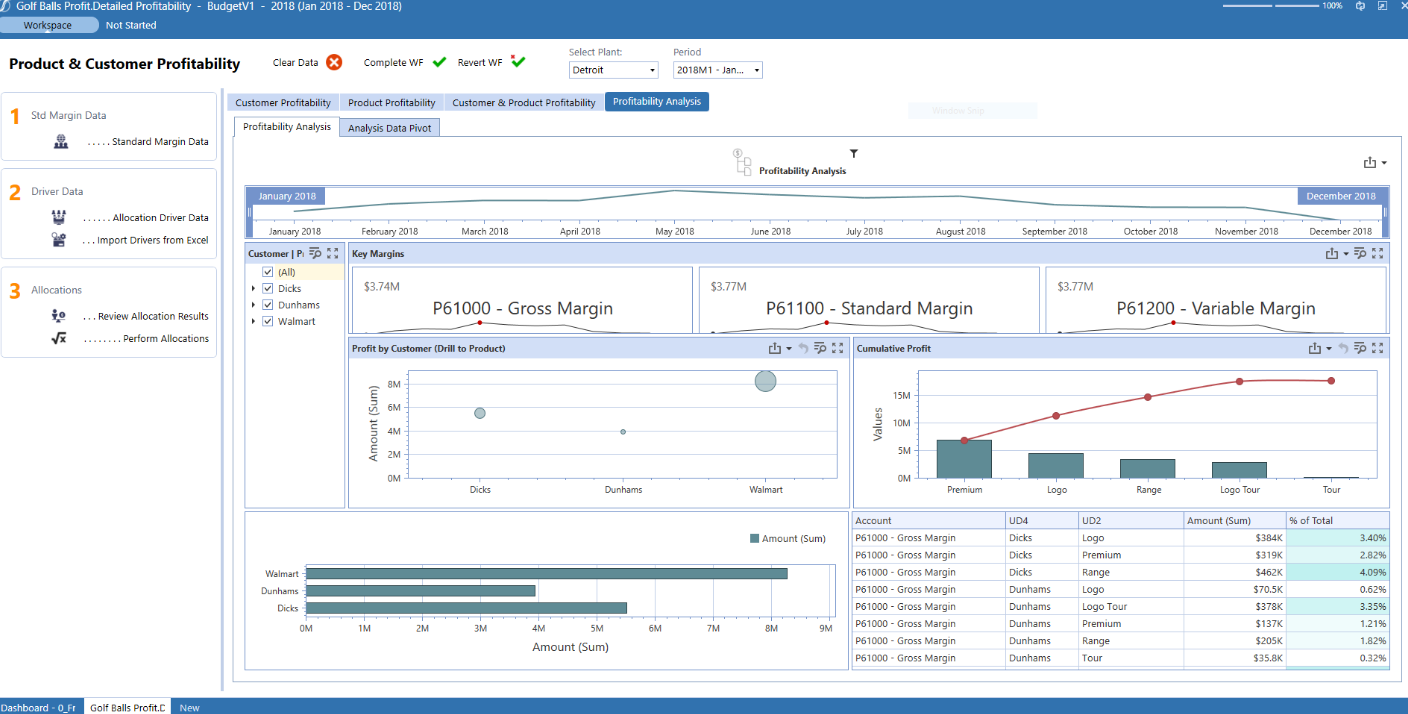
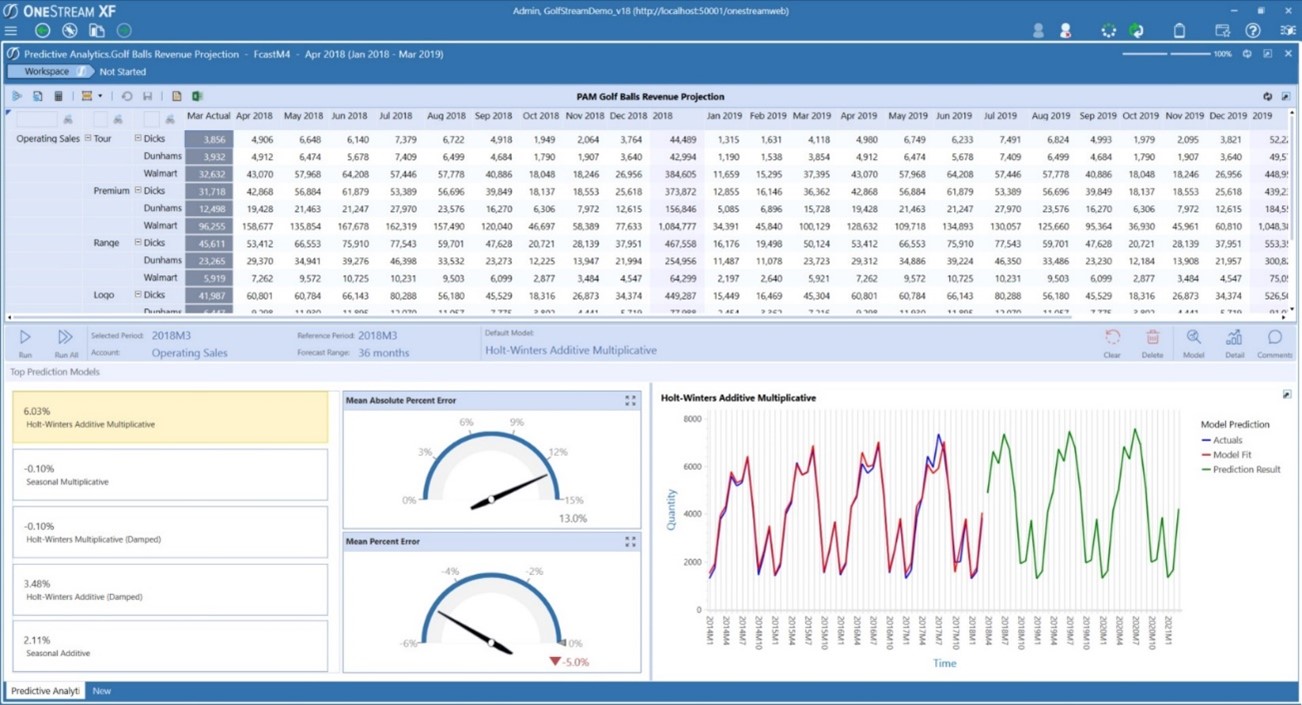
Native Dashboarding Capabilities: Users are impressed by the native dashboarding capabilities of OneStream. They are able to replace their standalone BI tool with dashboards within the platform, streamlining their reporting and providing them with great reports and visualizations.

Easy Data Integration: Many users highlight the easy data integration capabilities of OneStream. They find it convenient to import data from simple CSV files to more complex data sources using API, SQL, etc., making it seamless to bring in data from multiple sources.

Confusing User Interface: Some users have found that the user interface of OneStream is not intuitive, resulting in difficulty learning and using the software effectively. The lack of clear navigation or organization within the interface has been a common complaint among users.

Reliance on Microsoft Technology: Several reviewers have expressed frustration with OneStream's reliance on Microsoft technology. They have encountered compatibility issues with different versions of Microsoft products and limitations imposed by specific browsers, which hindered their overall experience with the software.

Lack of Keyboard Shortcuts: Many users have highlighted a significant drawback regarding OneStream's lack of keyboard shortcuts. This absence slows down their workflow considerably as they are unable to quickly execute commands or perform actions through efficient key combinations. Users believe that incorporating keyboard shortcuts would greatly enhance their productivity while using the software.

When considering the desired scope of functionality, users recommend engaging an implementation consultant and contacting peers on the client reference list for further assistance. Users find the software to be a great tool and are proud of their decision to use it. They advise utilizing the available tutorials for additional support and recommend taking the time to thoroughly analyze all aspects of the software. It is also recommended to settle internal discussions before starting the implementation process. Users find OneStream XF targeted towards finance professionals and highlight the importance of exploring the OneStream XF marketplace for additional solutions. The software is described as a fast and reliable platform that provides agility and flexibility for obtaining homogeneous information. Users find OneStream XF to be an incredible tool that can save time for consolidations, financial reporting, planning, and more. To ensure proper setup and organization of the application, it is suggested to use OneStream personnel and service providers during the initial design and implementation.

Attribute Ratings

Reviews

(1-25 of 45)
Companies can't remove reviews or game the system. Here's why
Tim Vierhout | TrustRadius Reviewer
Score 10 out of 10
Vetted Review
Verified User
Incentivized
Budgeting, Planning, and Forecasting (5)
90%
9.0
Long-term financial planning
100%
10.0
Financial budgeting
100%
10.0
Forecasting
100%
10.0
Scenario modeling
50%
5.0
Management reporting
100%
10.0
Consolidation and Close (7)
95.71428571428571%
9.6
Financial data consolidation
100%
10.0
Journal entries and reports
100%
10.0
Multi-currency management
70%
7.0
Intercompany Eliminations
100%
10.0
Minority Ownership
100%
10.0
Local and consolidated reporting
100%
10.0
Detailed Audit Trails
100%
10.0
Financial Reporting and Compliance (4)
92.5%
9.3
Financial Statement Reporting
100%
10.0
Management Reporting
100%
10.0
Excel-based Reporting
70%
7.0
Automated board and financial reporting
100%
10.0
Analytics and Reporting (6)
76.66666666666667%
7.7
Personalized dashboards
70%
7.0
Color-coded scorecards
70%
7.0
KPIs
100%
10.0
Cost and profitability analysis
70%
7.0
Key Performance Indicator setting
100%
10.0
Benchmarking with external data
50%
5.0
Integration (3)
90%
9.0
Flat file integration
100%
10.0
Excel data integration
70%
7.0
Direct links to 3rd-party data sources
100%
10.0
BI Standard Reporting (3)
63.33333333333333%
6.3
Pixel Perfect reports
50%
5.0
Customizable dashboards
100%
10.0
Report Formatting Templates
40%
4.0
Ad-hoc Reporting (3)
86.66666666666666%
8.7
Drill-down analysis
100%
10.0
Formatting capabilities
60%
6.0
Report sharing and collaboration
100%
10.0
Report Output and Scheduling (4)
67.5%
6.8
Publish to Web
50%
5.0
Publish to PDF
100%
10.0
Report Versioning
60%
6.0
Report Delivery Scheduling
60%
6.0
Data Discovery and Visualization (3)
30%
3.0
Pre-built visualization formats (heatmaps, scatter plots etc.)
30%
3.0
Location Analytics / Geographic Visualization
50%
5.0
Predictive Analytics
10%
1.0
Access Control and Security (5)
100%
10.0
Multi-User Support (named login)
100%
10.0
Role-Based Security Model
100%
10.0
Multiple Access Permission Levels (Create, Read, Delete)
100%
10.0
Report-Level Access Control
100%
10.0
Single Sign-On (SSO)
100%
10.0
Mobile Capabilities
N/A
N/A
March 30, 2024

OneStream Review

Score 8 out of 10
Vetted Review
Verified User
Incentivized
Budgeting, Planning, and Forecasting (5)
N/A
N/A
Long-term financial planning
N/A
N/A
Financial budgeting
N/A
N/A
Forecasting
N/A
N/A
Scenario modeling
N/A
N/A
Management reporting
N/A
N/A
Consolidation and Close (7)
88.57142857142858%
8.9
Financial data consolidation
100%
10.0
Journal entries and reports
80%
8.0
Multi-currency management
90%
9.0
Intercompany Eliminations
80%
8.0
Minority Ownership
90%
9.0
Local and consolidated reporting
80%
8.0
Detailed Audit Trails
100%
10.0
Financial Reporting and Compliance (4)
67.5%
6.8
Financial Statement Reporting
90%
9.0
Management Reporting
80%
8.0
Excel-based Reporting
100%
10.0
Automated board and financial reporting
N/A
N/A
Analytics and Reporting (6)
45%
4.5
Personalized dashboards
90%
9.0
Color-coded scorecards
90%
9.0
KPIs
90%
9.0
Cost and profitability analysis
N/A
N/A
Key Performance Indicator setting
N/A
N/A
Benchmarking with external data
N/A
N/A
Integration (3)
100%
10.0
Flat file integration
100%
10.0
Excel data integration
100%
10.0
Direct links to 3rd-party data sources
100%
10.0
BI Standard Reporting (3)
86.66666666666666%
8.7
Pixel Perfect reports
80%
8.0
Customizable dashboards
90%
9.0
Report Formatting Templates
90%
9.0
Ad-hoc Reporting (3)
100%
10.0
Drill-down analysis
100%
10.0
Formatting capabilities
100%
10.0
Report sharing and collaboration
100%
10.0
Report Output and Scheduling (4)
97.5%
9.8
Publish to Web
90%
9.0
Publish to PDF
100%
10.0
Report Versioning
100%
10.0
Report Delivery Scheduling
100%
10.0
Data Discovery and Visualization (3)
N/A
N/A
Pre-built visualization formats (heatmaps, scatter plots etc.)
N/A
N/A
Location Analytics / Geographic Visualization
N/A
N/A
Predictive Analytics
N/A
N/A
Access Control and Security (5)
72%
7.2
Multi-User Support (named login)
N/A
N/A
Role-Based Security Model
80%
8.0
Multiple Access Permission Levels (Create, Read, Delete)
90%
9.0
Report-Level Access Control
90%
9.0
Single Sign-On (SSO)
100%
10.0
Mobile Capabilities (2)
N/A
N/A
Responsive Design for Web Access
N/A
N/A
Dashboard / Report / Visualization Interactivity on Mobile
N/A
N/A
Maret Oosthuizen | TrustRadius Reviewer
Score 7 out of 10
Vetted Review
Verified User
Budgeting, Planning, and Forecasting (5)
28%
2.8
Long-term financial planning
N/A
N/A
Financial budgeting
60%
6.0
Forecasting
N/A
N/A
Scenario modeling
N/A
N/A
Management reporting
80%
8.0
Consolidation and Close (7)
48.57142857142857%
4.9
Financial data consolidation
80%
8.0
Journal entries and reports
90%
9.0
Multi-currency management
N/A
N/A
Intercompany Eliminations
N/A
N/A
Minority Ownership
N/A
N/A
Local and consolidated reporting
90%
9.0
Detailed Audit Trails
80%
8.0
Financial Reporting and Compliance (4)
62.5%
6.3
Financial Statement Reporting
80%
8.0
Management Reporting
70%
7.0
Excel-based Reporting
100%
10.0
Automated board and financial reporting
N/A
N/A
Analytics and Reporting (6)
N/A
N/A
Personalized dashboards
N/A
N/A
Color-coded scorecards
N/A
N/A
KPIs
N/A
N/A
Cost and profitability analysis
N/A
N/A
Key Performance Indicator setting
N/A
N/A
Benchmarking with external data
N/A
N/A
Integration (3)
56.66666666666667%
5.7
Flat file integration
80%
8.0
Excel data integration
90%
9.0
Direct links to 3rd-party data sources
N/A
N/A
BI Standard Reporting (3)
N/A
N/A
Pixel Perfect reports
N/A
N/A
Customizable dashboards
N/A
N/A
Report Formatting Templates
N/A
N/A
Ad-hoc Reporting (3)
16.666666666666668%
1.7
Drill-down analysis
50%
5.0
Formatting capabilities
N/A
N/A
Report sharing and collaboration
N/A
N/A
Report Output and Scheduling (4)
N/A
N/A
Publish to Web
N/A
N/A
Publish to PDF
N/A
N/A
Report Versioning
N/A
N/A
Report Delivery Scheduling
N/A
N/A
Data Discovery and Visualization (3)
N/A
N/A
Pre-built visualization formats (heatmaps, scatter plots etc.)
N/A
N/A
Location Analytics / Geographic Visualization
N/A
N/A
Predictive Analytics
N/A
N/A
Access Control and Security (5)
100%
10.0
Multi-User Support (named login)
100%
10.0
Role-Based Security Model
100%
10.0
Multiple Access Permission Levels (Create, Read, Delete)
100%
10.0
Report-Level Access Control
100%
10.0
Single Sign-On (SSO)
100%
10.0
Mobile Capabilities (2)
N/A
N/A
Responsive Design for Web Access
N/A
N/A
Dashboard / Report / Visualization Interactivity on Mobile
N/A
N/A
Score 10 out of 10
Vetted Review
Verified User
Incentivized
Budgeting, Planning, and Forecasting (5)
96%
9.6
Long-term financial planning
100%
10.0
Financial budgeting
100%
10.0
Forecasting
100%
10.0
Scenario modeling
90%
9.0
Management reporting
90%
9.0
Consolidation and Close (7)
90%
9.0
Financial data consolidation
80%
8.0
Journal entries and reports
90%
9.0
Multi-currency management
90%
9.0
Intercompany Eliminations
70%
7.0
Minority Ownership
100%
10.0
Local and consolidated reporting
100%
10.0
Detailed Audit Trails
100%
10.0
Financial Reporting and Compliance (4)
92.5%
9.3
Financial Statement Reporting
90%
9.0
Management Reporting
100%
10.0
Excel-based Reporting
100%
10.0
Automated board and financial reporting
80%
8.0
Analytics and Reporting (6)
81.66666666666666%
8.2
Personalized dashboards
90%
9.0
Color-coded scorecards
60%
6.0
KPIs
80%
8.0
Cost and profitability analysis
80%
8.0
Key Performance Indicator setting
90%
9.0
Benchmarking with external data
90%
9.0
Integration (3)
93.33333333333334%
9.3
Flat file integration
100%
10.0
Excel data integration
90%
9.0
Direct links to 3rd-party data sources
90%
9.0
BI Standard Reporting (2)
80%
8.0
Customizable dashboards
80%
8.0
Report Formatting Templates
80%
8.0
Ad-hoc Reporting (3)
96.66666666666666%
9.7
Drill-down analysis
100%
10.0
Formatting capabilities
90%
9.0
Report sharing and collaboration
100%
10.0
Report Output and Scheduling (3)
96.66666666666666%
9.7
Publish to PDF
100%
10.0
Report Versioning
90%
9.0
Report Delivery Scheduling
100%
10.0
Data Discovery and Visualization (3)
93.33333333333334%
9.3
Pre-built visualization formats (heatmaps, scatter plots etc.)
90%
9.0
Location Analytics / Geographic Visualization
90%
9.0
Predictive Analytics
100%
10.0
Access Control and Security (5)
96%
9.6
Multi-User Support (named login)
100%
10.0
Role-Based Security Model
100%
10.0
Multiple Access Permission Levels (Create, Read, Delete)
100%
10.0
Report-Level Access Control
100%
10.0
Single Sign-On (SSO)
80%
8.0
Mobile Capabilities (2)
65%
6.5
Responsive Design for Web Access
60%
6.0
Dashboard / Report / Visualization Interactivity on Mobile
70%
7.0
Score 10 out of 10
Vetted Review
Verified User
Budgeting, Planning, and Forecasting (5)
96%
9.6
Long-term financial planning
100%
10.0
Financial budgeting
100%
10.0
Forecasting
100%
10.0
Scenario modeling
90%
9.0
Management reporting
90%
9.0
Consolidation and Close (7)
97.14285714285714%
9.7
Financial data consolidation
100%
10.0
Journal entries and reports
100%
10.0
Multi-currency management
90%
9.0
Intercompany Eliminations
90%
9.0
Minority Ownership
100%
10.0
Local and consolidated reporting
100%
10.0
Detailed Audit Trails
100%
10.0
Financial Reporting and Compliance (4)
87.5%
8.8
Financial Statement Reporting
90%
9.0
Management Reporting
90%
9.0
Excel-based Reporting
80%
8.0
Automated board and financial reporting
90%
9.0
Analytics and Reporting (6)
93.33333333333334%
9.3
Personalized dashboards
100%
10.0
Color-coded scorecards
100%
10.0
KPIs
90%
9.0
Cost and profitability analysis
100%
10.0
Key Performance Indicator setting
90%
9.0
Benchmarking with external data
80%
8.0
Integration (3)
96.66666666666666%
9.7
Flat file integration
100%
10.0
Excel data integration
90%
9.0
Direct links to 3rd-party data sources
100%
10.0
BI Standard Reporting (3)
70%
7.0
Pixel Perfect reports
70%
7.0
Customizable dashboards
90%
9.0
Report Formatting Templates
50%
5.0
Ad-hoc Reporting (3)
76.66666666666667%
7.7
Drill-down analysis
70%
7.0
Formatting capabilities
70%
7.0
Report sharing and collaboration
90%
9.0
Report Output and Scheduling (3)
60%
6.0
Publish to Web
N/A
N/A
Publish to PDF
100%
10.0
Report Delivery Scheduling
80%
8.0
Data Discovery and Visualization (3)
70%
7.0
Pre-built visualization formats (heatmaps, scatter plots etc.)
70%
7.0
Location Analytics / Geographic Visualization
70%
7.0
Predictive Analytics
70%
7.0
Access Control and Security (5)
100%
10.0
Multi-User Support (named login)
100%
10.0
Role-Based Security Model
100%
10.0
Multiple Access Permission Levels (Create, Read, Delete)
100%
10.0
Report-Level Access Control
100%
10.0
Single Sign-On (SSO)
100%
10.0
Mobile Capabilities
N/A
N/A
March 30, 2024

OneStream Rocks

Score 10 out of 10
Vetted Review
Verified User
Budgeting, Planning, and Forecasting (5)
92%
9.2
Long-term financial planning
100%
10.0
Financial budgeting
80%
8.0
Forecasting
90%
9.0
Scenario modeling
100%
10.0
Management reporting
90%
9.0
Consolidation and Close (7)
N/A
N/A
Financial data consolidation
N/A
N/A
Journal entries and reports
N/A
N/A
Multi-currency management
N/A
N/A
Intercompany Eliminations
N/A
N/A
Minority Ownership
N/A
N/A
Local and consolidated reporting
N/A
N/A
Detailed Audit Trails
N/A
N/A
Financial Reporting and Compliance (4)
N/A
N/A
Financial Statement Reporting
N/A
N/A
Management Reporting
N/A
N/A
Excel-based Reporting
N/A
N/A
Automated board and financial reporting
N/A
N/A
Analytics and Reporting (6)
N/A
N/A
Personalized dashboards
N/A
N/A
Color-coded scorecards
N/A
N/A
KPIs
N/A
N/A
Cost and profitability analysis
N/A
N/A
Key Performance Indicator setting
N/A
N/A
Benchmarking with external data
N/A
N/A
Integration (3)
N/A
N/A
Flat file integration
N/A
N/A
Excel data integration
N/A
N/A
Direct links to 3rd-party data sources
N/A
N/A
BI Standard Reporting (3)
N/A
N/A
Pixel Perfect reports
N/A
N/A
Customizable dashboards
N/A
N/A
Report Formatting Templates
N/A
N/A
Ad-hoc Reporting (3)
N/A
N/A
Drill-down analysis
N/A
N/A
Formatting capabilities
N/A
N/A
Report sharing and collaboration
N/A
N/A
Report Output and Scheduling (4)
N/A
N/A
Publish to Web
N/A
N/A
Publish to PDF
N/A
N/A
Report Versioning
N/A
N/A
Report Delivery Scheduling
N/A
N/A
Data Discovery and Visualization (3)
N/A
N/A
Pre-built visualization formats (heatmaps, scatter plots etc.)
N/A
N/A
Location Analytics / Geographic Visualization
N/A
N/A
Predictive Analytics
N/A
N/A
Access Control and Security (5)
N/A
N/A
Multi-User Support (named login)
N/A
N/A
Role-Based Security Model
N/A
N/A
Multiple Access Permission Levels (Create, Read, Delete)
N/A
N/A
Report-Level Access Control
N/A
N/A
Single Sign-On (SSO)
N/A
N/A
Mobile Capabilities (2)
N/A
N/A
Responsive Design for Web Access
N/A
N/A
Dashboard / Report / Visualization Interactivity on Mobile
N/A
N/A
Score 8 out of 10
Vetted Review
Verified User
Budgeting, Planning, and Forecasting (5)
86%
8.6
Long-term financial planning
90%
9.0
Financial budgeting
90%
9.0
Forecasting
90%
9.0
Scenario modeling
80%
8.0
Management reporting
80%
8.0
Consolidation and Close (7)
81.42857142857142%
8.1
Financial data consolidation
80%
8.0
Journal entries and reports
70%
7.0
Multi-currency management
90%
9.0
Intercompany Eliminations
80%
8.0
Minority Ownership
80%
8.0
Local and consolidated reporting
90%
9.0
Detailed Audit Trails
80%
8.0
Financial Reporting and Compliance (4)
85%
8.5
Financial Statement Reporting
80%
8.0
Management Reporting
90%
9.0
Excel-based Reporting
90%
9.0
Automated board and financial reporting
80%
8.0
Analytics and Reporting (5)
84%
8.4
Personalized dashboards
90%
9.0
Color-coded scorecards
80%
8.0
KPIs
80%
8.0
Cost and profitability analysis
90%
9.0
Key Performance Indicator setting
80%
8.0
Integration (3)
86.66666666666666%
8.7
Flat file integration
90%
9.0
Excel data integration
90%
9.0
Direct links to 3rd-party data sources
80%
8.0
BI Standard Reporting (3)
70%
7.0
Pixel Perfect reports
70%
7.0
Customizable dashboards
70%
7.0
Report Formatting Templates
70%
7.0
Ad-hoc Reporting (3)
80%
8.0
Drill-down analysis
70%
7.0
Formatting capabilities
80%
8.0
Report sharing and collaboration
90%
9.0
Report Output and Scheduling (4)
75%
7.5
Publish to Web
70%
7.0
Publish to PDF
90%
9.0
Report Versioning
70%
7.0
Report Delivery Scheduling
70%
7.0
Data Discovery and Visualization (3)
76.66666666666667%
7.7
Pre-built visualization formats (heatmaps, scatter plots etc.)
70%
7.0
Location Analytics / Geographic Visualization
80%
8.0
Predictive Analytics
80%
8.0
Access Control and Security (5)
80%
8.0
Multi-User Support (named login)
80%
8.0
Role-Based Security Model
80%
8.0
Multiple Access Permission Levels (Create, Read, Delete)
80%
8.0
Report-Level Access Control
80%
8.0
Single Sign-On (SSO)
80%
8.0
Mobile Capabilities
N/A
N/A
March 30, 2024

Review of OneStream

Score 10 out of 10
Vetted Review
Verified User
Budgeting, Planning, and Forecasting (5)
90%
9.0
Long-term financial planning
90%
9.0
Financial budgeting
90%
9.0
Forecasting
90%
9.0
Scenario modeling
90%
9.0
Management reporting
90%
9.0
Consolidation and Close (7)
97.14285714285714%
9.7
Financial data consolidation
100%
10.0
Journal entries and reports
100%
10.0
Multi-currency management
100%
10.0
Intercompany Eliminations
90%
9.0
Minority Ownership
90%
9.0
Local and consolidated reporting
100%
10.0
Detailed Audit Trails
100%
10.0
Financial Reporting and Compliance (4)
90%
9.0
Financial Statement Reporting
90%
9.0
Management Reporting
90%
9.0
Excel-based Reporting
100%
10.0
Automated board and financial reporting
80%
8.0
Analytics and Reporting (6)
80%
8.0
Personalized dashboards
80%
8.0
Color-coded scorecards
80%
8.0
KPIs
80%
8.0
Cost and profitability analysis
80%
8.0
Key Performance Indicator setting
90%
9.0
Benchmarking with external data
70%
7.0
Integration (3)
96.66666666666666%
9.7
Flat file integration
100%
10.0
Excel data integration
100%
10.0
Direct links to 3rd-party data sources
90%
9.0
BI Standard Reporting (3)
90%
9.0
Pixel Perfect reports
90%
9.0
Customizable dashboards
90%
9.0
Report Formatting Templates
90%
9.0
Ad-hoc Reporting (3)
90%
9.0
Drill-down analysis
90%
9.0
Formatting capabilities
90%
9.0
Report sharing and collaboration
90%
9.0
Report Output and Scheduling (3)
90%
9.0
Publish to PDF
90%
9.0
Report Versioning
90%
9.0
Report Delivery Scheduling
90%
9.0
Data Discovery and Visualization (3)
80%
8.0
Pre-built visualization formats (heatmaps, scatter plots etc.)
80%
8.0
Location Analytics / Geographic Visualization
80%
8.0
Predictive Analytics
80%
8.0
Access Control and Security (5)
90%
9.0
Multi-User Support (named login)
90%
9.0
Role-Based Security Model
90%
9.0
Multiple Access Permission Levels (Create, Read, Delete)
90%
9.0
Report-Level Access Control
90%
9.0
Single Sign-On (SSO)
90%
9.0
Mobile Capabilities (1)
80%
8.0
Responsive Design for Web Access
80%
8.0
March 30, 2024

OneStream

Phillip E. Cole, CPA, CGMA | TrustRadius Reviewer
Score 10 out of 10
Vetted Review
Verified User
Budgeting, Planning, and Forecasting (5)
20%
2.0
Long-term financial planning
N/A
N/A
Financial budgeting
N/A
N/A
Forecasting
N/A
N/A
Scenario modeling
N/A
N/A
Management reporting
100%
10.0
Consolidation and Close (7)
82.85714285714286%
8.3
Financial data consolidation
100%
10.0
Journal entries and reports
80%
8.0
Multi-currency management
100%
10.0
Intercompany Eliminations
50%
5.0
Minority Ownership
50%
5.0
Local and consolidated reporting
100%
10.0
Detailed Audit Trails
100%
10.0
Financial Reporting and Compliance (4)
75%
7.5
Financial Statement Reporting
100%
10.0
Management Reporting
100%
10.0
Excel-based Reporting
100%
10.0
Automated board and financial reporting
N/A
N/A
Analytics and Reporting (6)
N/A
N/A
Personalized dashboards
N/A
N/A
Color-coded scorecards
N/A
N/A
KPIs
N/A
N/A
Cost and profitability analysis
N/A
N/A
Key Performance Indicator setting
N/A
N/A
Benchmarking with external data
N/A
N/A
Integration (3)
100%
10.0
Flat file integration
100%
10.0
Excel data integration
100%
10.0
Direct links to 3rd-party data sources
100%
10.0
BI Standard Reporting (3)
N/A
N/A
Pixel Perfect reports
N/A
N/A
Customizable dashboards
N/A
N/A
Report Formatting Templates
N/A
N/A
Ad-hoc Reporting (3)
26.666666666666664%
2.7
Drill-down analysis
N/A
N/A
Formatting capabilities
80%
8.0
Report sharing and collaboration
N/A
N/A
Report Output and Scheduling (4)
N/A
N/A
Publish to Web
N/A
N/A
Publish to PDF
N/A
N/A
Report Versioning
N/A
N/A
Report Delivery Scheduling
N/A
N/A
Data Discovery and Visualization (3)
N/A
N/A
Pre-built visualization formats (heatmaps, scatter plots etc.)
N/A
N/A
Location Analytics / Geographic Visualization
N/A
N/A
Predictive Analytics
N/A
N/A
Access Control and Security (5)
80%
8.0
Multi-User Support (named login)
100%
10.0
Role-Based Security Model
100%
10.0
Multiple Access Permission Levels (Create, Read, Delete)
100%
10.0
Report-Level Access Control
N/A
N/A
Single Sign-On (SSO)
100%
10.0
Mobile Capabilities (2)
N/A
N/A
Responsive Design for Web Access
N/A
N/A
Dashboard / Report / Visualization Interactivity on Mobile
N/A
N/A
Michel Sabourin | TrustRadius Reviewer
Score 10 out of 10
Vetted Review
Verified User
Budgeting, Planning, and Forecasting (5)
100%
10.0
Long-term financial planning
100%
10.0
Financial budgeting
100%
10.0
Forecasting
100%
10.0
Scenario modeling
100%
10.0
Management reporting
100%
10.0
Consolidation and Close (7)
100%
10.0
Financial data consolidation
100%
10.0
Journal entries and reports
100%
10.0
Multi-currency management
100%
10.0
Intercompany Eliminations
100%
10.0
Minority Ownership
100%
10.0
Local and consolidated reporting
100%
10.0
Detailed Audit Trails
100%
10.0
Financial Reporting and Compliance (4)
100%
10.0
Financial Statement Reporting
100%
10.0
Management Reporting
100%
10.0
Excel-based Reporting
100%
10.0
Automated board and financial reporting
100%
10.0
Analytics and Reporting (6)
100%
10.0
Personalized dashboards
100%
10.0
Color-coded scorecards
100%
10.0
KPIs
100%
10.0
Cost and profitability analysis
100%
10.0
Key Performance Indicator setting
100%
10.0
Benchmarking with external data
100%
10.0
Integration (3)
100%
10.0
Flat file integration
100%
10.0
Excel data integration
100%
10.0
Direct links to 3rd-party data sources
100%
10.0
BI Standard Reporting (2)
100%
10.0
Customizable dashboards
100%
10.0
Report Formatting Templates
100%
10.0
Ad-hoc Reporting (3)
100%
10.0
Drill-down analysis
100%
10.0
Formatting capabilities
100%
10.0
Report sharing and collaboration
100%
10.0
Report Output and Scheduling (3)
100%
10.0
Publish to PDF
100%
10.0
Report Versioning
100%
10.0
Report Delivery Scheduling
100%
10.0
Data Discovery and Visualization (3)
86.66666666666666%
8.7
Pre-built visualization formats (heatmaps, scatter plots etc.)
100%
10.0
Location Analytics / Geographic Visualization
80%
8.0
Predictive Analytics
80%
8.0
Access Control and Security (5)
100%
10.0
Multi-User Support (named login)
100%
10.0
Role-Based Security Model
100%
10.0
Multiple Access Permission Levels (Create, Read, Delete)
100%
10.0
Report-Level Access Control
100%
10.0
Single Sign-On (SSO)
100%
10.0
Mobile Capabilities
N/A
N/A
March 29, 2024

OneStream Review

Score 10 out of 10
Vetted Review
Verified User
Budgeting, Planning, and Forecasting (5)
88%
8.8
Long-term financial planning
100%
10.0
Financial budgeting
80%
8.0
Forecasting
80%
8.0
Scenario modeling
80%
8.0
Management reporting
100%
10.0
Consolidation and Close (7)
100%
10.0
Financial data consolidation
100%
10.0
Journal entries and reports
100%
10.0
Multi-currency management
100%
10.0
Intercompany Eliminations
100%
10.0
Minority Ownership
100%
10.0
Local and consolidated reporting
100%
10.0
Detailed Audit Trails
100%
10.0
Financial Reporting and Compliance (4)
100%
10.0
Financial Statement Reporting
100%
10.0
Management Reporting
100%
10.0
Excel-based Reporting
100%
10.0
Automated board and financial reporting
100%
10.0
Analytics and Reporting (6)
96.66666666666666%
9.7
Personalized dashboards
100%
10.0
Color-coded scorecards
80%
8.0
KPIs
100%
10.0
Cost and profitability analysis
100%
10.0
Key Performance Indicator setting
100%
10.0
Benchmarking with external data
100%
10.0
Integration (3)
100%
10.0
Flat file integration
100%
10.0
Excel data integration
100%
10.0
Direct links to 3rd-party data sources
100%
10.0
BI Standard Reporting (3)
90%
9.0
Pixel Perfect reports
70%
7.0
Customizable dashboards
100%
10.0
Report Formatting Templates
100%
10.0
Ad-hoc Reporting (3)
93.33333333333334%
9.3
Drill-down analysis
100%
10.0
Formatting capabilities
80%
8.0
Report sharing and collaboration
100%
10.0
Report Output and Scheduling (4)
75%
7.5
Publish to Web
50%
5.0
Publish to PDF
100%
10.0
Report Versioning
50%
5.0
Report Delivery Scheduling
100%
10.0
Data Discovery and Visualization (3)
90%
9.0
Pre-built visualization formats (heatmaps, scatter plots etc.)
90%
9.0
Location Analytics / Geographic Visualization
90%
9.0
Predictive Analytics
90%
9.0
Access Control and Security (5)
100%
10.0
Multi-User Support (named login)
100%
10.0
Role-Based Security Model
100%
10.0
Multiple Access Permission Levels (Create, Read, Delete)
100%
10.0
Report-Level Access Control
100%
10.0
Single Sign-On (SSO)
100%
10.0
Mobile Capabilities (2)
65%
6.5
Responsive Design for Web Access
80%
8.0
Dashboard / Report / Visualization Interactivity on Mobile
50%
5.0
March 29, 2024

OneStream Review

Score 10 out of 10
Vetted Review
Verified User
Budgeting, Planning, and Forecasting (5)
100%
10.0
Long-term financial planning
100%
10.0
Financial budgeting
100%
10.0
Forecasting
100%
10.0
Scenario modeling
100%
10.0
Management reporting
100%
10.0
Consolidation and Close (7)
90%
9.0
Financial data consolidation
100%
10.0
Journal entries and reports
80%
8.0
Multi-currency management
100%
10.0
Intercompany Eliminations
100%
10.0
Minority Ownership
70%
7.0
Local and consolidated reporting
100%
10.0
Detailed Audit Trails
80%
8.0
Financial Reporting and Compliance (4)
100%
10.0
Financial Statement Reporting
100%
10.0
Management Reporting
100%
10.0
Excel-based Reporting
100%
10.0
Automated board and financial reporting
100%
10.0
Analytics and Reporting (6)
86.66666666666666%
8.7
Personalized dashboards
100%
10.0
Color-coded scorecards
100%
10.0
KPIs
80%
8.0
Cost and profitability analysis
80%
8.0
Key Performance Indicator setting
80%
8.0
Benchmarking with external data
80%
8.0
Integration (3)
100%
10.0
Flat file integration
100%
10.0
Excel data integration
100%
10.0
Direct links to 3rd-party data sources
100%
10.0
BI Standard Reporting (3)
83.33333333333334%
8.3
Pixel Perfect reports
50%
5.0
Customizable dashboards
100%
10.0
Report Formatting Templates
100%
10.0
Ad-hoc Reporting (3)
100%
10.0
Drill-down analysis
100%
10.0
Formatting capabilities
100%
10.0
Report sharing and collaboration
100%
10.0
Report Output and Scheduling (4)
95%
9.5
Publish to Web
80%
8.0
Publish to PDF
100%
10.0
Report Versioning
100%
10.0
Report Delivery Scheduling
100%
10.0
Data Discovery and Visualization (3)
83.33333333333334%
8.3
Pre-built visualization formats (heatmaps, scatter plots etc.)
100%
10.0
Location Analytics / Geographic Visualization
100%
10.0
Predictive Analytics
50%
5.0
Access Control and Security (5)
78%
7.8
Multi-User Support (named login)
70%
7.0
Role-Based Security Model
70%
7.0
Multiple Access Permission Levels (Create, Read, Delete)
70%
7.0
Report-Level Access Control
80%
8.0
Single Sign-On (SSO)
100%
10.0
Mobile Capabilities (2)
60%
6.0
Responsive Design for Web Access
60%
6.0
Dashboard / Report / Visualization Interactivity on Mobile
60%
6.0
Score 8 out of 10
Vetted Review
Verified User
Budgeting, Planning, and Forecasting (5)
68%
6.8
Long-term financial planning
60%
6.0
Financial budgeting
80%
8.0
Forecasting
80%
8.0
Scenario modeling
40%
4.0
Management reporting
80%
8.0
Consolidation and Close (7)
70%
7.0
Financial data consolidation
80%
8.0
Journal entries and reports
70%
7.0
Multi-currency management
50%
5.0
Intercompany Eliminations
70%
7.0
Minority Ownership
50%
5.0
Local and consolidated reporting
80%
8.0
Detailed Audit Trails
90%
9.0
Financial Reporting and Compliance (4)
60%
6.0
Financial Statement Reporting
90%
9.0
Management Reporting
70%
7.0
Excel-based Reporting
10%
1.0
Automated board and financial reporting
70%
7.0
Analytics and Reporting (6)
68.33333333333333%
6.8
Personalized dashboards
80%
8.0
Color-coded scorecards
70%
7.0
KPIs
80%
8.0
Cost and profitability analysis
70%
7.0
Key Performance Indicator setting
80%
8.0
Benchmarking with external data
30%
3.0
Integration (3)
70%
7.0
Flat file integration
80%
8.0
Excel data integration
80%
8.0
Direct links to 3rd-party data sources
50%
5.0
BI Standard Reporting (3)
80%
8.0
Pixel Perfect reports
80%
8.0
Customizable dashboards
80%
8.0
Report Formatting Templates
80%
8.0
Ad-hoc Reporting (3)
16.666666666666668%
1.7
Drill-down analysis
10%
1.0
Formatting capabilities
20%
2.0
Report sharing and collaboration
20%
2.0
Report Output and Scheduling (4)
80%
8.0
Publish to Web
80%
8.0
Publish to PDF
80%
8.0
Report Versioning
80%
8.0
Report Delivery Scheduling
80%
8.0
Data Discovery and Visualization (3)
50%
5.0
Pre-built visualization formats (heatmaps, scatter plots etc.)
50%
5.0
Location Analytics / Geographic Visualization
50%
5.0
Predictive Analytics
50%
5.0
Access Control and Security (5)
70%
7.0
Multi-User Support (named login)
90%
9.0
Role-Based Security Model
90%
9.0
Multiple Access Permission Levels (Create, Read, Delete)
80%
8.0
Report-Level Access Control
80%
8.0
Single Sign-On (SSO)
10%
1.0
Mobile Capabilities
N/A
N/A
Score 9 out of 10
Vetted Review
Verified User
Budgeting, Planning, and Forecasting (5)
96%
9.6
Long-term financial planning
100%
10.0
Financial budgeting
100%
10.0
Forecasting
100%
10.0
Scenario modeling
80%
8.0
Management reporting
100%
10.0
Consolidation and Close (7)
95.71428571428571%
9.6
Financial data consolidation
100%
10.0
Journal entries and reports
80%
8.0
Multi-currency management
90%
9.0
Intercompany Eliminations
100%
10.0
Minority Ownership
100%
10.0
Local and consolidated reporting
100%
10.0
Detailed Audit Trails
100%
10.0
Financial Reporting and Compliance (4)
92.5%
9.3
Financial Statement Reporting
100%
10.0
Management Reporting
100%
10.0
Excel-based Reporting
90%
9.0
Automated board and financial reporting
80%
8.0
Analytics and Reporting (6)
100%
10.0
Personalized dashboards
100%
10.0
Color-coded scorecards
100%
10.0
KPIs
100%
10.0
Cost and profitability analysis
100%
10.0
Key Performance Indicator setting
100%
10.0
Benchmarking with external data
100%
10.0
Integration (3)
96.66666666666666%
9.7
Flat file integration
100%
10.0
Excel data integration
100%
10.0
Direct links to 3rd-party data sources
90%
9.0
BI Standard Reporting (2)
95%
9.5
Customizable dashboards
100%
10.0
Report Formatting Templates
90%
9.0
Ad-hoc Reporting (3)
90%
9.0
Drill-down analysis
90%
9.0
Formatting capabilities
90%
9.0
Report sharing and collaboration
90%
9.0
Report Output and Scheduling (4)
100%
10.0
Publish to Web
100%
10.0
Publish to PDF
100%
10.0
Report Versioning
100%
10.0
Report Delivery Scheduling
100%
10.0
Data Discovery and Visualization (3)
53.33333333333333%
5.3
Pre-built visualization formats (heatmaps, scatter plots etc.)
80%
8.0
Location Analytics / Geographic Visualization
80%
8.0
Predictive Analytics
N/A
N/A
Access Control and Security (5)
94%
9.4
Multi-User Support (named login)
100%
10.0
Role-Based Security Model
80%
8.0
Multiple Access Permission Levels (Create, Read, Delete)
90%
9.0
Report-Level Access Control
100%
10.0
Single Sign-On (SSO)
100%
10.0
Mobile Capabilities (2)
N/A
N/A
Responsive Design for Web Access
N/A
N/A
Dashboard / Report / Visualization Interactivity on Mobile
N/A
N/A
Brian Frederick, MBA | TrustRadius Reviewer
Score 9 out of 10
Vetted Review
Verified User
Budgeting, Planning, and Forecasting (5)
50%
5.0
Long-term financial planning
40%
4.0
Financial budgeting
40%
4.0
Forecasting
40%
4.0
Scenario modeling
30%
3.0
Management reporting
100%
10.0
Consolidation and Close (6)
88.33333333333334%
8.8
Financial data consolidation
100%
10.0
Journal entries and reports
70%
7.0
Intercompany Eliminations
100%
10.0
Minority Ownership
80%
8.0
Local and consolidated reporting
100%
10.0
Detailed Audit Trails
80%
8.0
Financial Reporting and Compliance (4)
75%
7.5
Financial Statement Reporting
100%
10.0
Management Reporting
100%
10.0
Excel-based Reporting
40%
4.0
Automated board and financial reporting
60%
6.0
Analytics and Reporting (1)
90%
9.0
Personalized dashboards
90%
9.0
Integration (3)
83.33333333333334%
8.3
Flat file integration
100%
10.0
Excel data integration
70%
7.0
Direct links to 3rd-party data sources
80%
8.0
BI Standard Reporting
N/A
N/A
Ad-hoc Reporting (3)
70%
7.0
Drill-down analysis
70%
7.0
Formatting capabilities
70%
7.0
Report sharing and collaboration
70%
7.0
Report Output and Scheduling (3)
60%
6.0
Publish to PDF
80%
8.0
Report Versioning
50%
5.0
Report Delivery Scheduling
50%
5.0
Data Discovery and Visualization
N/A
N/A
Access Control and Security (5)
92%
9.2
Multi-User Support (named login)
100%
10.0
Role-Based Security Model
90%
9.0
Multiple Access Permission Levels (Create, Read, Delete)
80%
8.0
Report-Level Access Control
90%
9.0
Single Sign-On (SSO)
100%
10.0
Mobile Capabilities
N/A
N/A
Score 10 out of 10
Vetted Review
Verified User
Budgeting, Planning, and Forecasting (5)
100%
10.0
Long-term financial planning
100%
10.0
Financial budgeting
100%
10.0
Forecasting
100%
10.0
Scenario modeling
100%
10.0
Management reporting
100%
10.0
Consolidation and Close (7)
98.57142857142858%
9.9
Financial data consolidation
100%
10.0
Journal entries and reports
100%
10.0
Multi-currency management
100%
10.0
Intercompany Eliminations
100%
10.0
Minority Ownership
100%
10.0
Local and consolidated reporting
90%
9.0
Detailed Audit Trails
100%
10.0
Financial Reporting and Compliance (4)
100%
10.0
Financial Statement Reporting
100%
10.0
Management Reporting
100%
10.0
Excel-based Reporting
100%
10.0
Automated board and financial reporting
100%
10.0
Analytics and Reporting (6)
95%
9.5
Personalized dashboards
100%
10.0
Color-coded scorecards
100%
10.0
KPIs
90%
9.0
Cost and profitability analysis
90%
9.0
Key Performance Indicator setting
90%
9.0
Benchmarking with external data
100%
10.0
Integration (3)
100%
10.0
Flat file integration
100%
10.0
Excel data integration
100%
10.0
Direct links to 3rd-party data sources
100%
10.0
BI Standard Reporting (3)
100%
10.0
Pixel Perfect reports
100%
10.0
Customizable dashboards
100%
10.0
Report Formatting Templates
100%
10.0
Ad-hoc Reporting (3)
93.33333333333334%
9.3
Drill-down analysis
90%
9.0
Formatting capabilities
90%
9.0
Report sharing and collaboration
100%
10.0
Report Output and Scheduling (4)
65%
6.5
Publish to Web
80%
8.0
Publish to PDF
90%
9.0
Report Versioning
N/A
N/A
Report Delivery Scheduling
90%
9.0
Data Discovery and Visualization (3)
90%
9.0
Pre-built visualization formats (heatmaps, scatter plots etc.)
90%
9.0
Location Analytics / Geographic Visualization
90%
9.0
Predictive Analytics
90%
9.0
Access Control and Security (5)
100%
10.0
Multi-User Support (named login)
100%
10.0
Role-Based Security Model
100%
10.0
Multiple Access Permission Levels (Create, Read, Delete)
100%
10.0
Report-Level Access Control
100%
10.0
Single Sign-On (SSO)
100%
10.0
Mobile Capabilities (2)
45%
4.5
Responsive Design for Web Access
90%
9.0
Dashboard / Report / Visualization Interactivity on Mobile
N/A
N/A
Score 8 out of 10
Vetted Review
Verified User
Budgeting, Planning, and Forecasting (5)
80%
8.0
Long-term financial planning
80%
8.0
Financial budgeting
80%
8.0
Forecasting
80%
8.0
Scenario modeling
70%
7.0
Management reporting
90%
9.0
Consolidation and Close (7)
87.14285714285714%
8.7
Financial data consolidation
90%
9.0
Journal entries and reports
80%
8.0
Multi-currency management
90%
9.0
Intercompany Eliminations
90%
9.0
Minority Ownership
90%
9.0
Local and consolidated reporting
80%
8.0
Detailed Audit Trails
90%
9.0
Financial Reporting and Compliance (4)
90%
9.0
Financial Statement Reporting
90%
9.0
Management Reporting
90%
9.0
Excel-based Reporting
90%
9.0
Automated board and financial reporting
90%
9.0
Analytics and Reporting (6)
35%
3.5
Personalized dashboards
70%
7.0
Color-coded scorecards
70%
7.0
KPIs
70%
7.0
Cost and profitability analysis
N/A
N/A
Key Performance Indicator setting
N/A
N/A
Benchmarking with external data
N/A
N/A
Integration (3)
90%
9.0
Flat file integration
90%
9.0
Excel data integration
90%
9.0
Direct links to 3rd-party data sources
90%
9.0
BI Standard Reporting (3)
66.66666666666667%
6.7
Pixel Perfect reports
60%
6.0
Customizable dashboards
70%
7.0
Report Formatting Templates
70%
7.0
Ad-hoc Reporting (3)
73.33333333333333%
7.3
Drill-down analysis
90%
9.0
Formatting capabilities
70%
7.0
Report sharing and collaboration
60%
6.0
Report Output and Scheduling (4)
57.5%
5.8
Publish to Web
N/A
N/A
Publish to PDF
80%
8.0
Report Versioning
60%
6.0
Report Delivery Scheduling
90%
9.0
Data Discovery and Visualization (3)
40%
4.0
Pre-built visualization formats (heatmaps, scatter plots etc.)
60%
6.0
Location Analytics / Geographic Visualization
60%
6.0
Predictive Analytics
N/A
N/A
Access Control and Security (5)
90%
9.0
Multi-User Support (named login)
90%
9.0
Role-Based Security Model
90%
9.0
Multiple Access Permission Levels (Create, Read, Delete)
90%
9.0
Report-Level Access Control
90%
9.0
Single Sign-On (SSO)
90%
9.0
Mobile Capabilities
N/A
N/A
Score 8 out of 10
Vetted Review
Verified User
Budgeting, Planning, and Forecasting (5)
72%
7.2
Long-term financial planning
80%
8.0
Financial budgeting
70%
7.0
Forecasting
60%
6.0
Scenario modeling
70%
7.0
Management reporting
80%
8.0
Consolidation and Close (6)
76.66666666666667%
7.7
Financial data consolidation
90%
9.0
Journal entries and reports
60%
6.0
Multi-currency management
70%
7.0
Intercompany Eliminations
80%
8.0
Local and consolidated reporting
80%
8.0
Detailed Audit Trails
80%
8.0
Financial Reporting and Compliance (4)
80%
8.0
Financial Statement Reporting
70%
7.0
Management Reporting
70%
7.0
Excel-based Reporting
100%
10.0
Automated board and financial reporting
80%
8.0
Analytics and Reporting (6)
78.33333333333333%
7.8
Personalized dashboards
90%
9.0
Color-coded scorecards
80%
8.0
KPIs
70%
7.0
Cost and profitability analysis
80%
8.0
Key Performance Indicator setting
60%
6.0
Benchmarking with external data
90%
9.0
Integration (3)
93.33333333333334%
9.3
Flat file integration
100%
10.0
Excel data integration
100%
10.0
Direct links to 3rd-party data sources
80%
8.0
BI Standard Reporting (3)
76.66666666666667%
7.7
Pixel Perfect reports
60%
6.0
Customizable dashboards
80%
8.0
Report Formatting Templates
90%
9.0
Ad-hoc Reporting (3)
66.66666666666667%
6.7
Drill-down analysis
40%
4.0
Formatting capabilities
70%
7.0
Report sharing and collaboration
90%
9.0
Report Output and Scheduling (2)
100%
10.0
Publish to Web
100%
10.0
Publish to PDF
100%
10.0
Data Discovery and Visualization (3)
70%
7.0
Pre-built visualization formats (heatmaps, scatter plots etc.)
60%
6.0
Location Analytics / Geographic Visualization
80%
8.0
Predictive Analytics
70%
7.0
Access Control and Security (5)
68%
6.8
Multi-User Support (named login)
80%
8.0
Role-Based Security Model
80%
8.0
Multiple Access Permission Levels (Create, Read, Delete)
80%
8.0
Report-Level Access Control
N/A
N/A
Single Sign-On (SSO)
100%
10.0
Mobile Capabilities (1)
60%
6.0
Responsive Design for Web Access
60%
6.0
Score 9 out of 10
Vetted Review
Verified User
Incentivized
Budgeting, Planning, and Forecasting (5)
88%
8.8
Long-term financial planning
90%
9.0
Financial budgeting
90%
9.0
Forecasting
80%
8.0
Scenario modeling
90%
9.0
Management reporting
90%
9.0
Consolidation and Close (7)
91.42857142857142%
9.1
Financial data consolidation
100%
10.0
Journal entries and reports
90%
9.0
Multi-currency management
90%
9.0
Intercompany Eliminations
90%
9.0
Minority Ownership
90%
9.0
Local and consolidated reporting
90%
9.0
Detailed Audit Trails
90%
9.0
Financial Reporting and Compliance (4)
87.5%
8.8
Financial Statement Reporting
100%
10.0
Management Reporting
100%
10.0
Excel-based Reporting
80%
8.0
Automated board and financial reporting
70%
7.0
Analytics and Reporting (6)
78.33333333333333%
7.8
Personalized dashboards
70%
7.0
Color-coded scorecards
70%
7.0
KPIs
90%
9.0
Cost and profitability analysis
80%
8.0
Key Performance Indicator setting
90%
9.0
Benchmarking with external data
70%
7.0
Integration (3)
90%
9.0
Flat file integration
90%
9.0
Excel data integration
90%
9.0
Direct links to 3rd-party data sources
90%
9.0
BI Standard Reporting (3)
N/A
N/A
Pixel Perfect reports
N/A
N/A
Customizable dashboards
N/A
N/A
Report Formatting Templates
N/A
N/A
Ad-hoc Reporting (3)
66.66666666666667%
6.7
Drill-down analysis
70%
7.0
Formatting capabilities
70%
7.0
Report sharing and collaboration
60%
6.0
Report Output and Scheduling (4)
65%
6.5
Publish to Web
70%
7.0
Publish to PDF
80%
8.0
Report Versioning
50%
5.0
Report Delivery Scheduling
60%
6.0
Data Discovery and Visualization (3)
40%
4.0
Pre-built visualization formats (heatmaps, scatter plots etc.)
60%
6.0
Location Analytics / Geographic Visualization
60%
6.0
Predictive Analytics
N/A
N/A
Access Control and Security (5)
76%
7.6
Multi-User Support (named login)
90%
9.0
Role-Based Security Model
70%
7.0
Multiple Access Permission Levels (Create, Read, Delete)
80%
8.0
Report-Level Access Control
60%
6.0
Single Sign-On (SSO)
80%
8.0
Mobile Capabilities (2)
N/A
N/A
Responsive Design for Web Access
N/A
N/A
Dashboard / Report / Visualization Interactivity on Mobile
N/A
N/A
Score 10 out of 10
Vetted Review
Verified User
Budgeting, Planning, and Forecasting (5)
100%
10.0
Long-term financial planning
100%
10.0
Financial budgeting
100%
10.0
Forecasting
100%
10.0
Scenario modeling
100%
10.0
Management reporting
100%
10.0
Consolidation and Close (6)
98.33333333333334%
9.8
Financial data consolidation
100%
10.0
Journal entries and reports
100%
10.0
Multi-currency management
90%
9.0
Intercompany Eliminations
100%
10.0
Local and consolidated reporting
100%
10.0
Detailed Audit Trails
100%
10.0
Financial Reporting and Compliance (4)
100%
10.0
Financial Statement Reporting
100%
10.0
Management Reporting
100%
10.0
Excel-based Reporting
100%
10.0
Automated board and financial reporting
100%
10.0
Analytics and Reporting (5)
100%
10.0
Personalized dashboards
100%
10.0
Color-coded scorecards
100%
10.0
KPIs
100%
10.0
Cost and profitability analysis
100%
10.0
Key Performance Indicator setting
100%
10.0
Integration (3)
100%
10.0
Flat file integration
100%
10.0
Excel data integration
100%
10.0
Direct links to 3rd-party data sources
100%
10.0
BI Standard Reporting (2)
100%
10.0
Pixel Perfect reports
100%
10.0
Customizable dashboards
100%
10.0
Ad-hoc Reporting (3)
100%
10.0
Drill-down analysis
100%
10.0
Formatting capabilities
100%
10.0
Report sharing and collaboration
100%
10.0
Report Output and Scheduling (3)
100%
10.0
Publish to PDF
100%
10.0
Report Versioning
100%
10.0
Report Delivery Scheduling
100%
10.0
Data Discovery and Visualization (3)
100%
10.0
Pre-built visualization formats (heatmaps, scatter plots etc.)
100%
10.0
Location Analytics / Geographic Visualization
100%
10.0
Predictive Analytics
100%
10.0
Access Control and Security (4)
100%
10.0
Multi-User Support (named login)
100%
10.0
Role-Based Security Model
100%
10.0
Multiple Access Permission Levels (Create, Read, Delete)
100%
10.0
Single Sign-On (SSO)
100%
10.0
Mobile Capabilities
N/A
N/A
March 15, 2024

OneStream Wonders

Score 7 out of 10
Vetted Review
Verified User
Incentivized
Budgeting, Planning, and Forecasting (5)
78%
7.8
Long-term financial planning
80%
8.0
Financial budgeting
80%
8.0
Forecasting
80%
8.0
Scenario modeling
70%
7.0
Management reporting
80%
8.0
Consolidation and Close (7)
71.42857142857143%
7.1
Financial data consolidation
80%
8.0
Journal entries and reports
70%
7.0
Multi-currency management
70%
7.0
Intercompany Eliminations
70%
7.0
Minority Ownership
70%
7.0
Local and consolidated reporting
70%
7.0
Detailed Audit Trails
70%
7.0
Financial Reporting and Compliance (4)
65%
6.5
Financial Statement Reporting
70%
7.0
Management Reporting
70%
7.0
Excel-based Reporting
70%
7.0
Automated board and financial reporting
50%
5.0
Analytics and Reporting (6)
66.66666666666667%
6.7
Personalized dashboards
50%
5.0
Color-coded scorecards
70%
7.0
KPIs
70%
7.0
Cost and profitability analysis
70%
7.0
Key Performance Indicator setting
80%
8.0
Benchmarking with external data
60%
6.0
Integration (3)
66.66666666666667%
6.7
Flat file integration
70%
7.0
Excel data integration
60%
6.0
Direct links to 3rd-party data sources
70%
7.0
BI Standard Reporting (3)
60%
6.0
Pixel Perfect reports
60%
6.0
Customizable dashboards
60%
6.0
Report Formatting Templates
60%
6.0
Ad-hoc Reporting (3)
50%
5.0
Drill-down analysis
50%
5.0
Formatting capabilities
50%
5.0
Report sharing and collaboration
50%
5.0
Report Output and Scheduling (4)
50%
5.0
Publish to Web
50%
5.0
Publish to PDF
50%
5.0
Report Versioning
50%
5.0
Report Delivery Scheduling
50%
5.0
Data Discovery and Visualization (3)
60%
6.0
Pre-built visualization formats (heatmaps, scatter plots etc.)
50%
5.0
Location Analytics / Geographic Visualization
50%
5.0
Predictive Analytics
80%
8.0
Access Control and Security (5)
50%
5.0
Multi-User Support (named login)
70%
7.0
Role-Based Security Model
50%
5.0
Multiple Access Permission Levels (Create, Read, Delete)
70%
7.0
Report-Level Access Control
N/A
N/A
Single Sign-On (SSO)
60%
6.0
Mobile Capabilities (2)
70%
7.0
Responsive Design for Web Access
70%
7.0
Dashboard / Report / Visualization Interactivity on Mobile
70%
7.0
Score 9 out of 10
Vetted Review
Verified User
Incentivized
Budgeting, Planning, and Forecasting (5)
18%
1.8
Long-term financial planning
N/A
N/A
Financial budgeting
N/A
N/A
Forecasting
N/A
N/A
Scenario modeling
N/A
N/A
Management reporting
90%
9.0
Consolidation and Close (7)
90%
9.0
Financial data consolidation
90%
9.0
Journal entries and reports
90%
9.0
Multi-currency management
90%
9.0
Intercompany Eliminations
90%
9.0
Minority Ownership
90%
9.0
Local and consolidated reporting
90%
9.0
Detailed Audit Trails
90%
9.0
Financial Reporting and Compliance (4)
82.5%
8.3
Financial Statement Reporting
80%
8.0
Management Reporting
90%
9.0
Excel-based Reporting
90%
9.0
Automated board and financial reporting
70%
7.0
Analytics and Reporting (6)
68.33333333333333%
6.8
Personalized dashboards
70%
7.0
Color-coded scorecards
70%
7.0
KPIs
90%
9.0
Cost and profitability analysis
90%
9.0
Key Performance Indicator setting
90%
9.0
Benchmarking with external data
N/A
N/A
Integration (3)
90%
9.0
Flat file integration
90%
9.0
Excel data integration
90%
9.0
Direct links to 3rd-party data sources
90%
9.0
BI Standard Reporting (3)
N/A
N/A
Pixel Perfect reports
N/A
N/A
Customizable dashboards
N/A
N/A
Report Formatting Templates
N/A
N/A
Ad-hoc Reporting (3)
60%
6.0
Drill-down analysis
90%
9.0
Formatting capabilities
90%
9.0
Report sharing and collaboration
N/A
N/A
Report Output and Scheduling (4)
65%
6.5
Publish to Web
N/A
N/A
Publish to PDF
90%
9.0
Report Versioning
80%
8.0
Report Delivery Scheduling
90%
9.0
Data Discovery and Visualization (3)
N/A
N/A
Pre-built visualization formats (heatmaps, scatter plots etc.)
N/A
N/A
Location Analytics / Geographic Visualization
N/A
N/A
Predictive Analytics
N/A
N/A
Access Control and Security (5)
90%
9.0
Multi-User Support (named login)
90%
9.0
Role-Based Security Model
90%
9.0
Multiple Access Permission Levels (Create, Read, Delete)
90%
9.0
Report-Level Access Control
90%
9.0
Single Sign-On (SSO)
90%
9.0
Mobile Capabilities (2)
N/A
N/A
Responsive Design for Web Access
N/A
N/A
Dashboard / Report / Visualization Interactivity on Mobile
N/A
N/A
Score 10 out of 10
Vetted Review
Verified User
Incentivized
Budgeting, Planning, and Forecasting (5)
96%
9.6
Long-term financial planning
100%
10.0
Financial budgeting
100%
10.0
Forecasting
100%
10.0
Scenario modeling
100%
10.0
Management reporting
80%
8.0
Consolidation and Close (7)
98.57142857142858%
9.9
Financial data consolidation
100%
10.0
Journal entries and reports
100%
10.0
Multi-currency management
100%
10.0
Intercompany Eliminations
100%
10.0
Minority Ownership
90%
9.0
Local and consolidated reporting
100%
10.0
Detailed Audit Trails
100%
10.0
Financial Reporting and Compliance (4)
87.5%
8.8
Financial Statement Reporting
90%
9.0
Management Reporting
90%
9.0
Excel-based Reporting
90%
9.0
Automated board and financial reporting
80%
8.0
Analytics and Reporting (6)
90%
9.0
Personalized dashboards
90%
9.0
Color-coded scorecards
90%
9.0
KPIs
90%
9.0
Cost and profitability analysis
90%
9.0
Key Performance Indicator setting
100%
10.0
Benchmarking with external data
80%
8.0
Integration (3)
96.66666666666666%
9.7
Flat file integration
100%
10.0
Excel data integration
90%
9.0
Direct links to 3rd-party data sources
100%
10.0
BI Standard Reporting (3)
93.33333333333334%
9.3
Pixel Perfect reports
100%
10.0
Customizable dashboards
90%
9.0
Report Formatting Templates
90%
9.0
Ad-hoc Reporting (3)
100%
10.0
Drill-down analysis
100%
10.0
Formatting capabilities
100%
10.0
Report sharing and collaboration
100%
10.0
Report Output and Scheduling (3)
76.66666666666667%
7.7
Publish to PDF
100%
10.0
Report Versioning
60%
6.0
Report Delivery Scheduling
70%
7.0
Data Discovery and Visualization (3)
56.66666666666667%
5.7
Pre-built visualization formats (heatmaps, scatter plots etc.)
50%
5.0
Location Analytics / Geographic Visualization
60%
6.0
Predictive Analytics
60%
6.0
Access Control and Security (5)
80%
8.0
Multi-User Support (named login)
100%
10.0
Role-Based Security Model
100%
10.0
Multiple Access Permission Levels (Create, Read, Delete)
100%
10.0
Report-Level Access Control
N/A
N/A
Single Sign-On (SSO)
100%
10.0
Mobile Capabilities (1)
30%
3.0
Dashboard / Report / Visualization Interactivity on Mobile
30%
3.0
Score 8 out of 10
Vetted Review
Verified User
Budgeting, Planning, and Forecasting (5)
72%
7.2
Long-term financial planning
80%
8.0
Financial budgeting
70%
7.0
Forecasting
70%
7.0
Scenario modeling
70%
7.0
Management reporting
70%
7.0
Consolidation and Close (4)
75%
7.5
Financial data consolidation
80%
8.0
Intercompany Eliminations
80%
8.0
Local and consolidated reporting
70%
7.0
Detailed Audit Trails
70%
7.0
Financial Reporting and Compliance (4)
75%
7.5
Financial Statement Reporting
70%
7.0
Management Reporting
70%
7.0
Excel-based Reporting
80%
8.0
Automated board and financial reporting
80%
8.0
Analytics and Reporting (6)
80%
8.0
Personalized dashboards
80%
8.0
Color-coded scorecards
80%
8.0
KPIs
80%
8.0
Cost and profitability analysis
80%
8.0
Key Performance Indicator setting
80%
8.0
Benchmarking with external data
80%
8.0
Integration (3)
80%
8.0
Flat file integration
90%
9.0
Excel data integration
90%
9.0
Direct links to 3rd-party data sources
60%
6.0
BI Standard Reporting (3)
46.66666666666667%
4.7
Pixel Perfect reports
50%
5.0
Customizable dashboards
40%
4.0
Report Formatting Templates
50%
5.0
Ad-hoc Reporting (3)
50%
5.0
Drill-down analysis
50%
5.0
Formatting capabilities
50%
5.0
Report sharing and collaboration
50%
5.0
Report Output and Scheduling (4)
57.5%
5.8
Publish to Web
50%
5.0
Publish to PDF
80%
8.0
Report Versioning
50%
5.0
Report Delivery Scheduling
50%
5.0
Data Discovery and Visualization (3)
50%
5.0
Pre-built visualization formats (heatmaps, scatter plots etc.)
50%
5.0
Location Analytics / Geographic Visualization
50%
5.0
Predictive Analytics
50%
5.0
Access Control and Security (4)
75%
7.5
Multi-User Support (named login)
80%
8.0
Role-Based Security Model
70%
7.0
Multiple Access Permission Levels (Create, Read, Delete)
70%
7.0
Single Sign-On (SSO)
80%
8.0
Mobile Capabilities
N/A
N/A
Score 10 out of 10
Vetted Review
Verified User
Budgeting, Planning, and Forecasting (5)
94%
9.4
Long-term financial planning
100%
10.0
Financial budgeting
100%
10.0
Forecasting
100%
10.0
Scenario modeling
90%
9.0
Management reporting
80%
8.0
Consolidation and Close (7)
100%
10.0
Financial data consolidation
100%
10.0
Journal entries and reports
100%
10.0
Multi-currency management
100%
10.0
Intercompany Eliminations
100%
10.0
Minority Ownership
100%
10.0
Local and consolidated reporting
100%
10.0
Detailed Audit Trails
100%
10.0
Financial Reporting and Compliance (4)
87.5%
8.8
Financial Statement Reporting
90%
9.0
Management Reporting
90%
9.0
Excel-based Reporting
90%
9.0
Automated board and financial reporting
80%
8.0
Analytics and Reporting (6)
100%
10.0
Personalized dashboards
100%
10.0
Color-coded scorecards
100%
10.0
KPIs
100%
10.0
Cost and profitability analysis
100%
10.0
Key Performance Indicator setting
100%
10.0
Benchmarking with external data
100%
10.0
Integration (3)
100%
10.0
Flat file integration
100%
10.0
Excel data integration
100%
10.0
Direct links to 3rd-party data sources
100%
10.0
BI Standard Reporting (3)
86.66666666666666%
8.7
Pixel Perfect reports
80%
8.0
Customizable dashboards
90%
9.0
Report Formatting Templates
90%
9.0
Ad-hoc Reporting (3)
100%
10.0
Drill-down analysis
100%
10.0
Formatting capabilities
100%
10.0
Report sharing and collaboration
100%
10.0
Report Output and Scheduling (4)
90%
9.0
Publish to Web
80%
8.0
Publish to PDF
100%
10.0
Report Versioning
80%
8.0
Report Delivery Scheduling
100%
10.0
Data Discovery and Visualization (3)
90%
9.0
Pre-built visualization formats (heatmaps, scatter plots etc.)
90%
9.0
Location Analytics / Geographic Visualization
90%
9.0
Predictive Analytics
90%
9.0
Access Control and Security (4)
100%
10.0
Multi-User Support (named login)
100%
10.0
Role-Based Security Model
100%
10.0
Multiple Access Permission Levels (Create, Read, Delete)
100%
10.0
Single Sign-On (SSO)
100%
10.0
Mobile Capabilities (2)
80%
8.0
Responsive Design for Web Access
80%
8.0
Dashboard / Report / Visualization Interactivity on Mobile
80%
8.0
Return to navigation