


49 Shocking Business Intelligence Statistics for 2021
Worldwide data creation will grow to 63 zettabytes (ZB) by 2025. For scale, that is about 500 billion iPhones worth of storage. In light of this explosive growth, business intelligence tools are more important than ever.
At the same time, individuals have serious data literacy and trust issues. Companies urgently need better data implementation. These challenges have been exacerbated by explosive data growth.
As the BI market continues to evolve, these statistics show how vital business intelligence tools will continue to be in a data-driven world.
Click on a Section to Explore:
10 Shocking Business Intelligence Statistics for 2021
- The BI market size is projected to reach $39.35 billion by 2027. (Fortune Business Insights, 2019)
- The global BI adoption rate across all organizations is 26%. (360Suite 2021)
- 74% of employees report feeling overwhelmed or unhappy when working with data. (Accenture 2020)
- 50% of teams and customers are more likely to use Business Intelligence tools after the pandemic compared to before. (Sisense 2020)
- Lack of data literacy costs the US economy more than $100 Billion a year. (Accenture 2020)
- Only 27% of business executives said their data and analytics projects produce actionable insights. (Accenture 2020)
- Microsoft Power BI is the leading BI software in 2021, commanding 36% of the market share. (TrustRadius 2021)
- The average business uses an average of 3.8 different BI solutions. (360Suite 2021)
- 67% of the global workforce have access to business intelligence tools. (Accenture 2020)
- 60-73% of all enterprise data is never analyzed. (Accenture 2020)
Business Intelligence Market Size in 2021

- The global business intelligence market size was $20.60 billion in 2019. (Fortune Business Insights, 2019)
- BI market size is projected to reach $39.35 billion by 2027. (Fortune Business Insights, 2019)
- The projected compound annual growth rate (CAGR) for BI is 8.5%. (Fortune Business Insights, 2019)
Who’s Winning BI Software Market Share in 2021?
Over 1.2 million software buyers use TrustRadius each month. Many of them are shopping for business intelligence software—so we took a closer look at our data to see which products attract the most attention.
According to buyer interest, the top 9 leaders in today’s BI market are:
- Microsoft Power BI
- Tableau Desktop
- Qlik Sense
- SAP Analytics Cloud
- IBM Cognos Analytics
- Looker
- MictroStrategy Analytics
- Sisense
- Oracle Analytics Server
Out of those companies, we’re seeing clear winners when it comes to market share:

- Microsoft Power BI is the most-compared BI software in 2021. (TrustRadius 2021)
- Microsoft Power BI is the leading BI software in 2021, commanding 36% of the market share. (TrustRadius 2021)
- Tableau Desktop only commands 20% of the BI market share in 2021. (TrustRadius 2021)
- BI buyers spend most of their time comparing Microsoft Power BI to SAP Business Objects Platform. (TrustRadius 2021)

Business Intelligence in a Post-Covid World

- 50% of teams and customers are more likely to use Buisiness Intelligence tools after the pandemic compared to before. (Sisense 2020)
- 55% of teams are maintaining BI spending following the pandemic. (Sisense 2020)
- 10% of teams plan to increase their BI budget in 2021. (Sisense 2020)
- 14% of teams are cutting back their BI budget in 2021. (Sisense 2020)
- 21% of teams are unsure of how their BI budget will change in 2021. (Sisense 2020)
Business Intelligence Usage Statistics

- 49% of employees said analytics were more or much more important than ever. (Accenture 2020)
- Lack of data literacy costs the US economy more than $100 Billion a year. (Accenture 2020)
- 60-73% of all enterprise data is never analyzed. (Accenture 2020)
- Only 32 % of business executives surveyed said that they’re able to create measurable value from data. (Accenture 2020)
- Only 27% of business executives said their data and analytics projects produce actionable insights. (Accenture 2020)
Limitations of Employee Data Literacy

- 21% of the global workforce are fully confident in their data literacy skills. (Accenture 2020)
- 74% of employees report feeling overwhelmed or unhappy when working with data. (Accenture 2020)
- 14% of employees report feeling overwhelmed when working with data at least once each day. (Accenture 2020)
- 48% of employees feel overwhelmed working with data at least once per week. (Accenture 2020)
- Companies lose an average of more than five working days (43 hours) per employee each year when accounting for data-induced procrastination and sick leave due to stress resulting from information, data and technology issues. (Accenture 2020)
How is Business Intelligence Used?

- Only 37%of employees trust their decisions more when those decisions are based on data. (Accenture 2020)
- 48% of employees frequently defer to making decisions based on gut feeling over data-driven insight (Accenture 2020)
- 67% of the global workforce have access to business intelligence tools. (Accenture 2020)
- 75% of the global workforce have access to data analytics software. (Accenture 2020)
- 47% of people believe their company is properly resourced to deliver data driven insights. 42% say their company is not. (Sisense 2020)
Shocking Problems with Business Intelligence

- 34% of BI companies believe poor data quality to be a major issue for their customers. Only 11% of BI customers believe this. (Bi-Survey.com 2021)
- 16% of BI customers believe slow query performance is a major issue. 11% of BI Vendors believe this to be an issue for their customers. (Bi-Survey.com 2021)
- 39% of users find no major issues with their BI software. 22% of vendors expect no major issues for users. (Bi-Survey.com 2021)
- 21% of BI companies worry about poor data governance being a major issue for their customers.12% of customers worry about this issue. (Bi-Survey.com 2021)
Different Types of BI Tools

- The average company uses 3.8 different BI solutions. (360Suite 2021)
- 48% of organizations say creating a centrally-managed BI team is coming in the near future. (360Suite 2021)
- 67% of employees have access to multiple Business Intelligence solutions within their organization. (360Suite 2021)
- 55% of employees say that their BI solutions connect and query the same data sources. (360Suite 2021)
- The global BI adoption rate across all organizations is 26%. (360Suite 2021)
- 28% of organizations want to reduce the number of BI solutions. 29% want to keep their BI Portfolio as-is, and 15% are planning to add more BI solutions. (360Suite 2021)
- 35% of those who started embedding analytics into their products are likely or very likely to move to the cloud. (Sisense 2020)
Breaking Business Intelligence Funding News
The COVID-19 pandemic caused a massive increase in investment for the business intelligence market. The crisis instantly changed how companies interact with their data and their employees. This created demand for BI tools to address the challenges of the pandemic.
PatSnap is an example of an organization that is thriving, and not just for a BI company. PatSnap is one of the 8 fastest growing firms in southeast asia. The company raised a whopping $300 million. Their explosive adoption and innovation of AI and machine learning is allowing this company to grow quickly in this market.
BI is also expanding beyond of its historic roots. Companies like EightFold AI and Visier are outside the traditional BI sphere, but see its elements applied to their use cases. These are examples of the expanding utility and scope resulting from the BI market.
Eightfold AI raised $220 million, raising its total to $410 million. The company works in talent training, acquisition, and retention—all areas that were seriously impacted by Covid-19.
Eightfold AI CEO and founder Ashutosh Garg said the company has “an unprecedented opportunity, using AI to align the career goals of individuals while simultaneously creating better results for employers”.
Visier raised $125 million, for its focus on workforce analytics. The company plans to use this money for expanding its own team. The CEO remarked on how the company is able to use its own tools to make this hiring process happen.
Business Intelligence Trends for 2021

The BI market is booming in 2021, and that’s creating rapid innovation. The biggest BI trends today relate to mobile BI, huge increases in the amount of data, and data automation.
Mobile BI
The pandemic accelerated the trend to mobile and remote work environments. new technologies, including more powerful mobile devices, are making BI on-the-go feasible in more fields. Retail and eCommerce will lead this charge in 2021.
Data Growth
As data volumes explode across the world, we’re seeing major changes in the BI market. Companies already find the sheer volume of data difficult to manage. With exponential data increases every year, we expect BI vendors to respond by rapidly addressing customer challenges and capitalizing on the new opportunity.
Data Automation
Data automation continues to be the most exciting and influential change in the BI market over the past decade. BI vendors use a variety of automation tools to clean up, transform, and transpose information. This functionality is fast expanding into other areas and allowing non-specialists to more effectively make use of information. This trend has the potential to help address emerging problems and improve BI efficiency.
Your Guide to BI Pricing in 2021
| Product | Starting Price | Free Trial | Free or Fremium | Premium Services | Setup Fee |
| Microsoft Power BI | $9.99 | None | |||
| Tableau Desktop | $70 | None | |||
| Qlik Sense | $30 | None | |||
| SAP Analytics Cloud | $36 | None | |||
| IBM Cognos Analytics | $15 | Optional | |||
| Looker | Contact vendor | None | |||
| MicroStrategy Analytics |
Contact vendor | None | |||
| Sisense | Contact vendor | None | |||
| Oracle Analytics Server |
Contact vendor | None |
Business intelligence software can be complex, as can its implementation. These companies did the best at satisfying their customers in the implementation of their tools:
- 80 % of Tableau Desktop users said implementation went as expected. (TrustRadius 2021)
- 84% of Looker users said implementation went as expected. (TrustRadius 2021)
- In contrast, 67% of Microsoft Power BI users said implementation went as expected. (TrustRadius 2021)
- 75% of SAP Analytics Cloud users said implementation went as expected. (TrustRadius 2021)
If you’re looking for your next business intelligence solution, check out reviews on TrustRadius. You’ll see 100% authentic reviews from buyers just like you.
Sources
- Business Intelligence Market Size, Share & COVID-19 Impact Analysis (Fortune Business Insights 2019)
- BI Trends 2020 (360Suite 2021)
- State of Analytics Report (Sisense 2020)
- Accenture: Human Impact of Data Literacy (Accenture 2020)
- BI insights (Bi-Survey.com 2021)
- SeaGate Data Age 2025 (Seagate 2021)
- 49 Business Intelligence Statistics for 2021(TrustRadius 2021)
Previous BI Research From 2020
Companies have stabilized their software spending plans for the rest of 2020 after several months of turbulence. As near-term plans become more concrete, businesses are shifting their focus away from COVID-19 adjustments towards long-term strategy and planning. The graph below shows expected increases in spending in March, followed by expected spending cuts in April and largely no change to spending as of May.

Now that the initial shock of the pandemic is over, business intelligence technologies are returning to the forefront as crucial tools for mid to long term planning. Below we’re diving into the impact that COVID-19 had on business intelligence tools and exploring the historical and real-time trends of this pivotal market— including the most popular BI tools to date and the long-standing race between Microsoft and Tableau.
Quick Access
Historical Interest in Business Intelligence Tools
Business intelligence has been an in-demand technology for large businesses and enterprises long before COVID-19. This demand has generated sustained search interest for the term “business intelligence” for well over a year according to data from Google Trends, barring seasonal dips in search activity around the holidays.
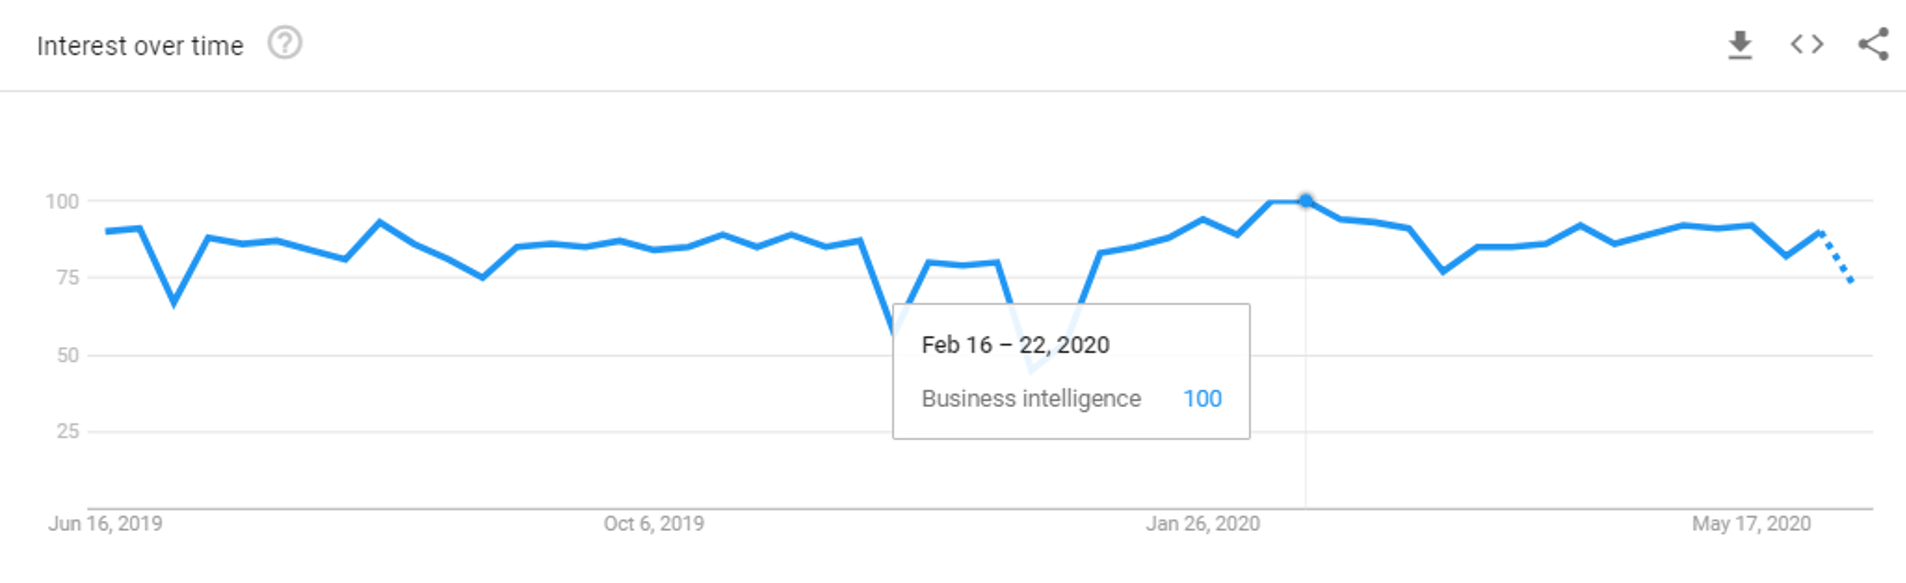
According to Google Trends, search interest in business intelligence peaked in late February. Since then, the COVID-19 pandemic reorganized companies’ short term priorities and resulted in a slight dip in interest in March and April. However, This COVID “trough” was within regular variation for “business intelligence” search terms within the last year. As search interest picked up again leading into May, business intelligence software’s value proposition has remained robust even as businesses experience unprecedented instability and uncertainty.
The Growth of Business Intelligence on TrustRadius
While Google Trends shows relatively consistent market interest in business intelligence over the past year, the category has been growing rapidly on TrustRadius since the beginning of 2020. Traffic to TrustRadius experienced a slight dip in traffic similar to the broader market during the COVID transition period. After that period in March, traffic to the BI category on TrustRadius continued to grow. In the first 6 months of 2020, since the beginning of January, we’ve seen a 324% increase in BI traffic.
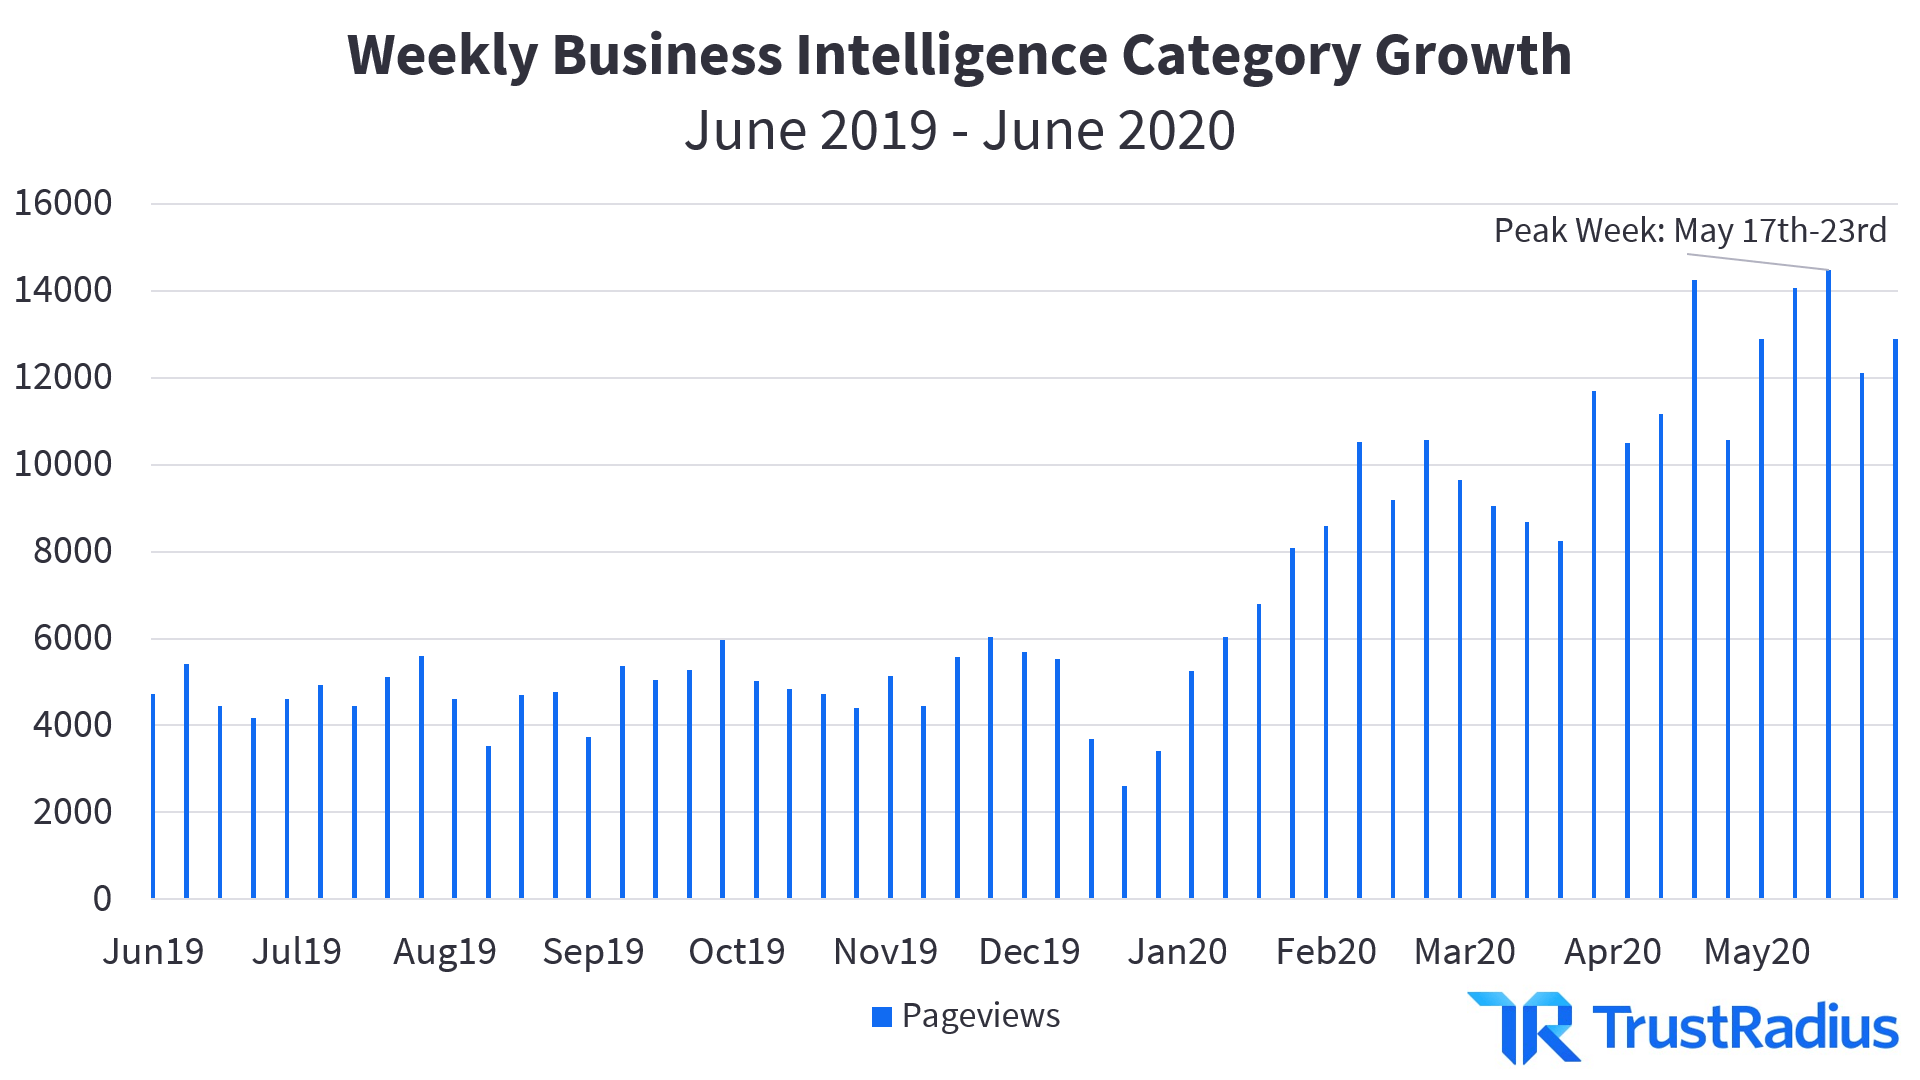
Looking more long-term, traffic to the business intelligence category on TrustRadius has increased over 2X year over year. Much of that growth has emerged since early January. Traffic has more than recovered from the initial COVID-19 slump that business intelligence tools experienced market-wide. The highest weekly BI traffic to date was in late May, with 14,488 pageviews in that week alone.
The initial growth in traffic to the business intelligence category prior to COVID-19, and its rapid recovery, can be attributed to TrustRadius’s investment in SEO and improvements in category coverage. Over the past year, we have invested heavily in ensuring our user reviews, dynamic comparisons, product descriptions, feature lists and ratings, and pricing information are high-quality, in-depth, and immediately useful to software buyers. Google rewards this quality content with higher SERP rankings and featured snippets like the example shown below. This, combined with other content initiatives and technical SEO strategies, results in increased traffic to the BI category and our site as a whole.
Who’s in the Market for Business Intelligence Tools?
Based on True Intent signals, we identified trends among the companies that are most actively researching business intelligence. The majority of BI-related visits to the TrustRadius site since the beginning of 2020 (January 1st to May 30th) were from enterprise buyers.
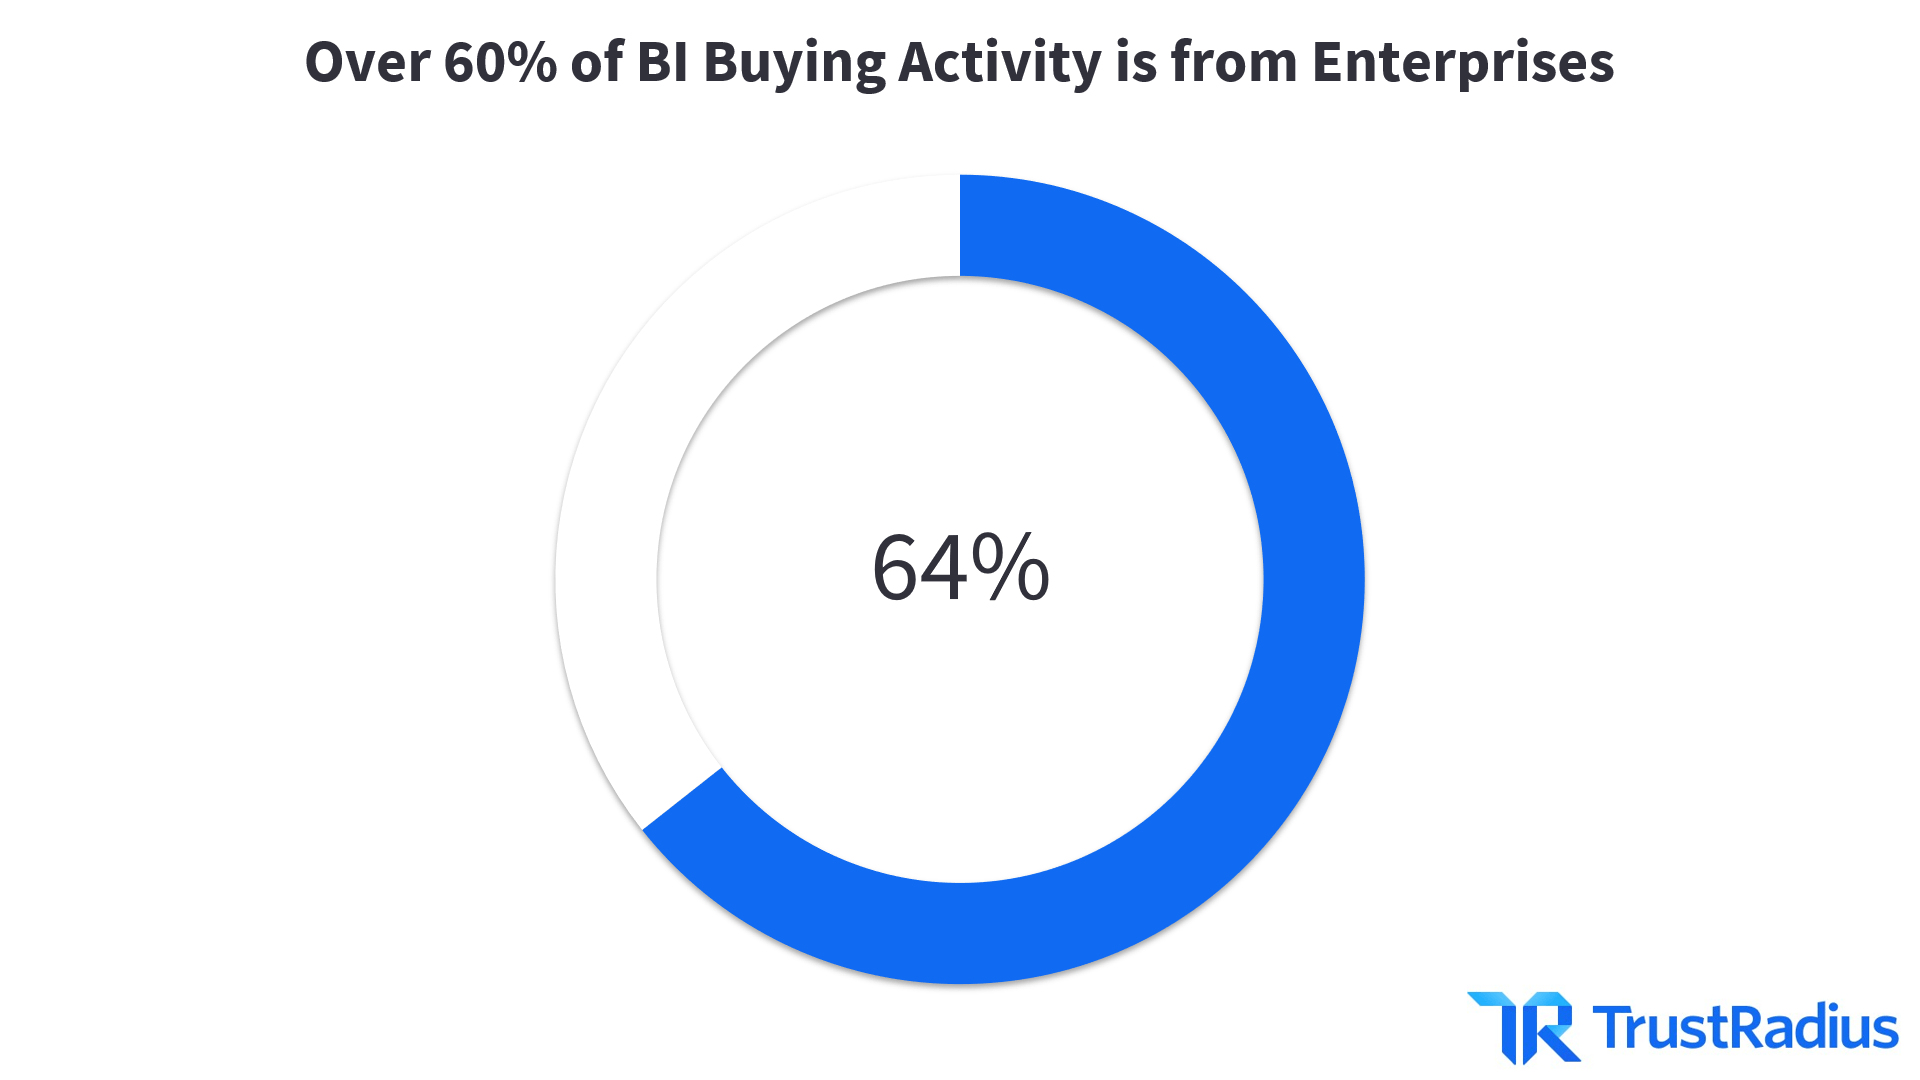
The large enterprise market share reflects a historical focus on enterprise customers within the business intelligence space. BI tools were traditionally very heavy, intensive products to deploy and manage. In the past, BI frequently required IT resources to maintain the software and data structures used. Larger companies were also the first to have to work with exceptionally large amounts of data creating a greater need for BI tools in the enterprise space than among SMBs.
However, as data collection and integration methods have improved over time, smaller companies have begun working with larger data loads and required better tools for analyzing and reporting on it. That's why we now see small businesses and mid-sized companies making up 40% of the visits to our BI category.
To serve this audience, some BI vendors like SAP Crystal and Sisense have made their offerings more accessible to smaller companies. This trend gives rise to self-service business intelligence tools, which are designed to be accessible to non-technical users. This capability allows business users to utilize data-based decision-making without IT bottlenecks. Following the pandemic transition phase, we have seen rapid growth in SMB buying activity on TrustRadius in the last two months.
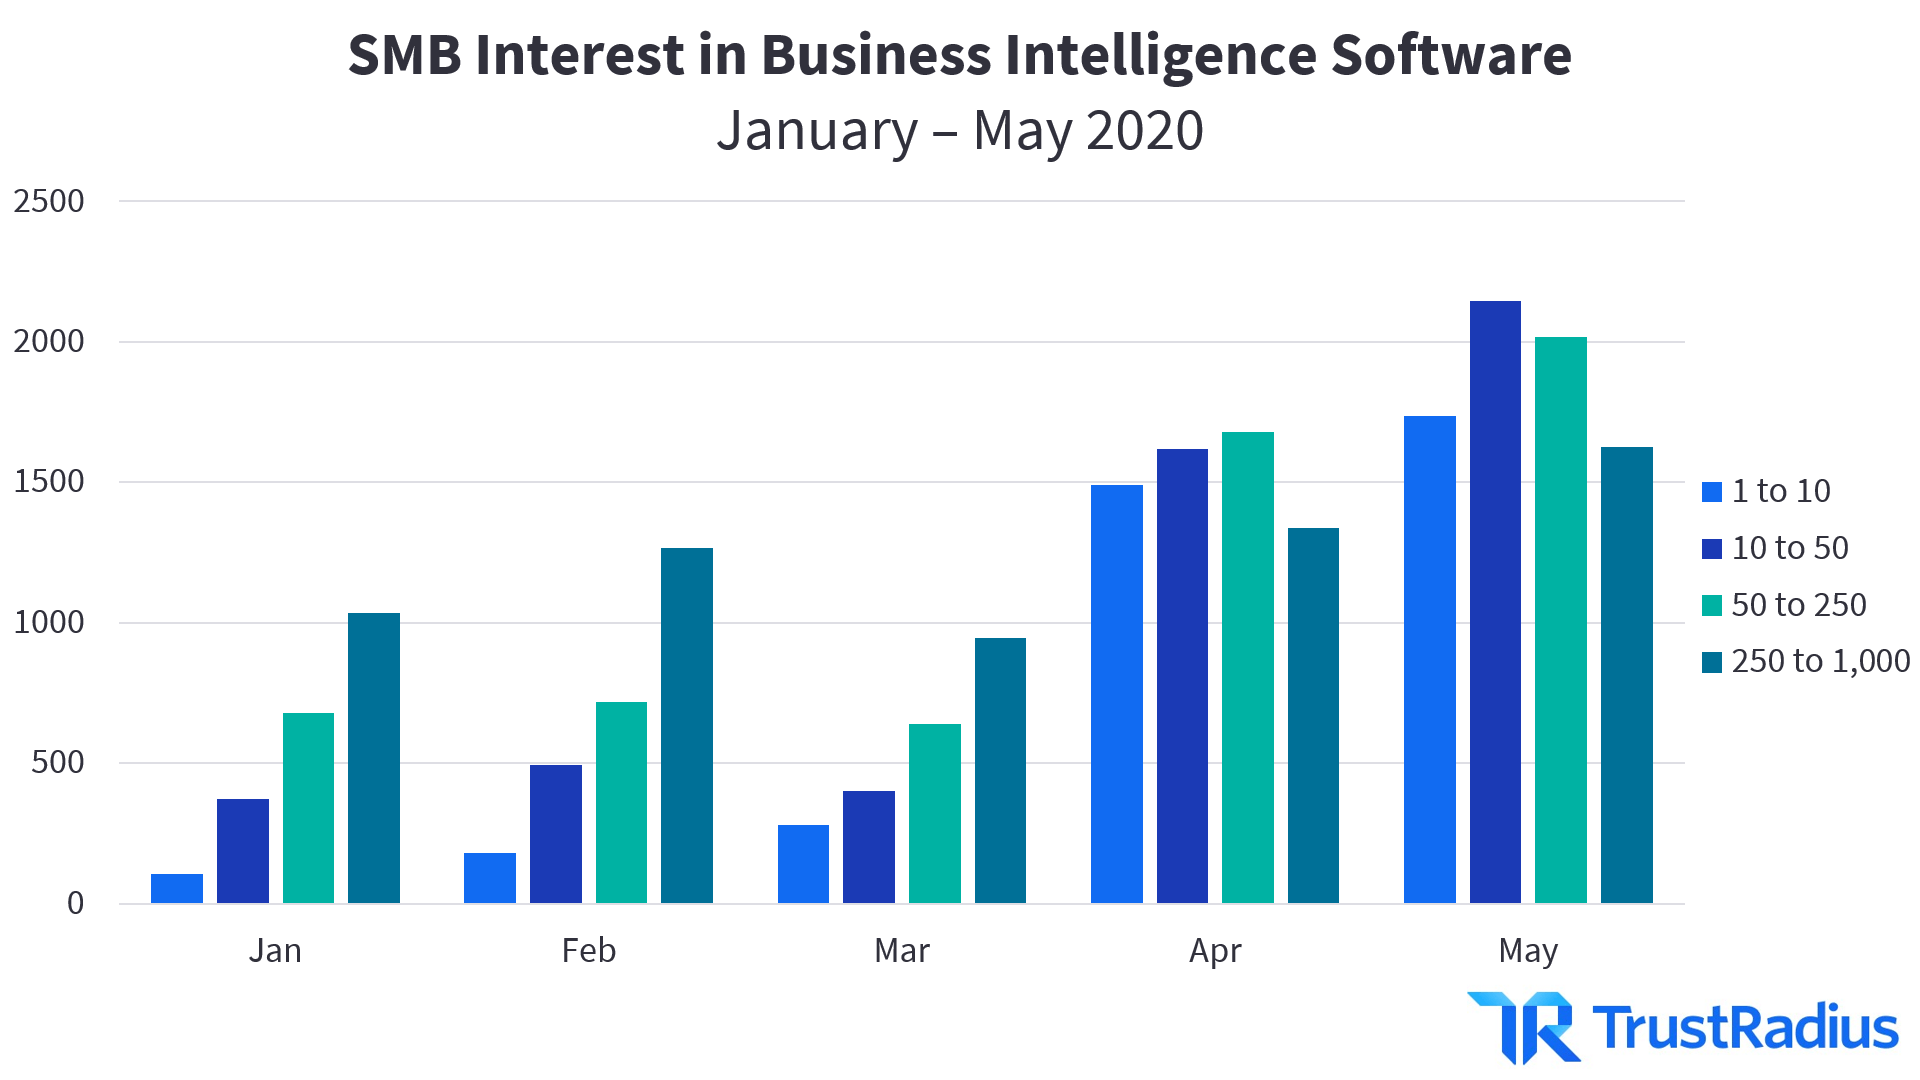
The rising buyer activity among SMBs is likely caused by several factors. Over the long-term, business intelligence tools are much more accessible than they used to be. Improved accessibility stems largely from the normalization of cloud-based BI, which requires far less maintenance from users and can be more cost-effective. The more recent growth may also be attributable to growing SMB concerns about their resilience through unpredictable economic winds. They may now place higher value in business intelligence in a post-COVID era in order to better plan and adapt to rapidly shifting economic circumstances.
Top Tools in Today’s Business Intelligence Market
Today’s top BI tools are led by a couple key giants in the market. There is a more competitive field beyond the top few vendors, with a range of niche players. The business intelligence category leader on TrustRadius in the post-COVID era is Microsoft Power BI, which currently accounts for 19.8% of category traffic. Tableau Desktop follows on Microsoft’s heels, with 11% of the traffic. The rest of the field is more evenly distributed, with no product claiming more than 7% of category traffic.
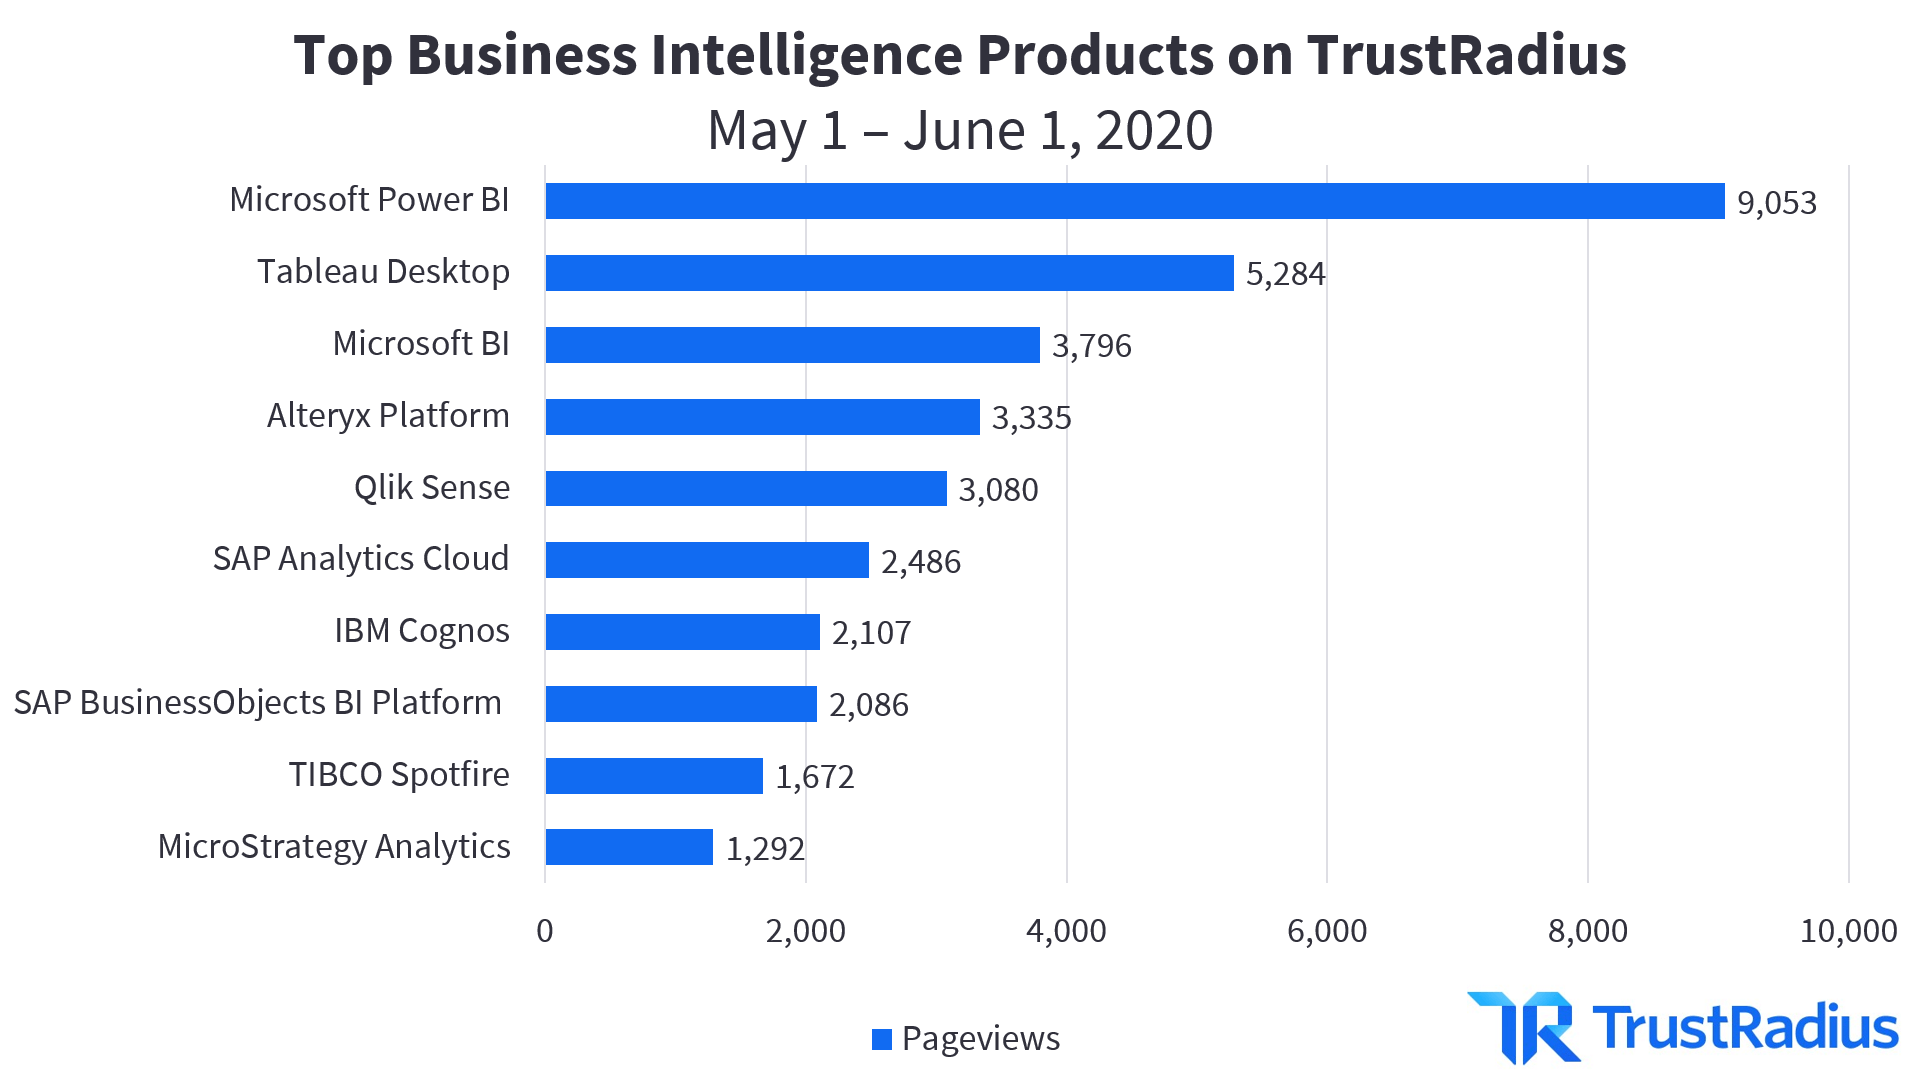
| Top Business Intelligence Products | Pageviews |
| Microsoft Power BI | 9,053 |
| Tableau Desktop | 5,284 |
| Microsoft BI | 3,796 |
| Alteryx Platform | 3,335 |
| Qlik Sense | 3,080 |
| SAP Analytics Cloud | 2,486 |
| IBM Cognos | 2,107 |
| SAP BusinessObjects Business Intelligence (BI) Platform | 2,086 |
| TIBCO Spotfire | 1,672 |
| MicroStrategy Analytics | 1,292 |
Beyond Microsoft and Tableau, BI vendors specialize in a variety of ways that help explain the wide distribution of market share. Some, like SAP, TIBCO, and IBM, trade on enterprises’ ability to source most or all of their software needs from a single vendor’s ecosystem and scale more efficiently. Others focus on certain capabilities or usability advantages. For instance, Qlik reviewers highlight its support for self-service BI, and Alteryx specializes in its data preparation capabilities.
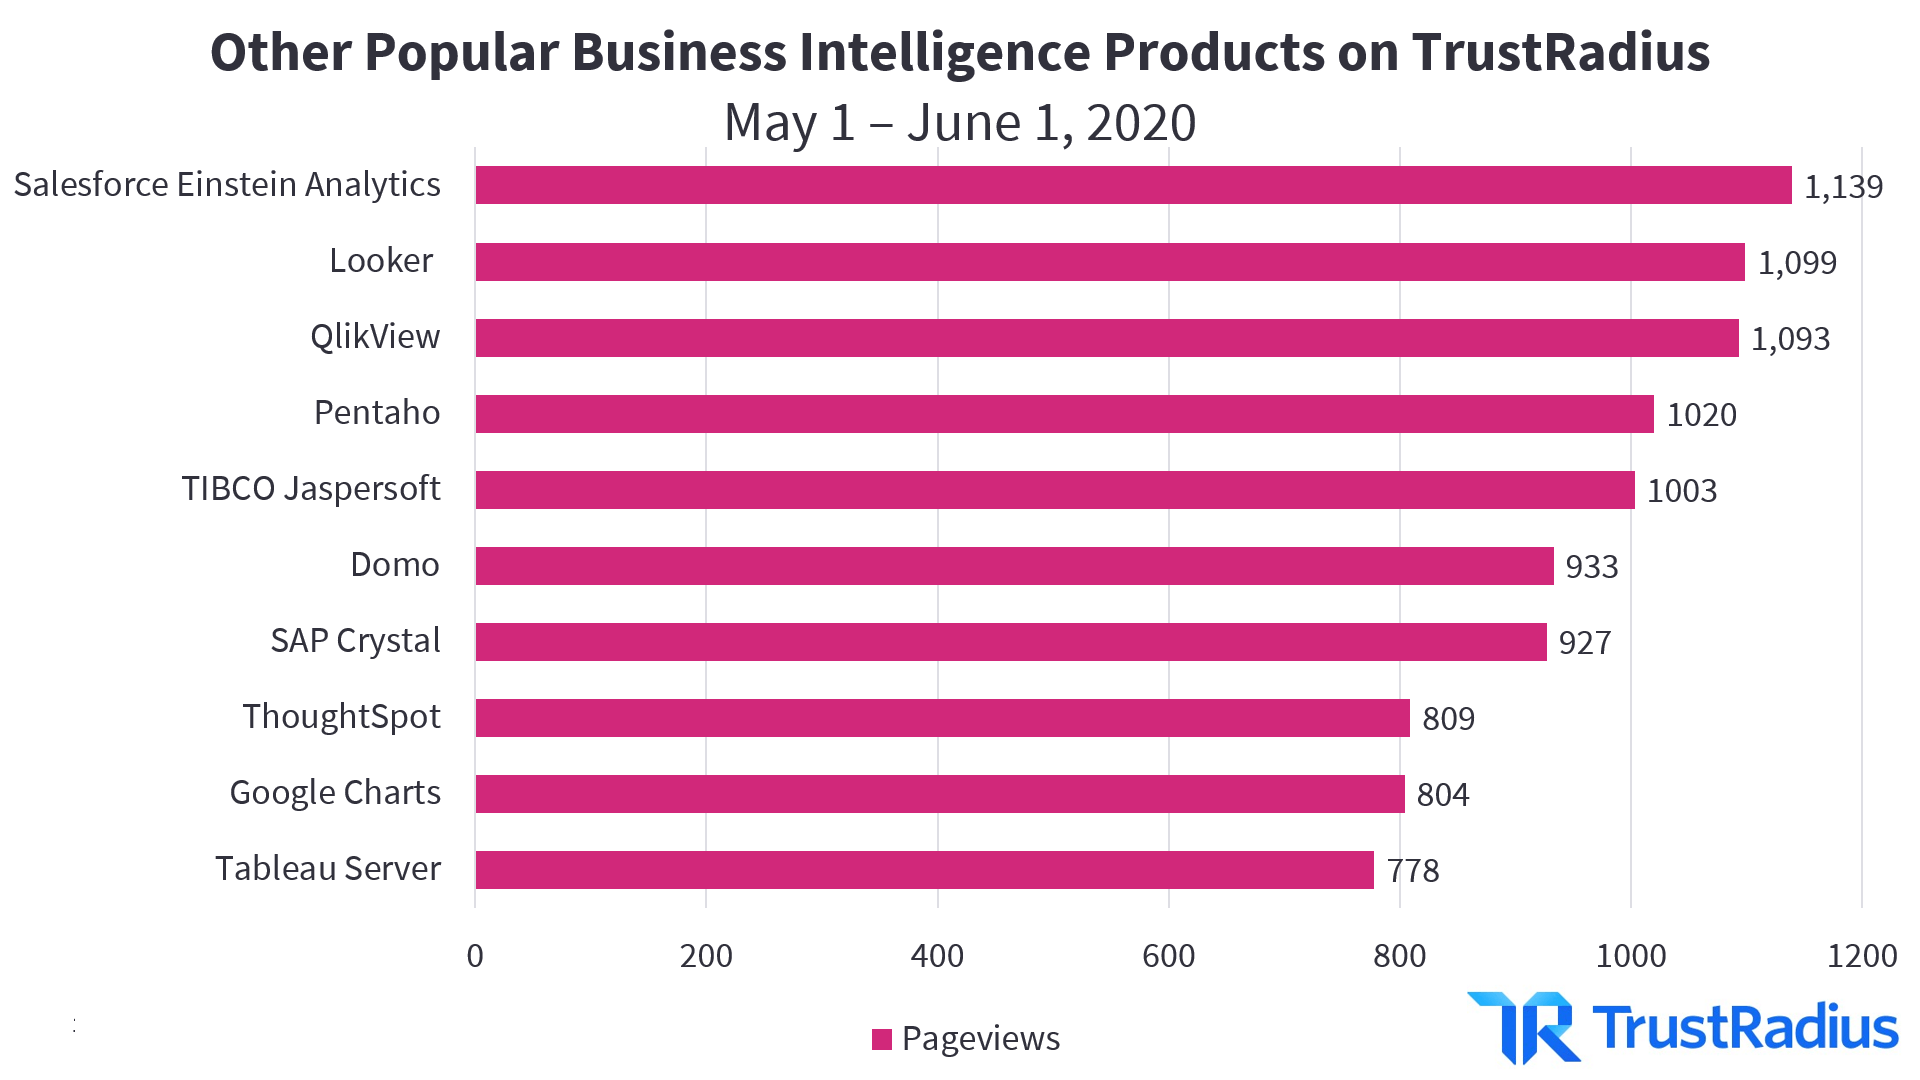
Business Intelligence is a Crowded Space
Unlike other categories where interest is concentrated only in the top 5 products, the TrustRadius BI category receives widespread monthly interest across a wider variety of players. The 11-20th most popular products speak to more niche use cases and business environments. Some, like Salesforce Einstein Analytics and Google Charts, cater to the desire for “all in one vendors” that serve a range of software needs, from CRM capabilities to collaboration technology. Google Charts also speaks to the market’s efforts to make business intelligence more accessible to SMB users. Other products, like Looker, Domo, and ThoughtSpot, stand out as point BI solutions for businesses looking for a standalone BI platform.
Microsoft vs. Tableau
The two most ubiquitous names in the business intelligence space, Microsoft and Tableau, have been contesting the top spot for years. Recent traffic data would suggest that Microsoft Power BI is leaps and bounds above Tableau Desktop. However, a long-term view of the data shows that this is a more recent change. Over the past year, Tableau Desktop and Microsoft Power BI were fairly neck and neck until a large spike in traffic in January put Microsoft ahead.
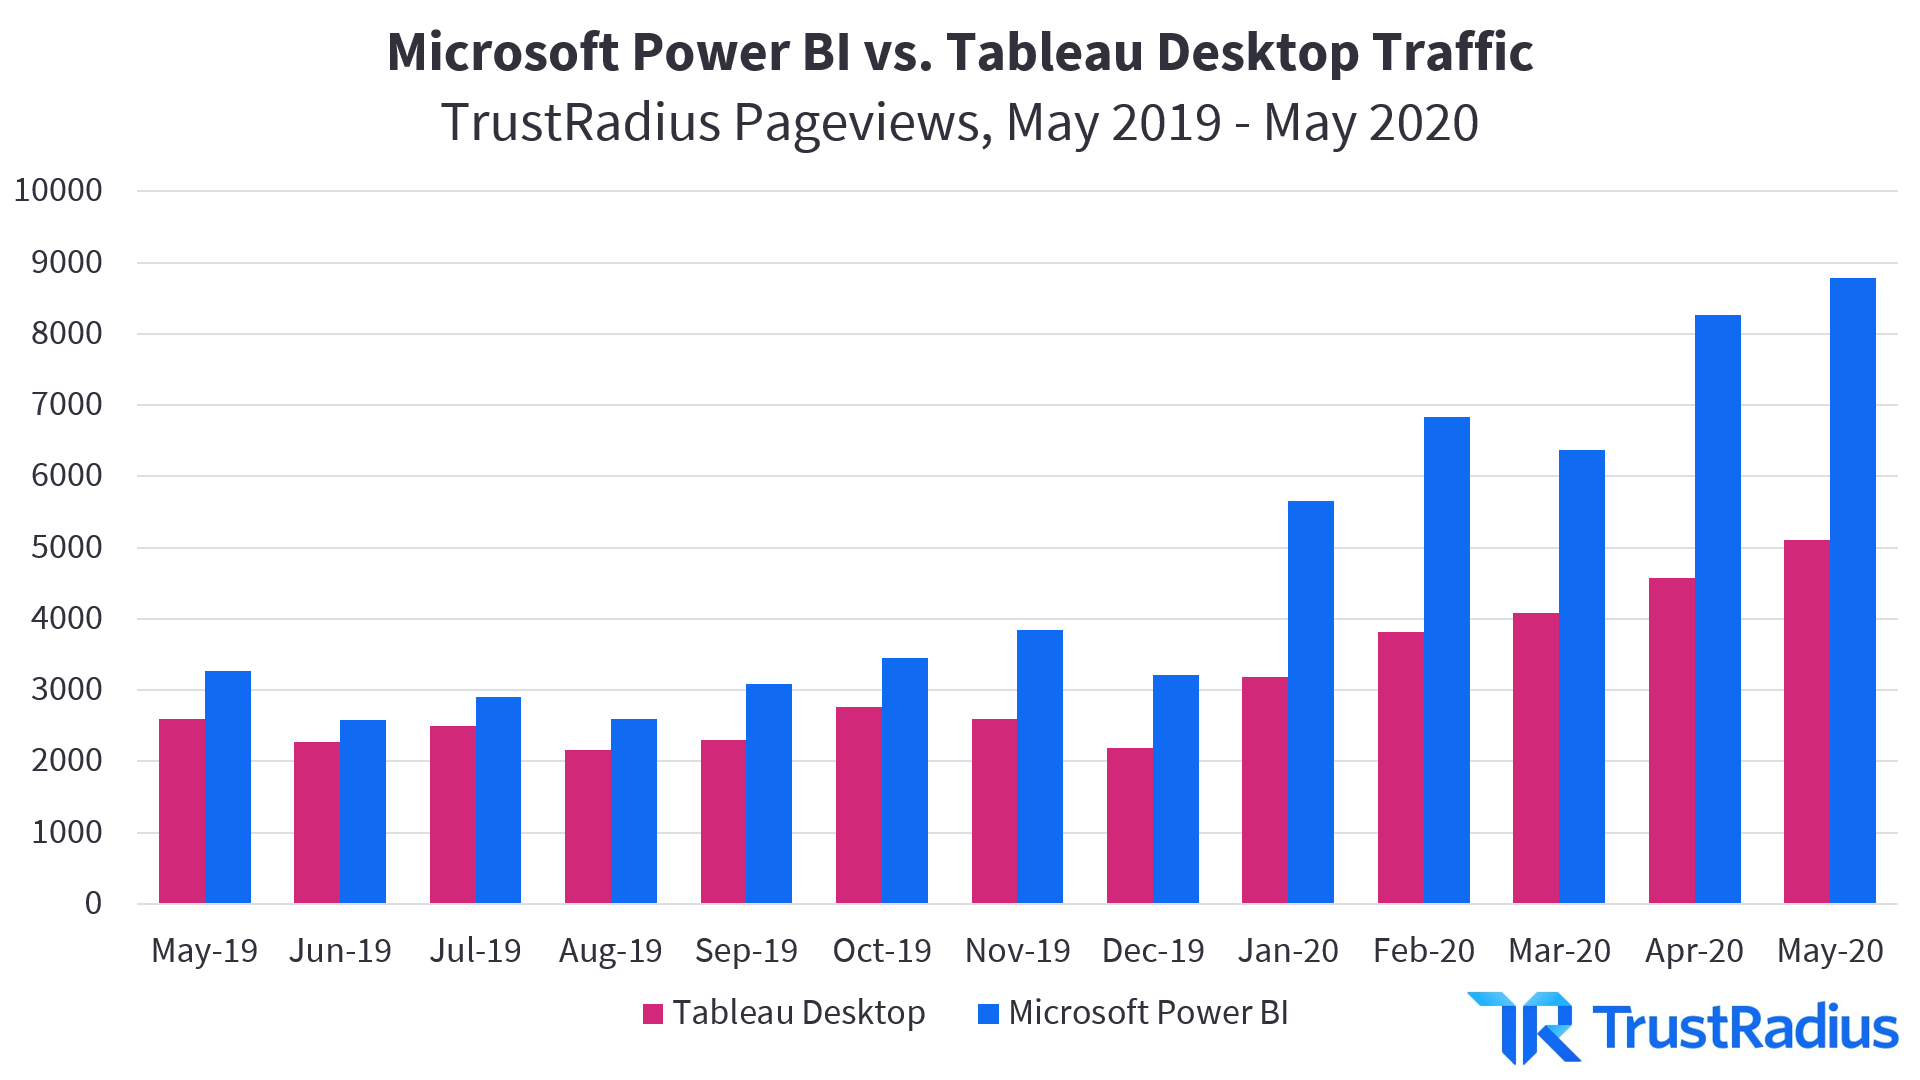
There is a range of potential explanations for this breakaway interest in Power BI. On one hand, Microsoft Power BI is often perceived as a more accessible tool for companies below the “large enterprise” level and those who already live in a Microsoft 365 ecosystem. Power BI reviewers point to pricing as one key differentiator, as well as how easily Power BI integrates into and works with other Microsoft products. Especially for smaller organizations, unifying as many applications and systems under one vendor as possible can make management and training on their BI tool much easier.
However, Tableau still stands as a strong competitor against Microsoft Power BI. Many reviewers argue that Tableau is more scalable for large enterprises. This scalability manifests itself in features like a higher number of data inputs and sources the platform can handle. Some reviewers also point to superior support as a competitive advantage for Tableau.
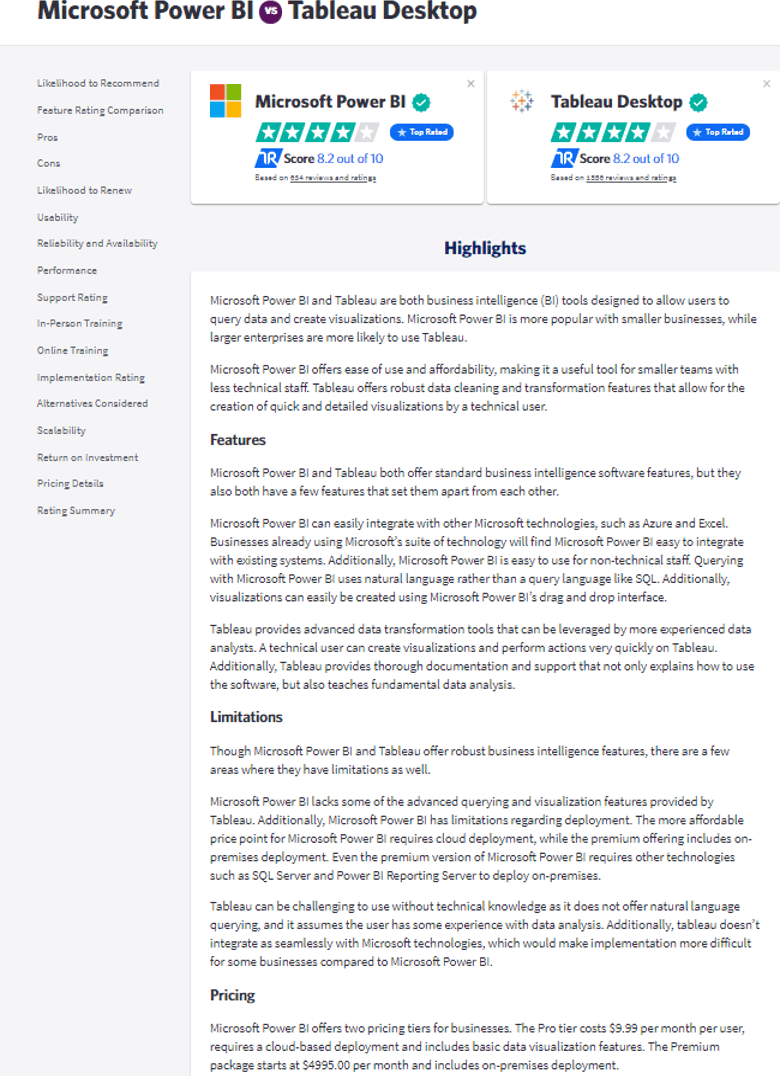
Buyers can conduct a side-by-side comparison of the Microsoft Power BI vs. Tableau Desktop here.
Top Business Intelligence Product Comparisons
Microsoft’s market presence is also demonstrated by its near-universal participation among the top comparisons for BI tools on the TrustRadius platform. Microsoft Power BI is featured in 8 of the 10 most popular BI comparisons. Being used as a defacto comparison point with other products in the market shows that Power BI has visibility that other products (including Tableau) may not have.
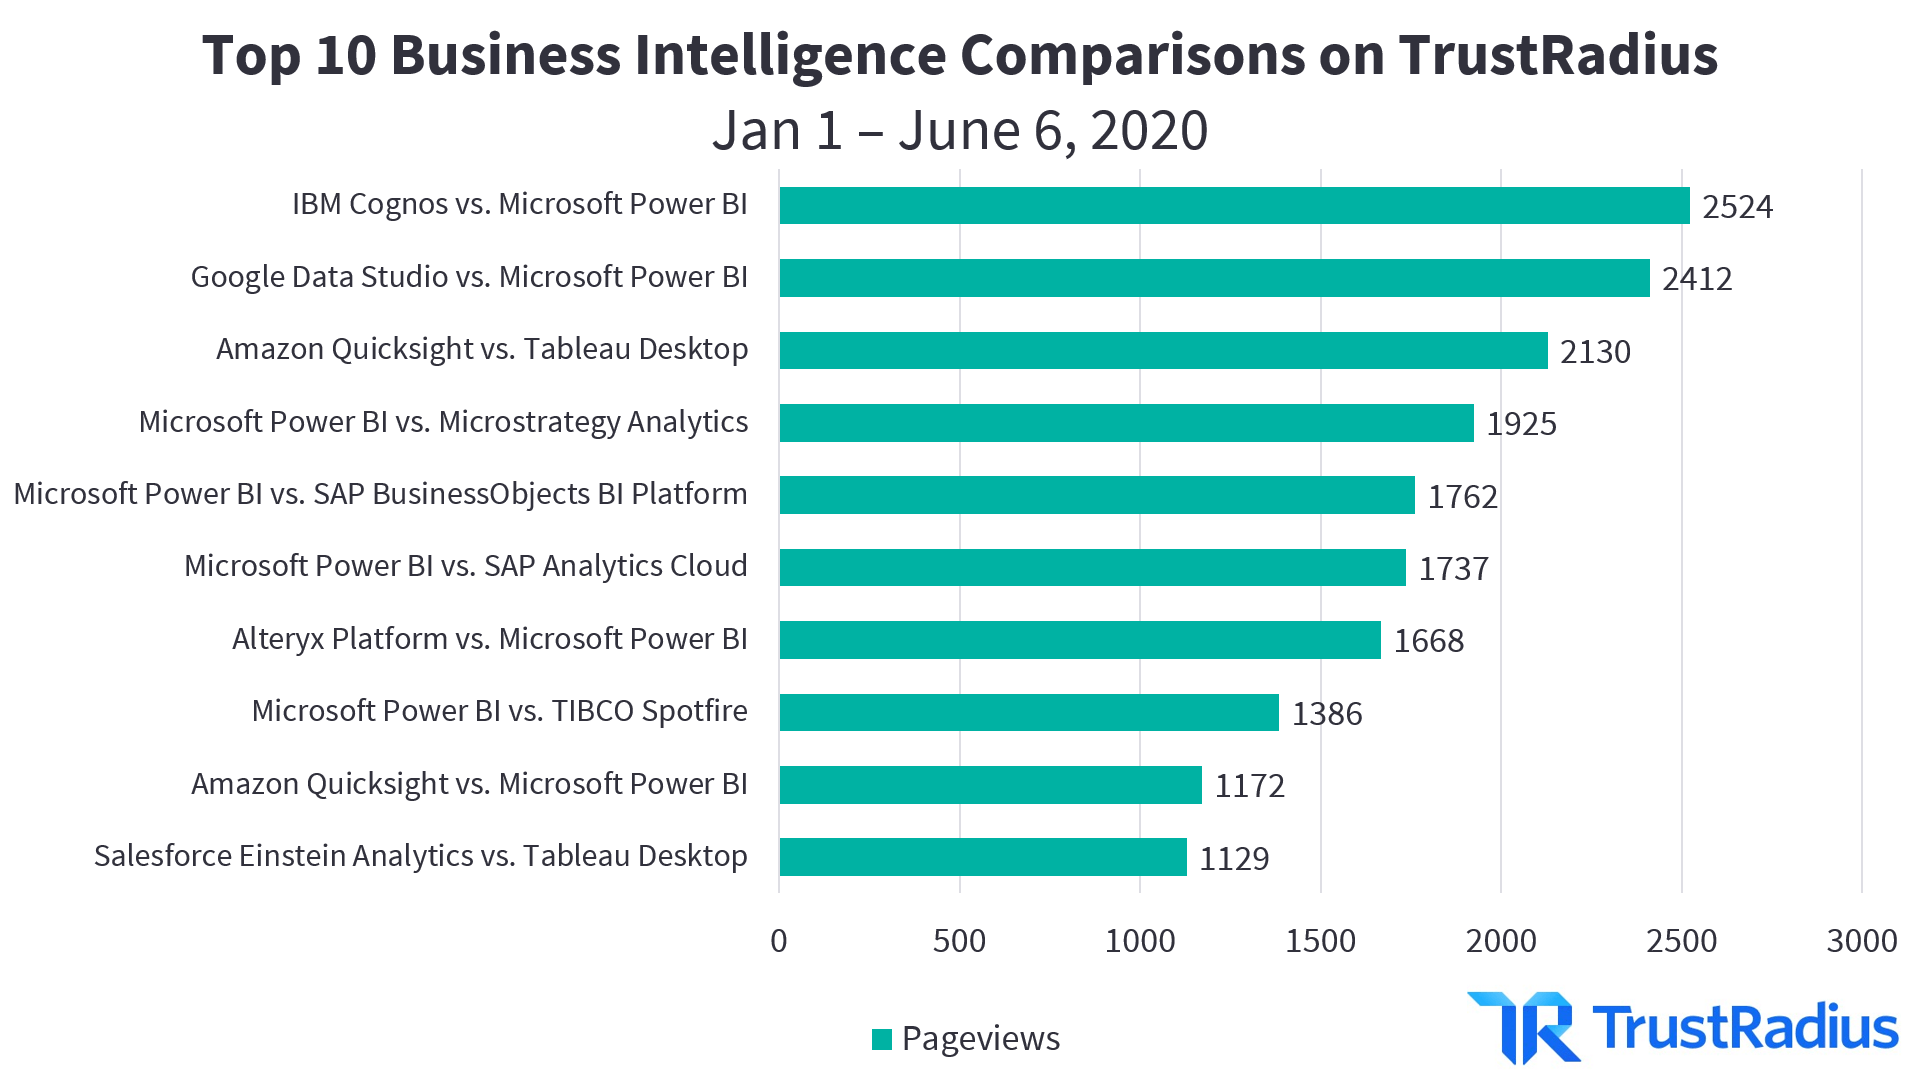
The average time on page across these 10 comparisons is over 20 minutes. This incredibly long time spent on comparison pages speaks to the complexity of the products at hand, as well as the depth and quality of content found on comparison pages. Our comparison pages provide an analysis of products’ feature ratings in areas like reporting, data visualization, and embedding capabilities. They also provide qualitative views of 8 other topics, such as usability and support.
Buyer Engagement on TrustRadius
Over the last few months, business intelligence buyers have increasingly chosen TrustRadius as the most trusted site for researching BI tools. This is because buyers are looking for high-quality research, customer feedback, and insights. These outcomes ultimately rely on two things:
- A high volume of users
- High-quality content.
The TrustRadius platform currently attracts over 1 million monthly visits, with monthly peaks of over 8,000 pageviews to the BI category in 2020. We’ve also seen increasing engagement with business intelligence buyers over the last year. The average time spent on each page for the entire business intelligence category increased 11% year over year, from 7 minutes in June 2019 to over 8 minutes in June 2020.
TrustRadius also hosts the most in-depth review content available. Across the 2751 reviews of business intelligence tools on TrustRadius, the average word count is 367 words. In comparison, G2 reviews average just 130 words. Detailed answers to key questions, like use case, top pros and cons, and ROI, make TrustRadius the most valuable resource for buyers researching business intelligence software.
In addition to insights into business intelligence trends, TrustRadius also offers vendors the unique opportunity to see which buyers are considering your products or your competitors right now. We’re currently offering 30 days of free True Intent data to all qualified vendors as one of the many ways we’re helping the B2B tech industry work through the challenges of COVID-19. Learn more here.
About the Author