Google Analytics is perhaps the best-known web analytics product and, as a free product, it has massive adoption. Although it lacks some enterprise-level features compared to its competitors in the space, the launch of the paid Google Analytics Premium edition seems likely to close the gap.
$0
per month
GoSquared
Score 9.0 out of 10
N/A
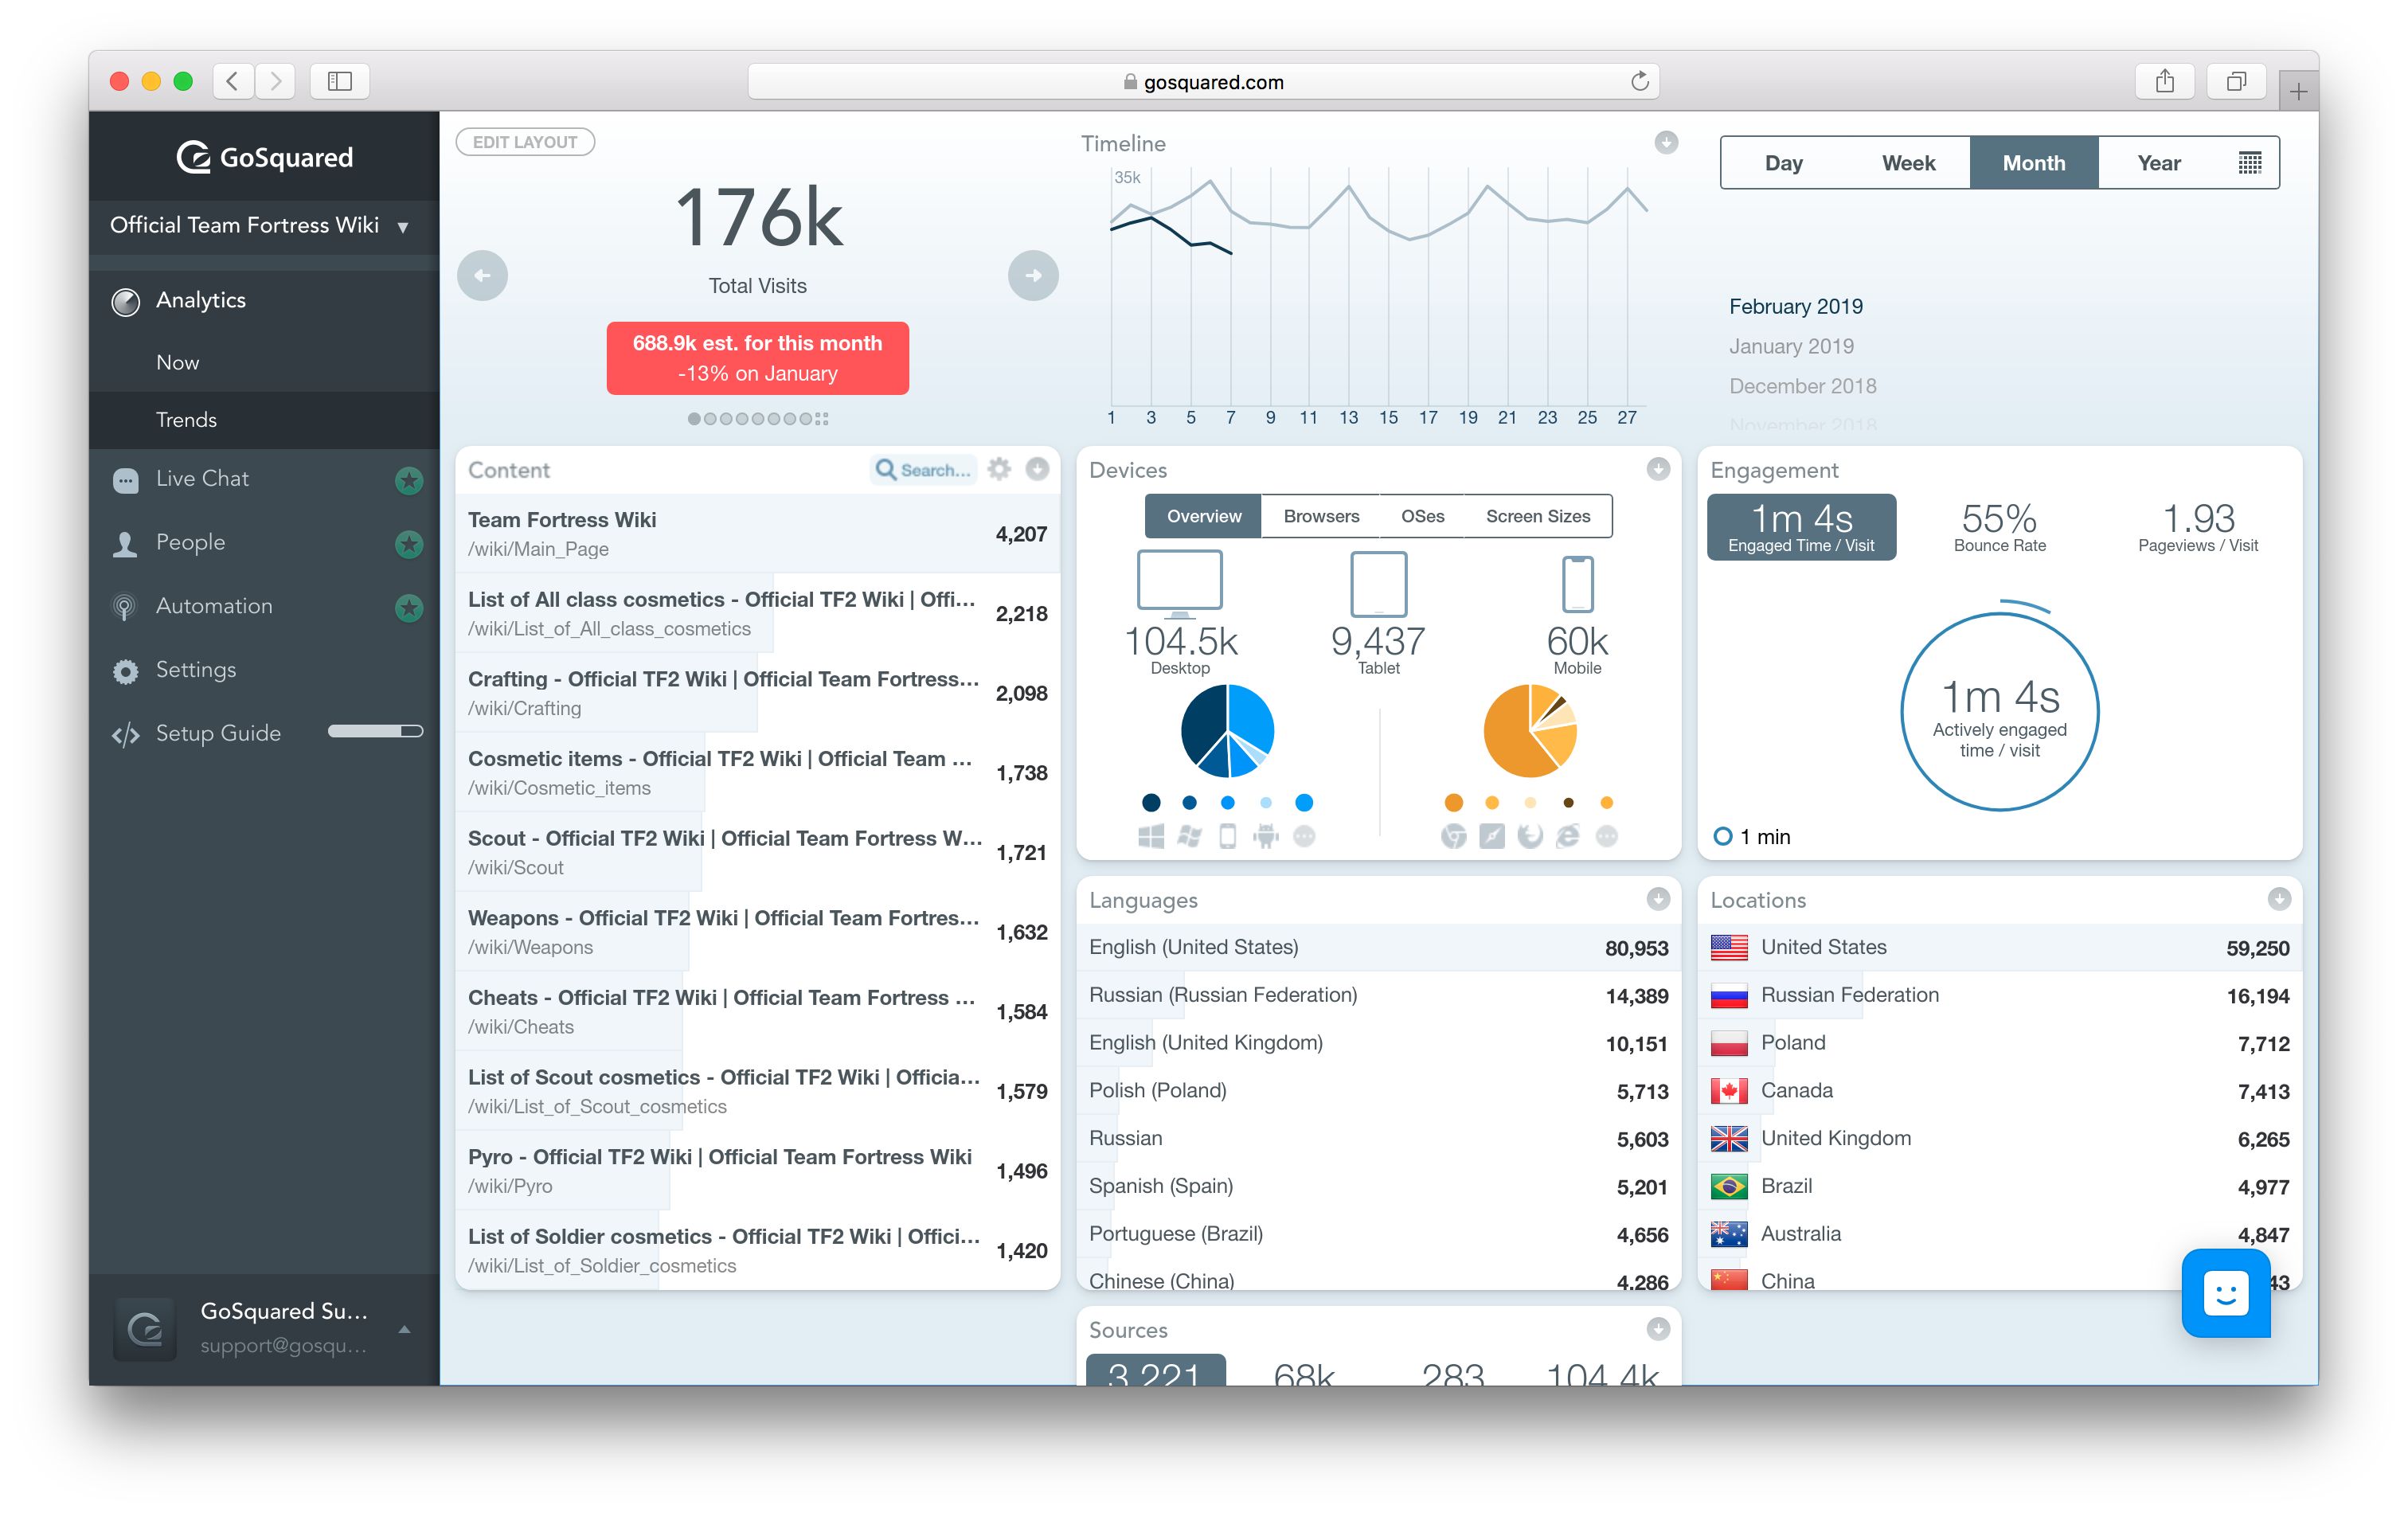
GoSquared provides real-time website analytics to sites of all sizes. The real-time dashboard displays website analytics on an individual visitor basis. The Now App displays concurrent analysis (the visitors who are on your site right now) of your site performance. The Trends App displays historical, trends and comparison analysis on real-time data. You don't have to wait 4 - 24 hours in order to compare todays current performance against last years. The Ecommerce App displays the same freshness…
$0
Per Month [Unlimited Users]
QlikView
Score 8.2 out of 10
N/A
QlikView® is Qlik®’s original BI offering designed primarily for shared business intelligence reports and data visualizations. It offers guided exploration and discovery, collaborative analytics for sharing insight, and agile development and deployment.
N/A
Pricing
Google Analytics
GoSquared
QlikView
Editions & Modules
Google Analytics 360
150,000
per year
Google Analytics
Free
GoSquared Free - Access to the Now and Trends realtime web analytics dashboard.
$0
Per Month [Unlimited Users]
GoSquared Analytics - Everything included in free plus premium analytics features.
$29
Per Month [Unlimited Users]
GoSquared Suite - The most popular GoSquared plan, full access to our real time analytics dashboards, intelligent live chat and customer data hub.
$79
Month [Unlimited Users]
QlikView
Custom
per user
Offerings
Pricing Offerings
Google Analytics
GoSquared
QlikView
Free Trial
No
Yes
Yes
Free/Freemium Version
Yes
Yes
No
Premium Consulting/Integration Services
No
Yes
Yes
Entry-level Setup Fee
No setup fee
No setup fee
Optional
Additional Details
—
GoSquared Free, track up to 1000 pageviews a month. GoSquared Analytics, track up to 100k pageviews a month with pricing starting at £29/month. GoSquared Suite, track up to 100k pageviews a month with pricing starting at £79/month.
On an perpetual license basis, based on server plus number of users.
Contact vendor for pricing.
More Pricing Information
Community Pulse
Google Analytics
GoSquared
QlikView
Considered Multiple Products
Google Analytics
Verified User
Executive
Chose Google Analytics
Honestly, I don't think any other options really stack up at all but these have a few great features... Matomo - planned integrations with Google Ads, Bing Ads, and Facebook Ads. Woopra - real-time, on-the-fly things like sending a message to a sales Slack channel right when a …
For simplicity & real-time data, GoSquared beats Google Analytics easily. However, for more complex analytics requirements, GoSquared simply doesn't support the vast array of reporting abilities which Google Analytics affords.
Google Analytics is massively bloated and can be difficult to configure, navigate and understand. While GoSquared doesn't provide the feature set that Google Analytics does it focuses on providing the best experience for the features it does offer. If you just want to know who …
GoSquared acts as an end-to-end tool taking care of most of the needs of the organizations unlike most of the competitors. Even while covering a vast scenario, GoSquared handles all the tasks pretty well.
GoSquared is easier and more intuitive to use, also less advanced but it offers enough functionality for most websites. It can be used in conjunction with more advanced tools.
I use GoSquared in tandem with Google Analytics on my site since I don't need an all-in-one marketing software for this site. I love the clean, easy-to-read reports that I receive from GoSquared on a daily/weekly/monthly basis. The graphs are easy to interpret and it pulls the …
For realtime analytics, GoSquare is my go to pick since it does it really well and is very simple to use. The dashboard is also really great to show the team analytics of our website at a glance.
As I said previously, I rather pay for a superb product than use a good free product. I think GoSquared beats Google Analytics on user-friendliness, usability, and UX. The team seems to not stand still and is always innovating, which I value, too.
The first thing we liked about QlikView was the price. For a small amount per user, I can have a very useful software to manage the whole data set our company uses. The Tableau Desktop has very high pricing for the software, and for just one user, not the whole organization. …
Qlikview is great for extracting and cleaning data from ODBC compliant databases and Comma Separated Value (.csv) or excel data files. I think that Qlikview desktop is better than proprietary application's reporting tools since it can gather and compile data from multiple …
Simpler than Tableau and offers some more features for free. While Tableau offers more data connection options, QlikView has satisfied my needs pretty well.
I felt like MicroStrategy was equally comparable to QlikView. I liked the dashboard and the ease of building reports. Our company was testing MicroStrategy as an option so I only got to do a trial for a couple of hours. Both of these platforms are beasts and not for the faint …
TIBCO Spotfire and Tableau were other systems considered. Both of these products are very good and they all have different strengths. QlikView best met our business needs because of its ability to load multiple data sources directly, handle ETL logic on the data load, delivers …
Features
Google Analytics
GoSquared
QlikView
Web Analytics
Comparison of Web Analytics features of Product A and Product B
Google Analytics
8.4
11 Ratings
4% above category average
GoSquared
-
Ratings
QlikView
-
Ratings
Lead Conversion Tracking
8.110 Ratings
00 Ratings
00 Ratings
Bounce Rate Measurement
8.410 Ratings
00 Ratings
00 Ratings
Device and Browser Reporting
9.211 Ratings
00 Ratings
00 Ratings
Pageview Tracking
9.011 Ratings
00 Ratings
00 Ratings
Event Tracking
8.311 Ratings
00 Ratings
00 Ratings
Reporting in real-time
7.910 Ratings
00 Ratings
00 Ratings
Referral Source Tracking
8.510 Ratings
00 Ratings
00 Ratings
Customizable Dashboards
7.910 Ratings
00 Ratings
00 Ratings
BI Standard Reporting
Comparison of BI Standard Reporting features of Product A and Product B
Google Analytics
-
Ratings
GoSquared
-
Ratings
QlikView
8.4
68 Ratings
3% above category average
Pixel Perfect reports
00 Ratings
00 Ratings
8.050 Ratings
Customizable dashboards
00 Ratings
00 Ratings
9.366 Ratings
Report Formatting Templates
00 Ratings
00 Ratings
8.060 Ratings
Ad-hoc Reporting
Comparison of Ad-hoc Reporting features of Product A and Product B
Google Analytics
-
Ratings
GoSquared
-
Ratings
QlikView
8.1
67 Ratings
1% above category average
Drill-down analysis
00 Ratings
00 Ratings
8.366 Ratings
Formatting capabilities
00 Ratings
00 Ratings
7.767 Ratings
Integration with R or other statistical packages
00 Ratings
00 Ratings
8.336 Ratings
Report sharing and collaboration
00 Ratings
00 Ratings
8.362 Ratings
Report Output and Scheduling
Comparison of Report Output and Scheduling features of Product A and Product B
Google Analytics
-
Ratings
GoSquared
-
Ratings
QlikView
8.6
62 Ratings
4% above category average
Publish to Web
00 Ratings
00 Ratings
8.049 Ratings
Publish to PDF
00 Ratings
00 Ratings
9.056 Ratings
Report Versioning
00 Ratings
00 Ratings
7.542 Ratings
Report Delivery Scheduling
00 Ratings
00 Ratings
10.048 Ratings
Data Discovery and Visualization
Comparison of Data Discovery and Visualization features of Product A and Product B
Google Analytics is particularly well suited for tracking and analyzing customer behavior on a grocery e-commerce platform. It provides a wealth of information about customer behavior, including what products are most popular, what pages are visited the most, and where customers are coming from. This information can help the platform optimize its website for better customer engagement and conversion rates. However, Google Analytics may not be the best tool for more advanced, granular analysis of customer behavior, such as tracking individual customer journeys or understanding customer motivations. In these cases, it may be more appropriate to use additional tools or solutions that provide deeper insights into customer behavior.
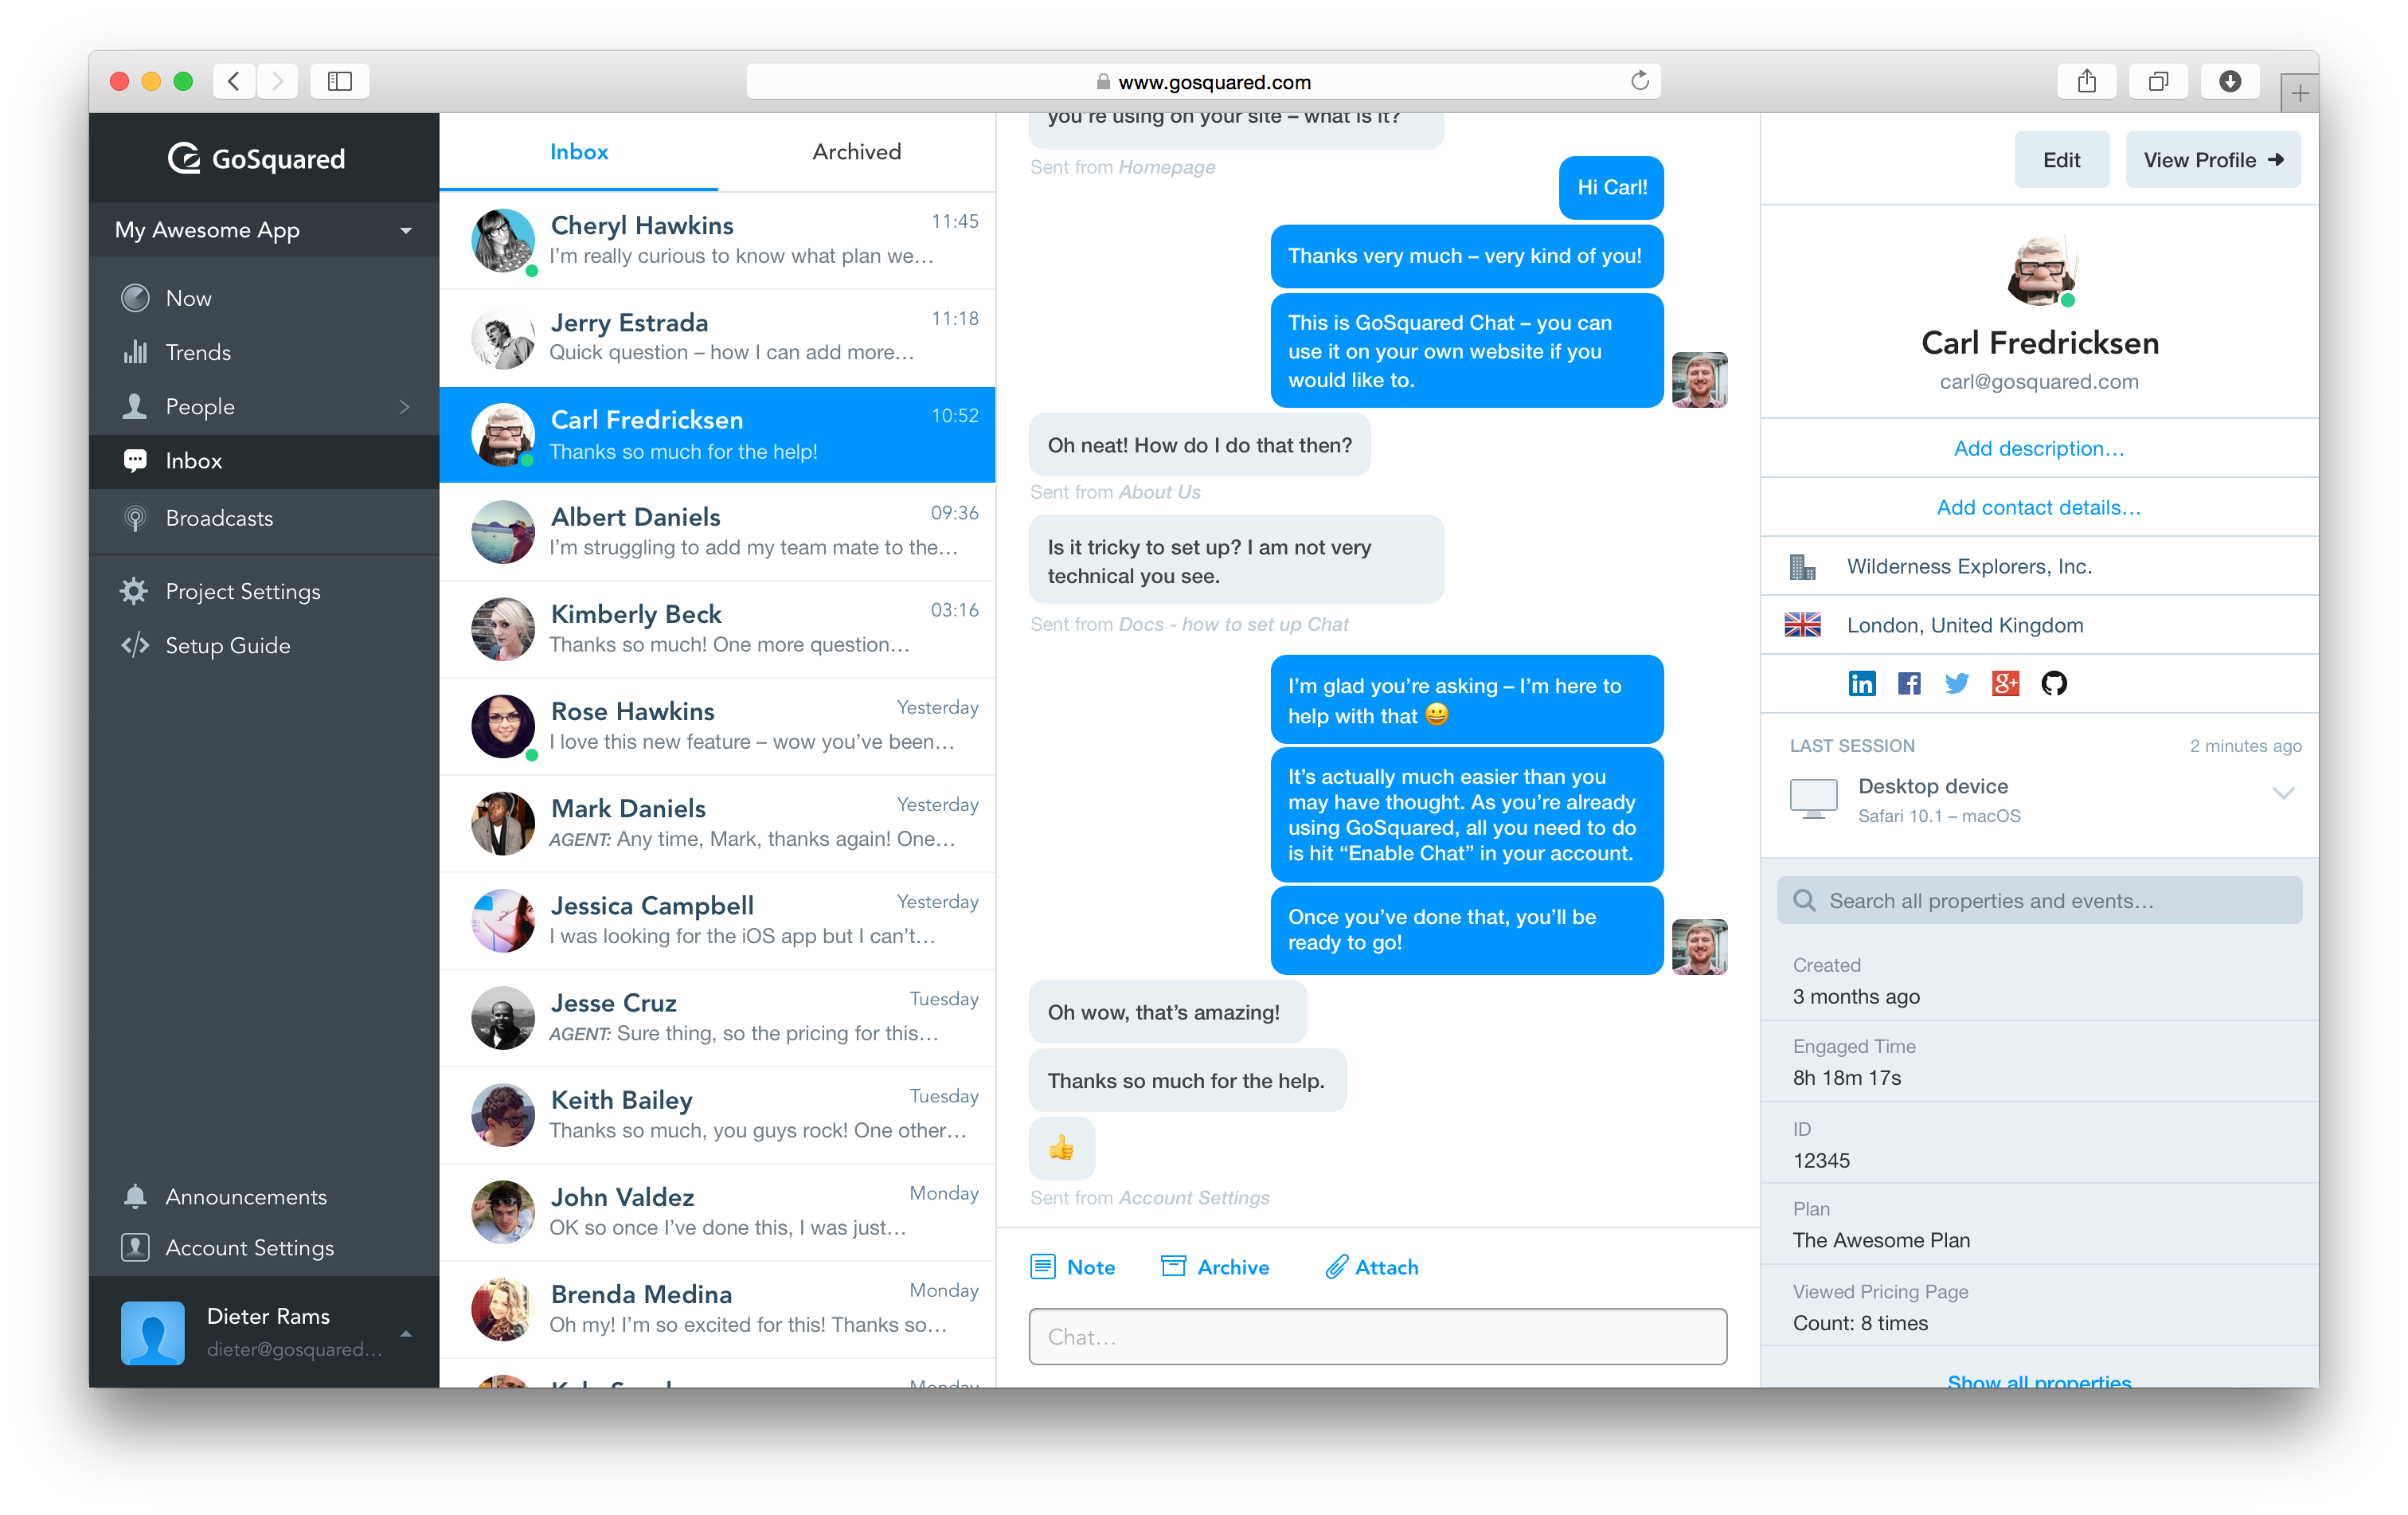
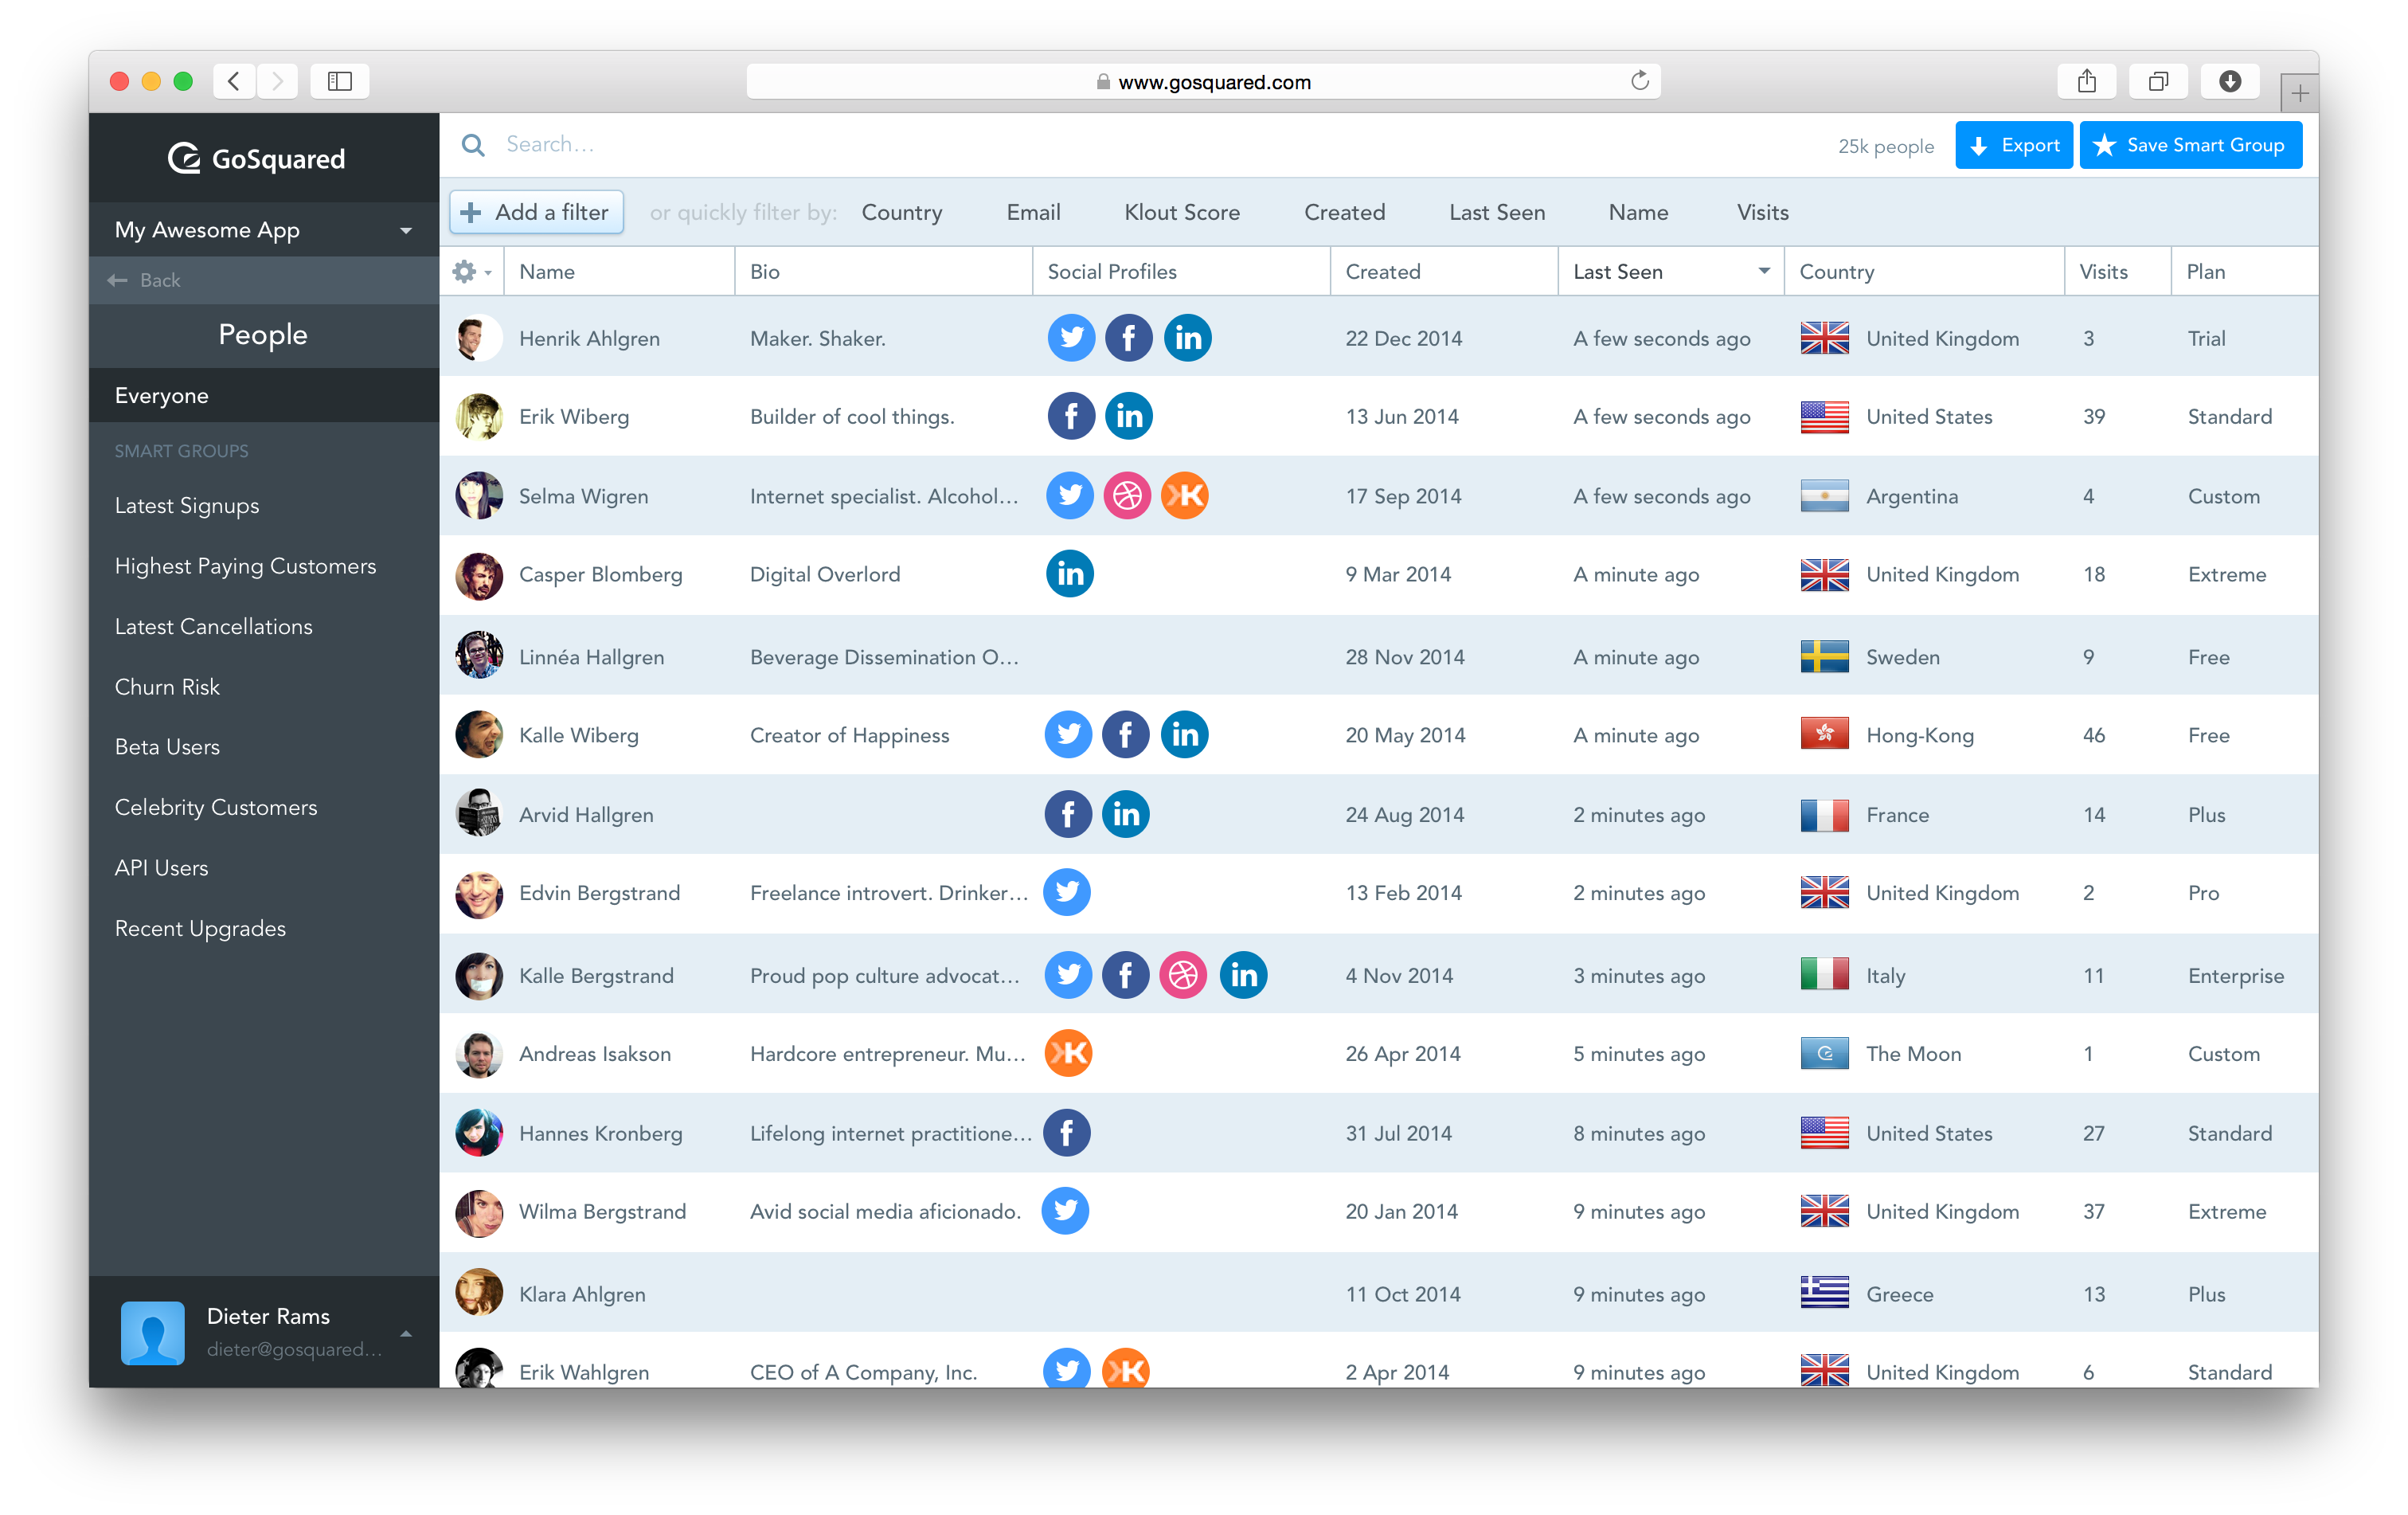
1) Maintaining customer relationships - GS just makes it so easy to respond to our users who use our product more from a tactical point of view 2) Onboarding - I think it's more or less an extension of the first point above but GS does make it easy for us to onboard new clients who are sort of beginners.
Sales data validations have helped manage our justifications in the past, especially with regard to new product development and new business introduction. It has also been helpful in identifying trends with business impact and direction specific to quarter and monthly sales from ERP data as well as decisions to purchase equipment of staffing based on run rates and product demand.
One thing that can get out of hand is data output - if you aren't careful in your query, you may be overloaded with data dumps and drown in the amount of info you have to filter through. This is a user caution, not a comment on the software itself.
We found that QlikView can be a bit slow in supporting some forms of encryption. It is web-based and we needed to upgrade all of our server to not support the older SSL and TLS 1 protocols, only support TLS 1.2 and TLS 1.3. However, QlikView could not run with TLS 1.2 and TLS 1.3. We had to wait over six months to get a version that would handle the newer TLS versions.
There are so many options with QlikView that you can get lost when developing a visualization. There are still items I have not yet figured out, such as labeling a graph with the name of a selected detail item.
QlikView works by pulling the data it is going to use for visualization into its database. I am a security reviewer and I need to make certain that PII and PHI is not pulled by QlikView for a visualization, otherwise this could become a reportable indecent.
We will continue to use Google Analytics for several reasons. It is free, which is a huge selling point. It houses all of our ecommerce stores' data, and though it can't account for refunds or fraud orders, gives us and our clients directional, real time information on individual and group store performance.
Not only does the GoSquared application work well, the GoSquared team is constantly making improvements. When I first started using GoSquared, they only offered daily reporting -- now they offer the weekly and monthly feature per popular request. I like that they are always updating the look and feel of the website and emails they send to maintain a modern look. GoSquared is easy to implement and easy to use!
Ease of use, ability to load from pretty much any data source. today I created an application that loaded time sheets from excel that are not in a table format. With Qlik's "enable transformation steps" I was able to automate loads of multiple spreadsheets and multiple tabs easily. Could not do that with any other tool.
Google Analytics provides a wealth of data, down to minute levels. That is it's greatest detriment: find the right information when you need it can be a cumbersome task. You are able to create shortcuts, however, so it can mitigate some of this problem. Google is continually refining Analytics, so I do not doubt there will be improvements
QlikView is very easy to implement. The installation is very straight forward. QlikView has several different data connectors that can connect to different data sources very smoothly. The user interface to build the reports is very easy to understand. This helps to have a smaller learning curve. Something very helpful is that QlikView is a browser application for the end users. So, you don't need to install any applications on the user's computer.
We all know Google is at top when it comes to availability. We have never faced any such instances where I can suggest otherwise. All you need is a Google account, a device and internet connection to use this super powerful tool for reporting and visualising your site data, traffic, events, etc. that too in real time.
This has been a catalyst for improving our site's traffic handling capabilities. We were able to identify exit% from our sites through it and we used recommendations to handle and implement the same in our sites. We have been increasing the usage of Google Analytics in our sites and never had any performance related issues if we used Analytics
The Google reps respond very quickly. However, sometimes they can overly call you to set up an apportionment. I'm very proficient and sometimes when I talk to reps, they give beginner tutorials and insights that are a waste of time. I wish Google would understand my level of expertise and assign me to a rep (long-term) that doesn't have to walk me through the basics.
My experience with the Qlik support team has been somewhat limited, but every interaction I have had with them has been very professional and I received a response quickly. Typically if there is a technical issue, our IT team will follow up. My inquiries are specific to product functionality, and Qlik has been very helpful in clarifying any questions I might have.
My team attended, but I cannot myself rate, but I think it was good as they've successfully launched a training program at our company themselves for users. It was 3-4 day training.
love the product and training they provide for businesses of all sizes. The following list of links will help you get started with Google Analytics from setup to understanding what data is being presented by Google Analytics.
Training was as expected. The demo environments tend to be more fully featured that our own environment, but the training was clear and well delivered.
I think my biggest take away from the Google Analytics implementation was that there needs to be a clear understanding of what you want to achieve and how you want to achieve it before you start. Originally the analytics were added to track visitors, but as we became more savvy with the product, we began adding more and more functionality, and defining guidelines as we went along. While not detrimental to our success, this lack of an overarching goal resulted in some minor setbacks in implementation and the collection of some messy data that is unusable.
"Implementation" can mean a few things... so I'm not sure that this is the answer you want.... but here it goes: To me, implementation means: "Is the user interface intuitive and can I produce meaningful reports with ease?" On that score, I'd say YES. The amount of training required was minimal and the results were powerful. The desktop implementation is a simple, "blank" interface just waiting for your creativity. The pre-populated templates give you a reasonable start to any project -- and a good set of objects to "play around with" if you're just getting started. Finally, note that the "implementation" I used was baked into QuickBooks 2016 Enterprise -- called "Advanced Reporting"..... That integration makes it ultra useful and simple.
I have not used Adobe Analytics as much, but I know they offer something called customer journey analytics, which we are evaluating now. I have used Semrush, and I find them much better than Google Analytics. I feel a fairly nontechnical person could learn Semrush in about a month. They also offer features like competitive analysis (on content, keywords, traffic, etc.), which is very useful. If you have to choose one among Semrush and Google Analytics, I would say go for Semrush.
Google Analytics is massively bloated and can be difficult to configure, navigate and understand. While GoSquared doesn't provide the feature set that Google Analytics does it focuses on providing the best experience for the features it does offer. If you just want to know who is visiting your website and when then GoSquared is a simple way of tracing this information.
The only other vendor product that I have worked with that provides a similar experience to Qlikview is Tableau. I would recommend Tableau if your use case is to build a fixed dashboard. You can share reports for free without needing to buy additional licenses. I would recommend Qlikview if your users are looking for a more interactive experience. They can create new objects to represent the data which can't be accomplished as easily in Tableau
Google Analytics is currently handling the reporting and tracking of near about 80 sites in our project. And I am not talking about the sites from different projects. They may have way more accounts than that. Never ever felt a performance issue from Google's end while generating or customising reports or tracking custom events or creating custom dimensions
GoSquared helps us to react quickly to high volumes of traffic, and allows us to identify very quickly how engaging our content is
Using browser specs helps us to ensure our websites are compatible with as many of our customers as possible, rather than relying on generic global stats
You can use the free desktop version to do a lot of reporting and analysis work more quickly so the ROI is huge
QlikView is great at finding outliers such as data entry errors
QlikView is great at helping you quickly discover new insights about your business that can prompt you to take action that can immediately affect your cash flow.