Chose Looker
There are some specific use cases where other tools are not useful in our organization. Some software solutions are shared with other organizations inside the company and Looker is the only tool where we can collaborate good enough.
| Product | Rating | Most Used By | Product Summary | Starting Price |
|---|---|---|---|---|
 Looker | N/A | Looker is a BI application with an analytics-oriented application server that sits on top of relational data stores. It includes an end-user interface for exploring data, a reusable development paradigm for data discovery, and an API for supporting data in other systems. | N/A | |
 Mode | N/A | Mode, or Mode Analytics, from ThoughtSpot since the June 2023 acquisition, is a business intelligence platform that unifies company analytics by bringing data teams and business teams together, so analysts can provide rapid answers to strategic, ad hoc questions. And, business stakeholder can access relevant data to answer their own questions which can often detract more impactful work. | N/A | |
 ThoughtSpot | N/A | ThoughtSpot is an Agentic Analytics Platform for enterprises where users ask data questions using natural language and get answers with AI. Code-first for data teams and code-free for business users, ThoughtSpot can handle large, complex cloud data at scale. | $1,500 per year (5 users) |
| Looker | Mode Analytics | ThoughtSpot | ||||||||||||||||||||||
|---|---|---|---|---|---|---|---|---|---|---|---|---|---|---|---|---|---|---|---|---|---|---|---|---|
| Editions & Modules | No answers on this topic | No answers on this topic |
| |||||||||||||||||||||
| Offerings |
| |||||||||||||||||||||||
| Entry-level Setup Fee | Required | No setup fee | Optional | |||||||||||||||||||||
| Additional Details | Must contact sales team for pricing. | — | — | |||||||||||||||||||||
| More Pricing Information | ||||||||||||||||||||||||
| Looker | Mode Analytics | ThoughtSpot | |
|---|---|---|---|
| Considered Multiple Products |  Looker | Mode  Jacob Rossi Help Systems Analyst Chose Mode Analytics In my opinion Mode Analytics has an edge on much of the competition due to the intuitive and powerful custom dashboard creation interface. I can create dashboards for stakeholders that are self explanatory and easy to make conclusions from. In other respects, it's very much at … | ThoughtSpot |
| Looker | Mode Analytics | ThoughtSpot | |||||||||||||||||||||||||||
|---|---|---|---|---|---|---|---|---|---|---|---|---|---|---|---|---|---|---|---|---|---|---|---|---|---|---|---|---|---|
| BI Standard Reporting |
| ||||||||||||||||||||||||||||
| Ad-hoc Reporting |
| ||||||||||||||||||||||||||||
| Report Output and Scheduling |
| ||||||||||||||||||||||||||||
| Data Discovery and Visualization |
| ||||||||||||||||||||||||||||
| Access Control and Security |
| ||||||||||||||||||||||||||||
| Mobile Capabilities |
| ||||||||||||||||||||||||||||
| Application Program Interfaces (APIs) / Embedding |
|
| Looker | Mode Analytics | ThoughtSpot | |
|---|---|---|---|
| Small Businesses |  Yellowfin Score 8.7 out of 10 | Yellowfin Score 8.7 out of 10 | Yellowfin Score 8.7 out of 10 |
| Medium-sized Companies |  Reveal Score 10.0 out of 10 | Reveal Score 10.0 out of 10 | Reveal Score 10.0 out of 10 |
| Enterprises |  Kyvos Semantic Layer Score 9.5 out of 10 | Kyvos Semantic Layer Score 9.5 out of 10 | Kyvos Semantic Layer Score 9.5 out of 10 |
| All Alternatives | View all alternatives | View all alternatives | View all alternatives |
| Looker | Mode Analytics | ThoughtSpot | |
|---|---|---|---|
| Likelihood to Recommend | 8.3 (132 ratings) | 8.1 (9 ratings) | 8.6 (91 ratings) |
| Likelihood to Renew | 9.3 (8 ratings) | - (0 ratings) | 10.0 (6 ratings) |
| Usability | 8.8 (12 ratings) | 8.1 (4 ratings) | 8.3 (85 ratings) |
| Availability | 10.0 (1 ratings) | - (0 ratings) | 9.0 (3 ratings) |
| Performance | 6.0 (1 ratings) | - (0 ratings) | 8.0 (3 ratings) |
| Support Rating | 8.8 (14 ratings) | 7.4 (5 ratings) | 8.0 (4 ratings) |
| In-Person Training | - (0 ratings) | - (0 ratings) | 5.0 (1 ratings) |
| Online Training | - (0 ratings) | - (0 ratings) | 4.0 (1 ratings) |
| Implementation Rating | 10.0 (1 ratings) | - (0 ratings) | 7.0 (2 ratings) |
| Configurability | 10.0 (1 ratings) | - (0 ratings) | 8.0 (1 ratings) |
| Contract Terms and Pricing Model | 10.0 (1 ratings) | - (0 ratings) | - (0 ratings) |
| Ease of integration | 10.0 (1 ratings) | - (0 ratings) | 9.0 (1 ratings) |
| Product Scalability | 10.0 (1 ratings) | - (0 ratings) | 8.0 (3 ratings) |
| Professional Services | 10.0 (1 ratings) | - (0 ratings) | - (0 ratings) |
| Vendor post-sale | 10.0 (1 ratings) | - (0 ratings) | 8.0 (1 ratings) |
| Vendor pre-sale | 10.0 (1 ratings) | - (0 ratings) | 9.0 (1 ratings) |
| Looker | Mode Analytics | ThoughtSpot | |
|---|---|---|---|
| Likelihood to Recommend | Google
 Daniel Dammerman Regional Sales Director | ThoughtSpot
| ThoughtSpot
|
| Pros | Google
| ThoughtSpot
 Kofi Obo Wood Head of Operations | ThoughtSpot
|
| Cons | Google
| ThoughtSpot
Jacob Rossi Help Systems Analyst | ThoughtSpot
|
| Likelihood to Renew | Google
| ThoughtSpot No answers on this topic | ThoughtSpot
|
| Usability | Google
| ThoughtSpot
| ThoughtSpot
|
| Reliability and Availability | Google
 David Mynář Head Of Online Marketing | ThoughtSpot No answers on this topic | ThoughtSpot
|
| Performance | Google
David Mynář Head Of Online Marketing | ThoughtSpot No answers on this topic | ThoughtSpot
|
| Support Rating | Google
 Anson Abraham Data Lord | ThoughtSpot
| ThoughtSpot
|
| In-Person Training | Google No answers on this topic | ThoughtSpot No answers on this topic | ThoughtSpot
|
| Online Training | Google No answers on this topic | ThoughtSpot No answers on this topic | ThoughtSpot
|
| Implementation Rating | Google
David Mynář Head Of Online Marketing | ThoughtSpot No answers on this topic | ThoughtSpot
 Surya Ravi BI Solutions Engineer |
| Alternatives Considered | Google
| ThoughtSpot
| ThoughtSpot
 Torsten Wiegel Augmented Analytics Consultant |
| Contract Terms and Pricing Model | Google
David Mynář Head Of Online Marketing | ThoughtSpot No answers on this topic | ThoughtSpot No answers on this topic |
| Scalability | Google No answers on this topic | ThoughtSpot No answers on this topic | ThoughtSpot
|
| Return on Investment | Google
| ThoughtSpot
| ThoughtSpot
 Chris Mann VP Product Strategy |
| ScreenShots | Looker Screenshots | ThoughtSpot Screenshots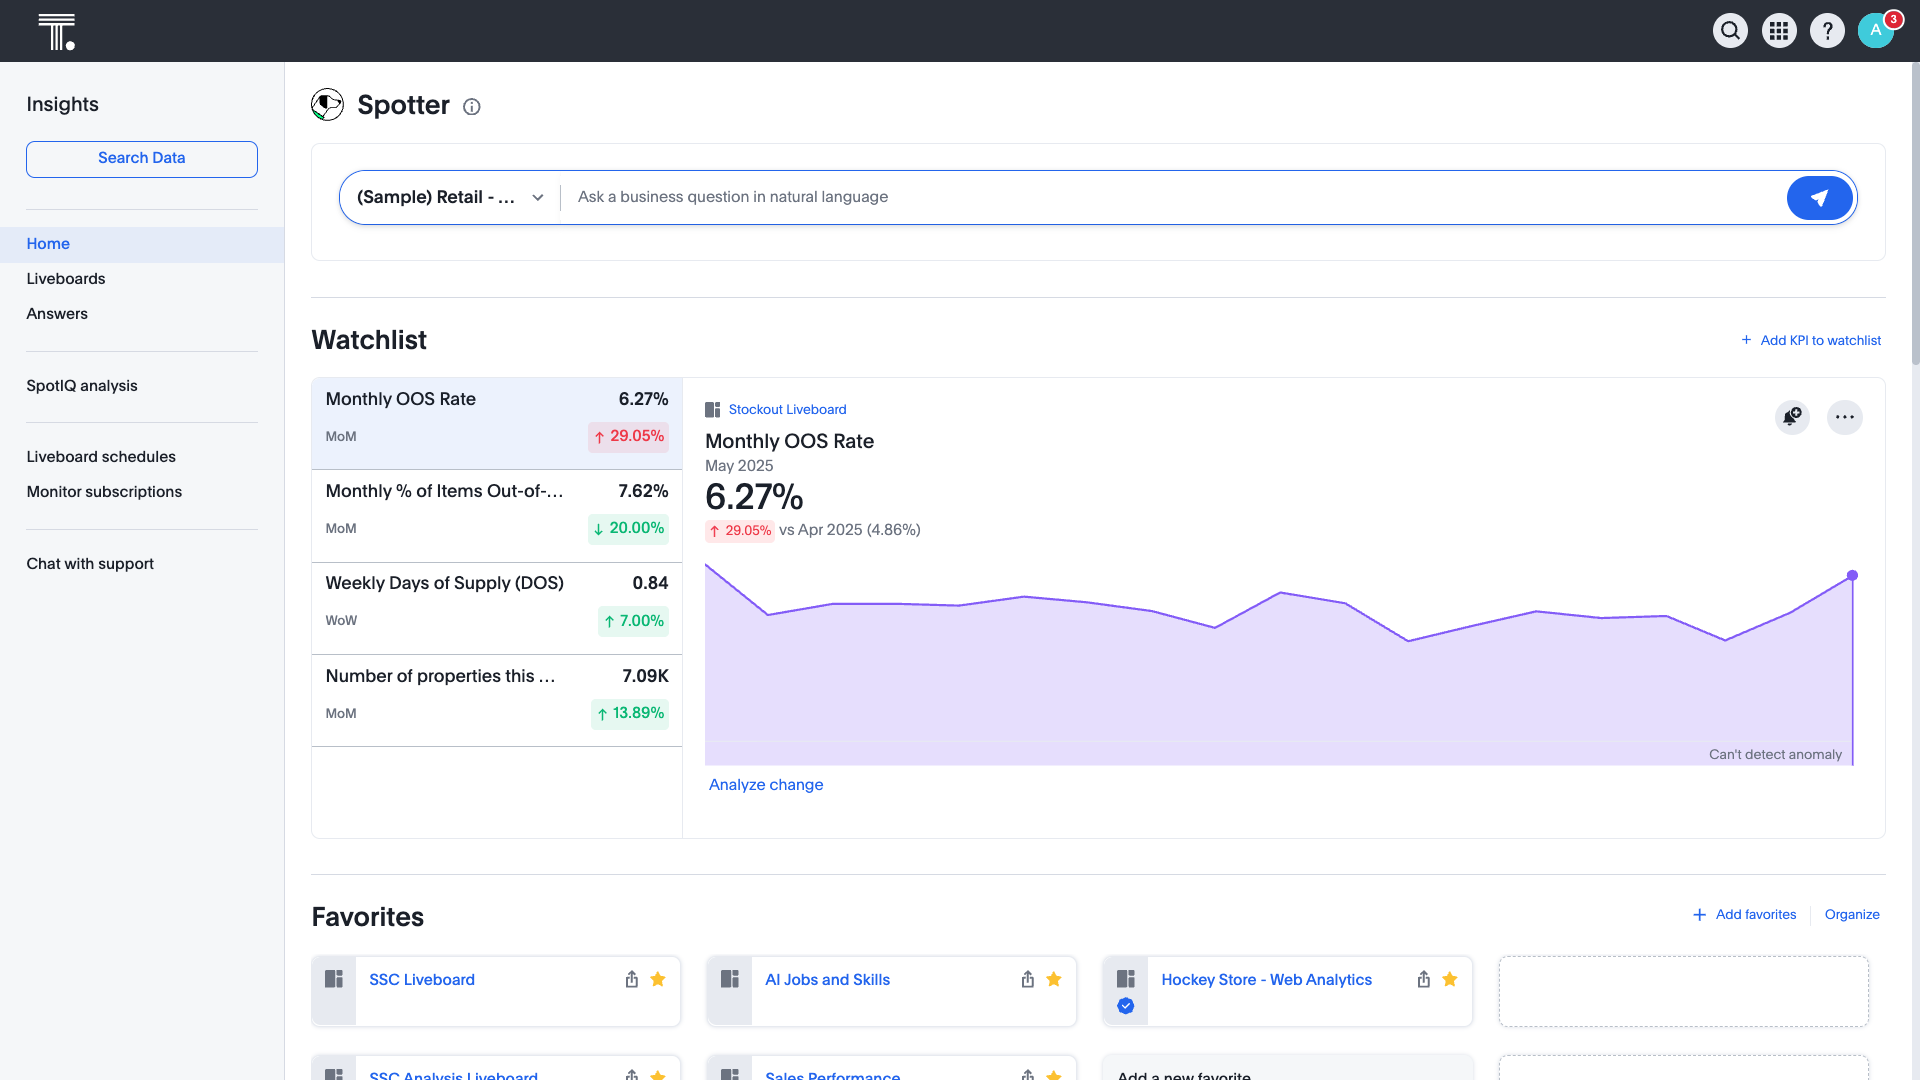  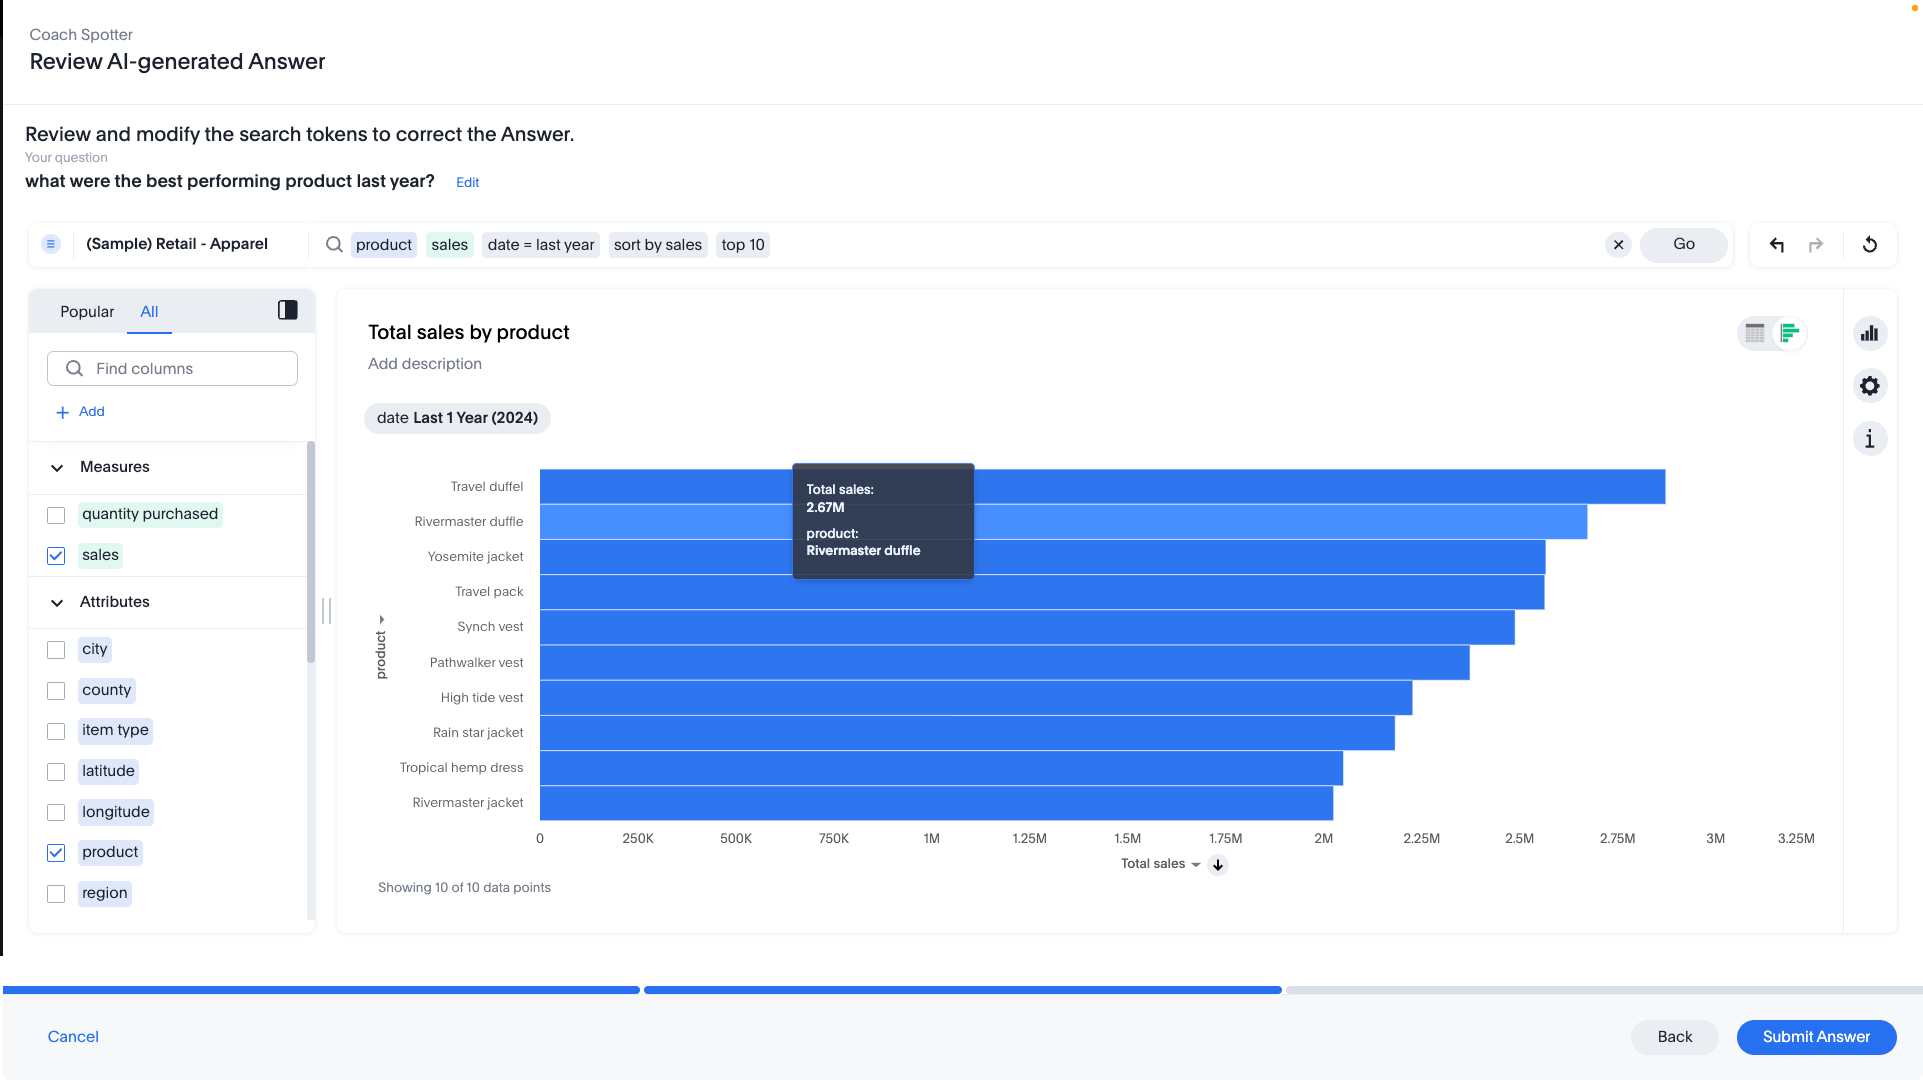 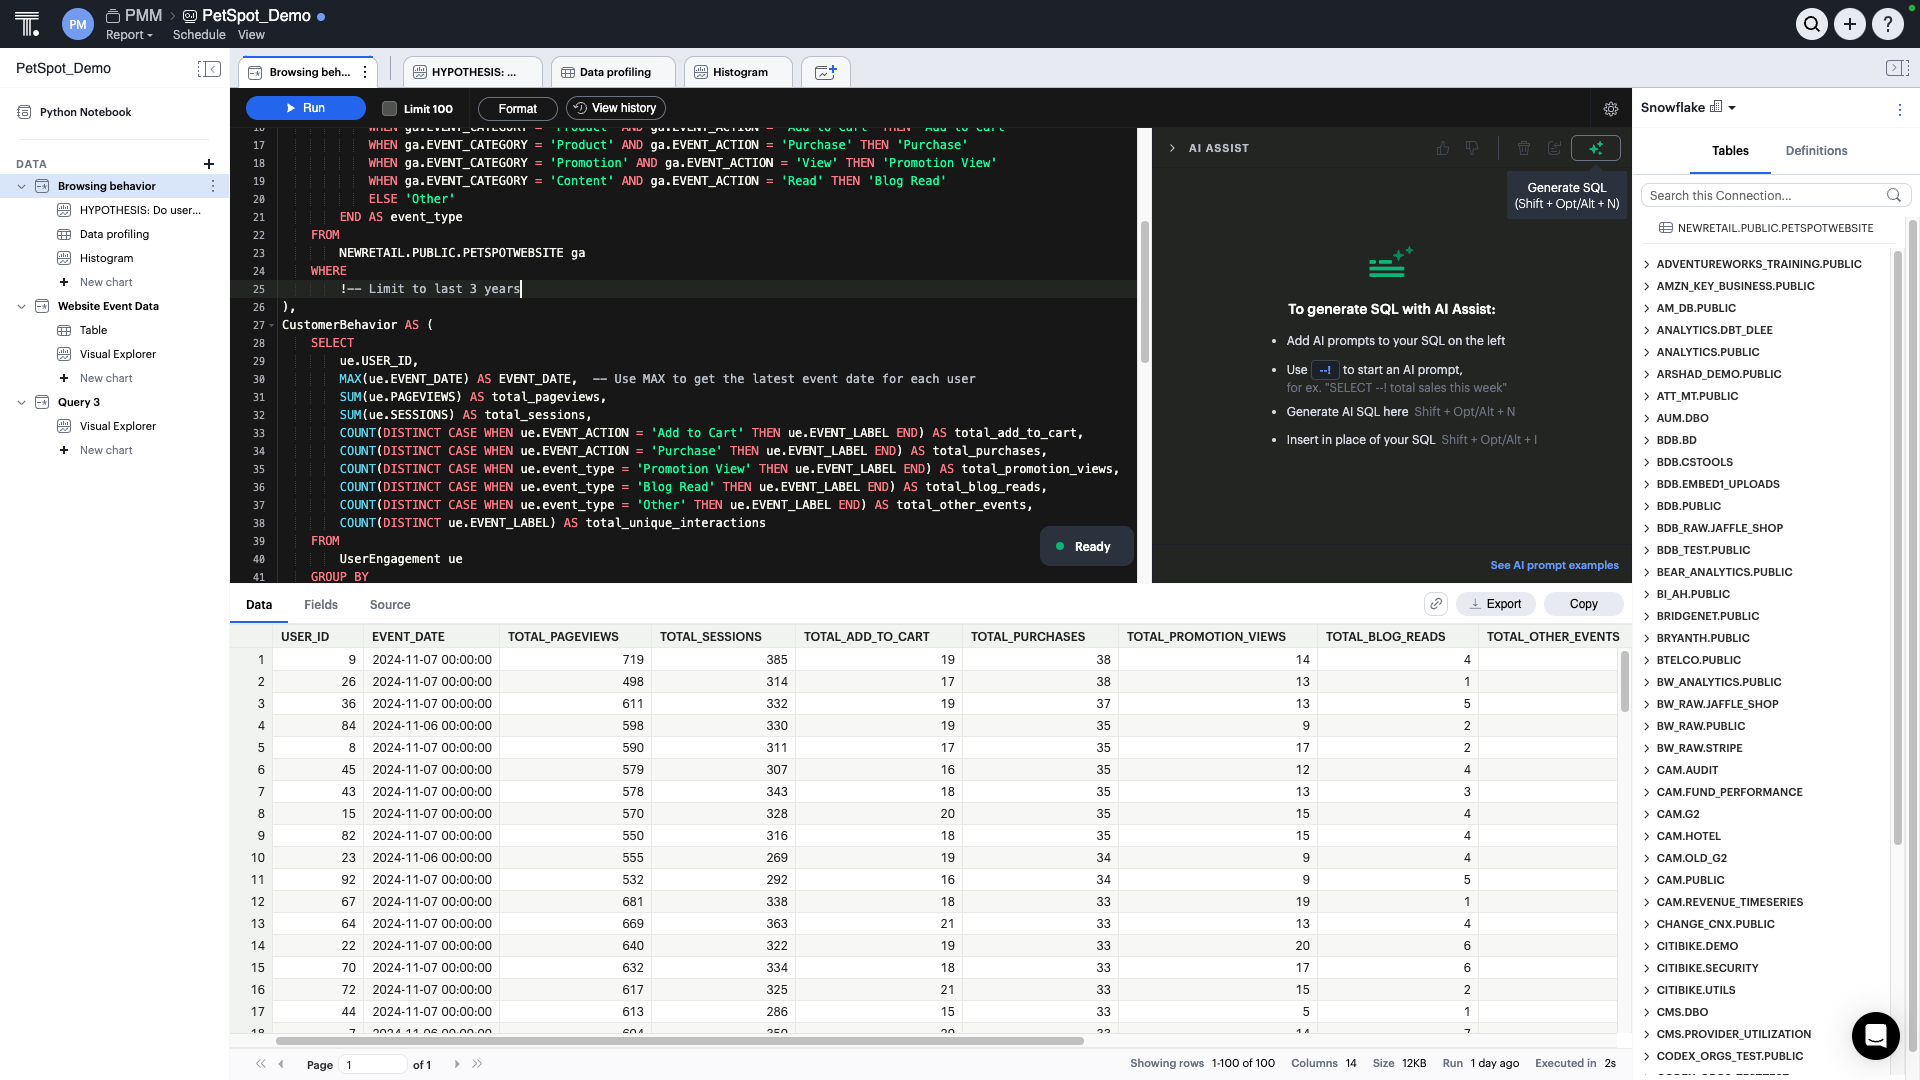  |