


Planning is much better with Board

Use Cases and Deployment Scope
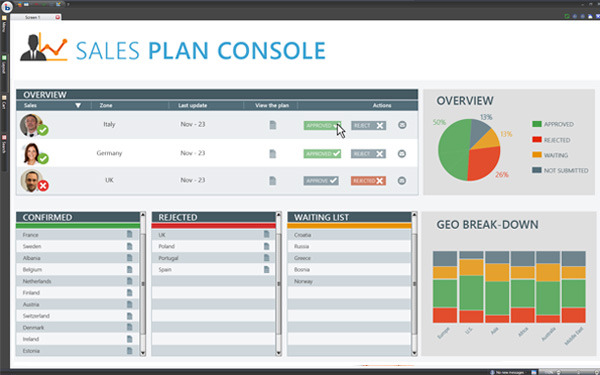
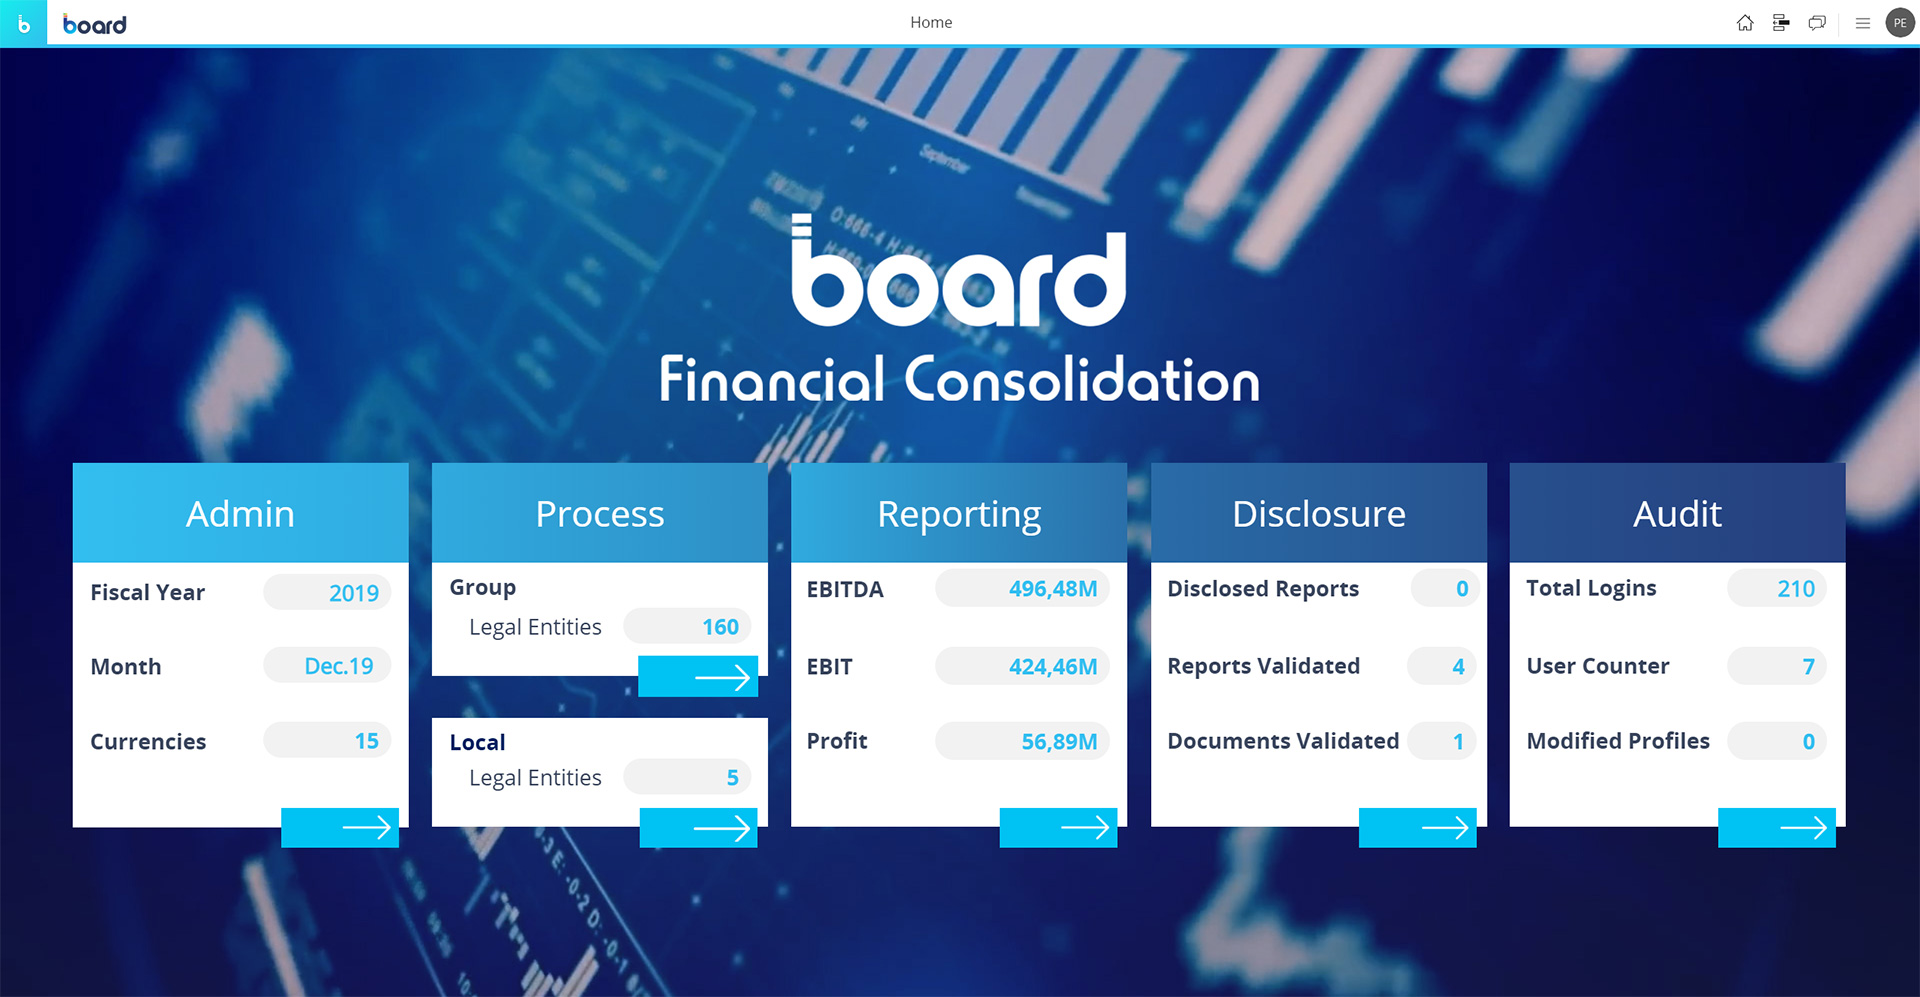
Board is being used as a tool for control, reporting, and planning in the finance and accounting department to improve all of our planning. Board is a tool that manages to improve our workflow with robust data monitoring. The reports are very intuitive and easy to read, which facilitates our performance.
Pros
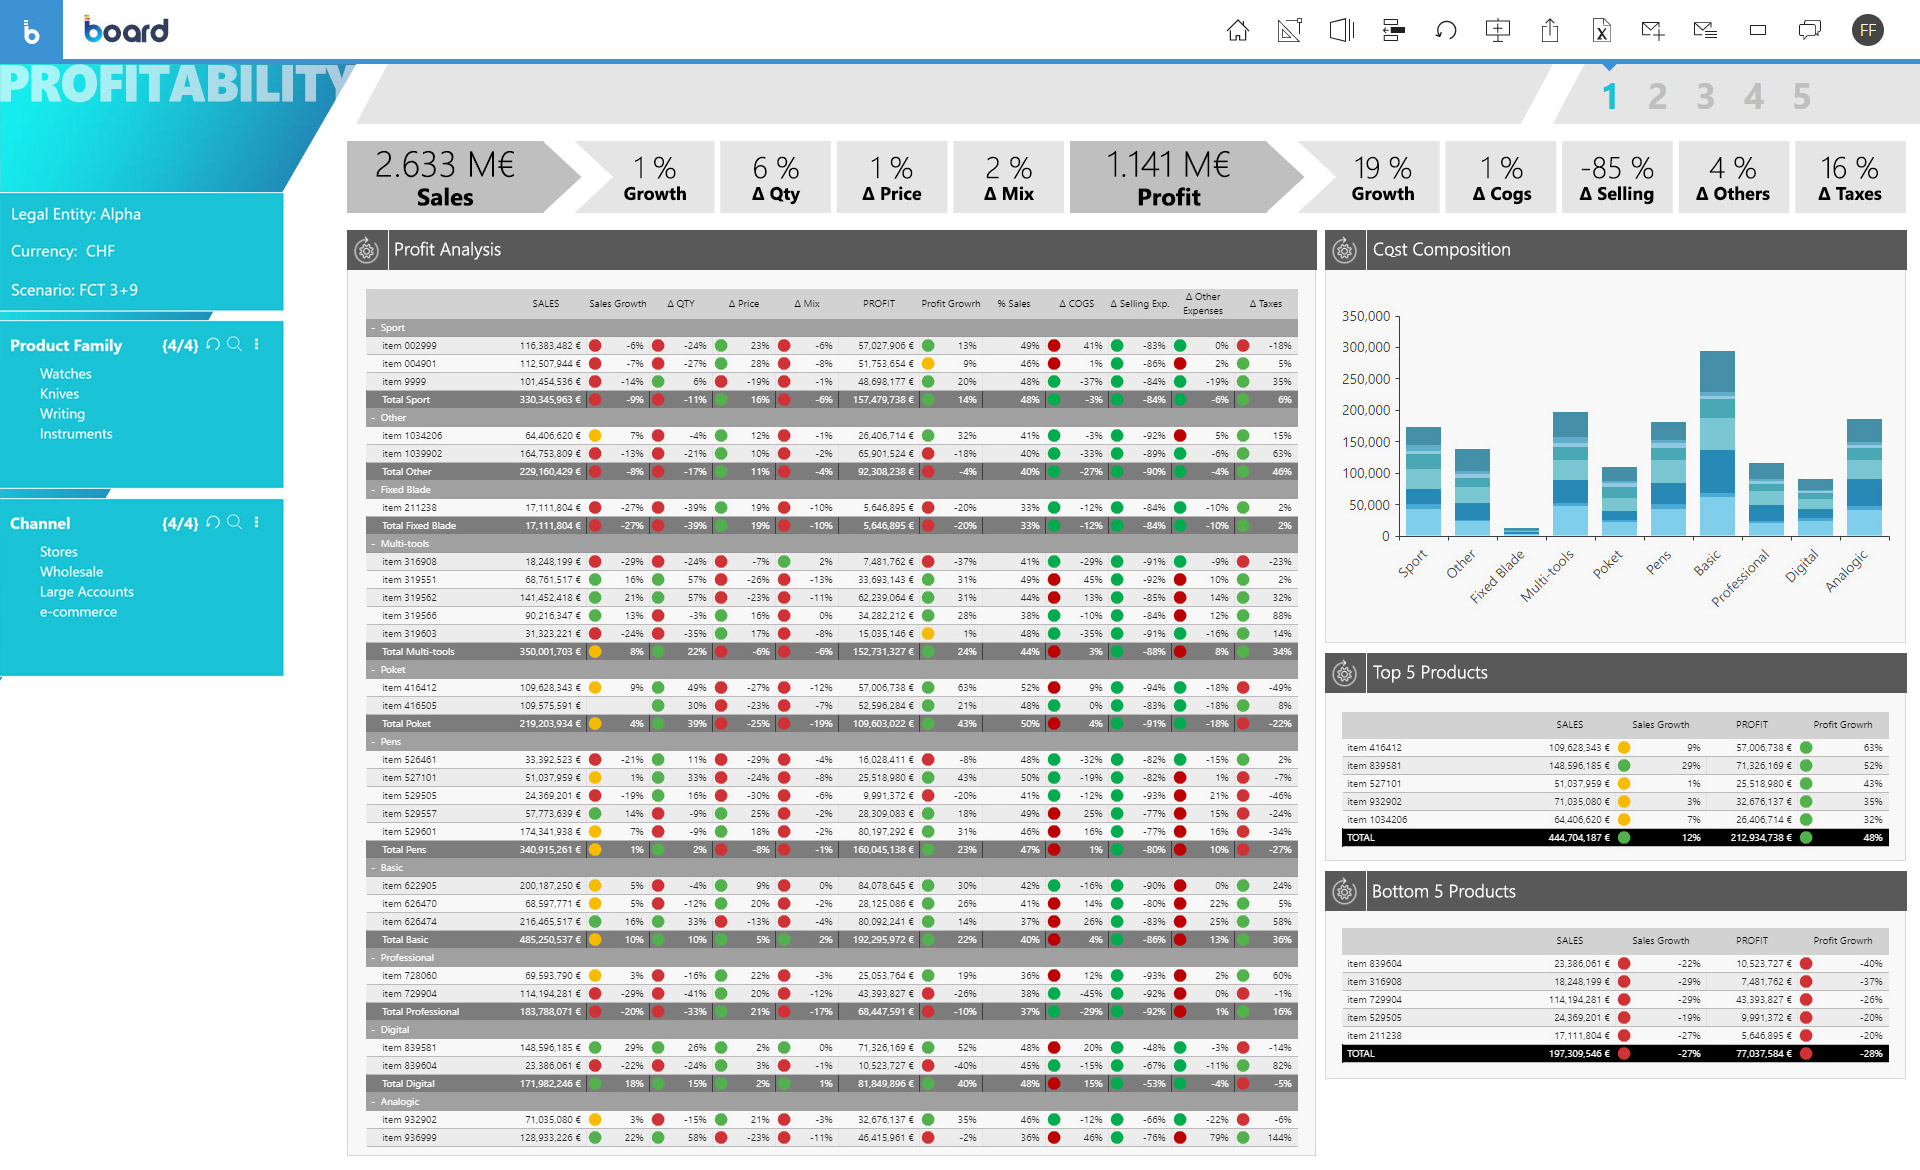
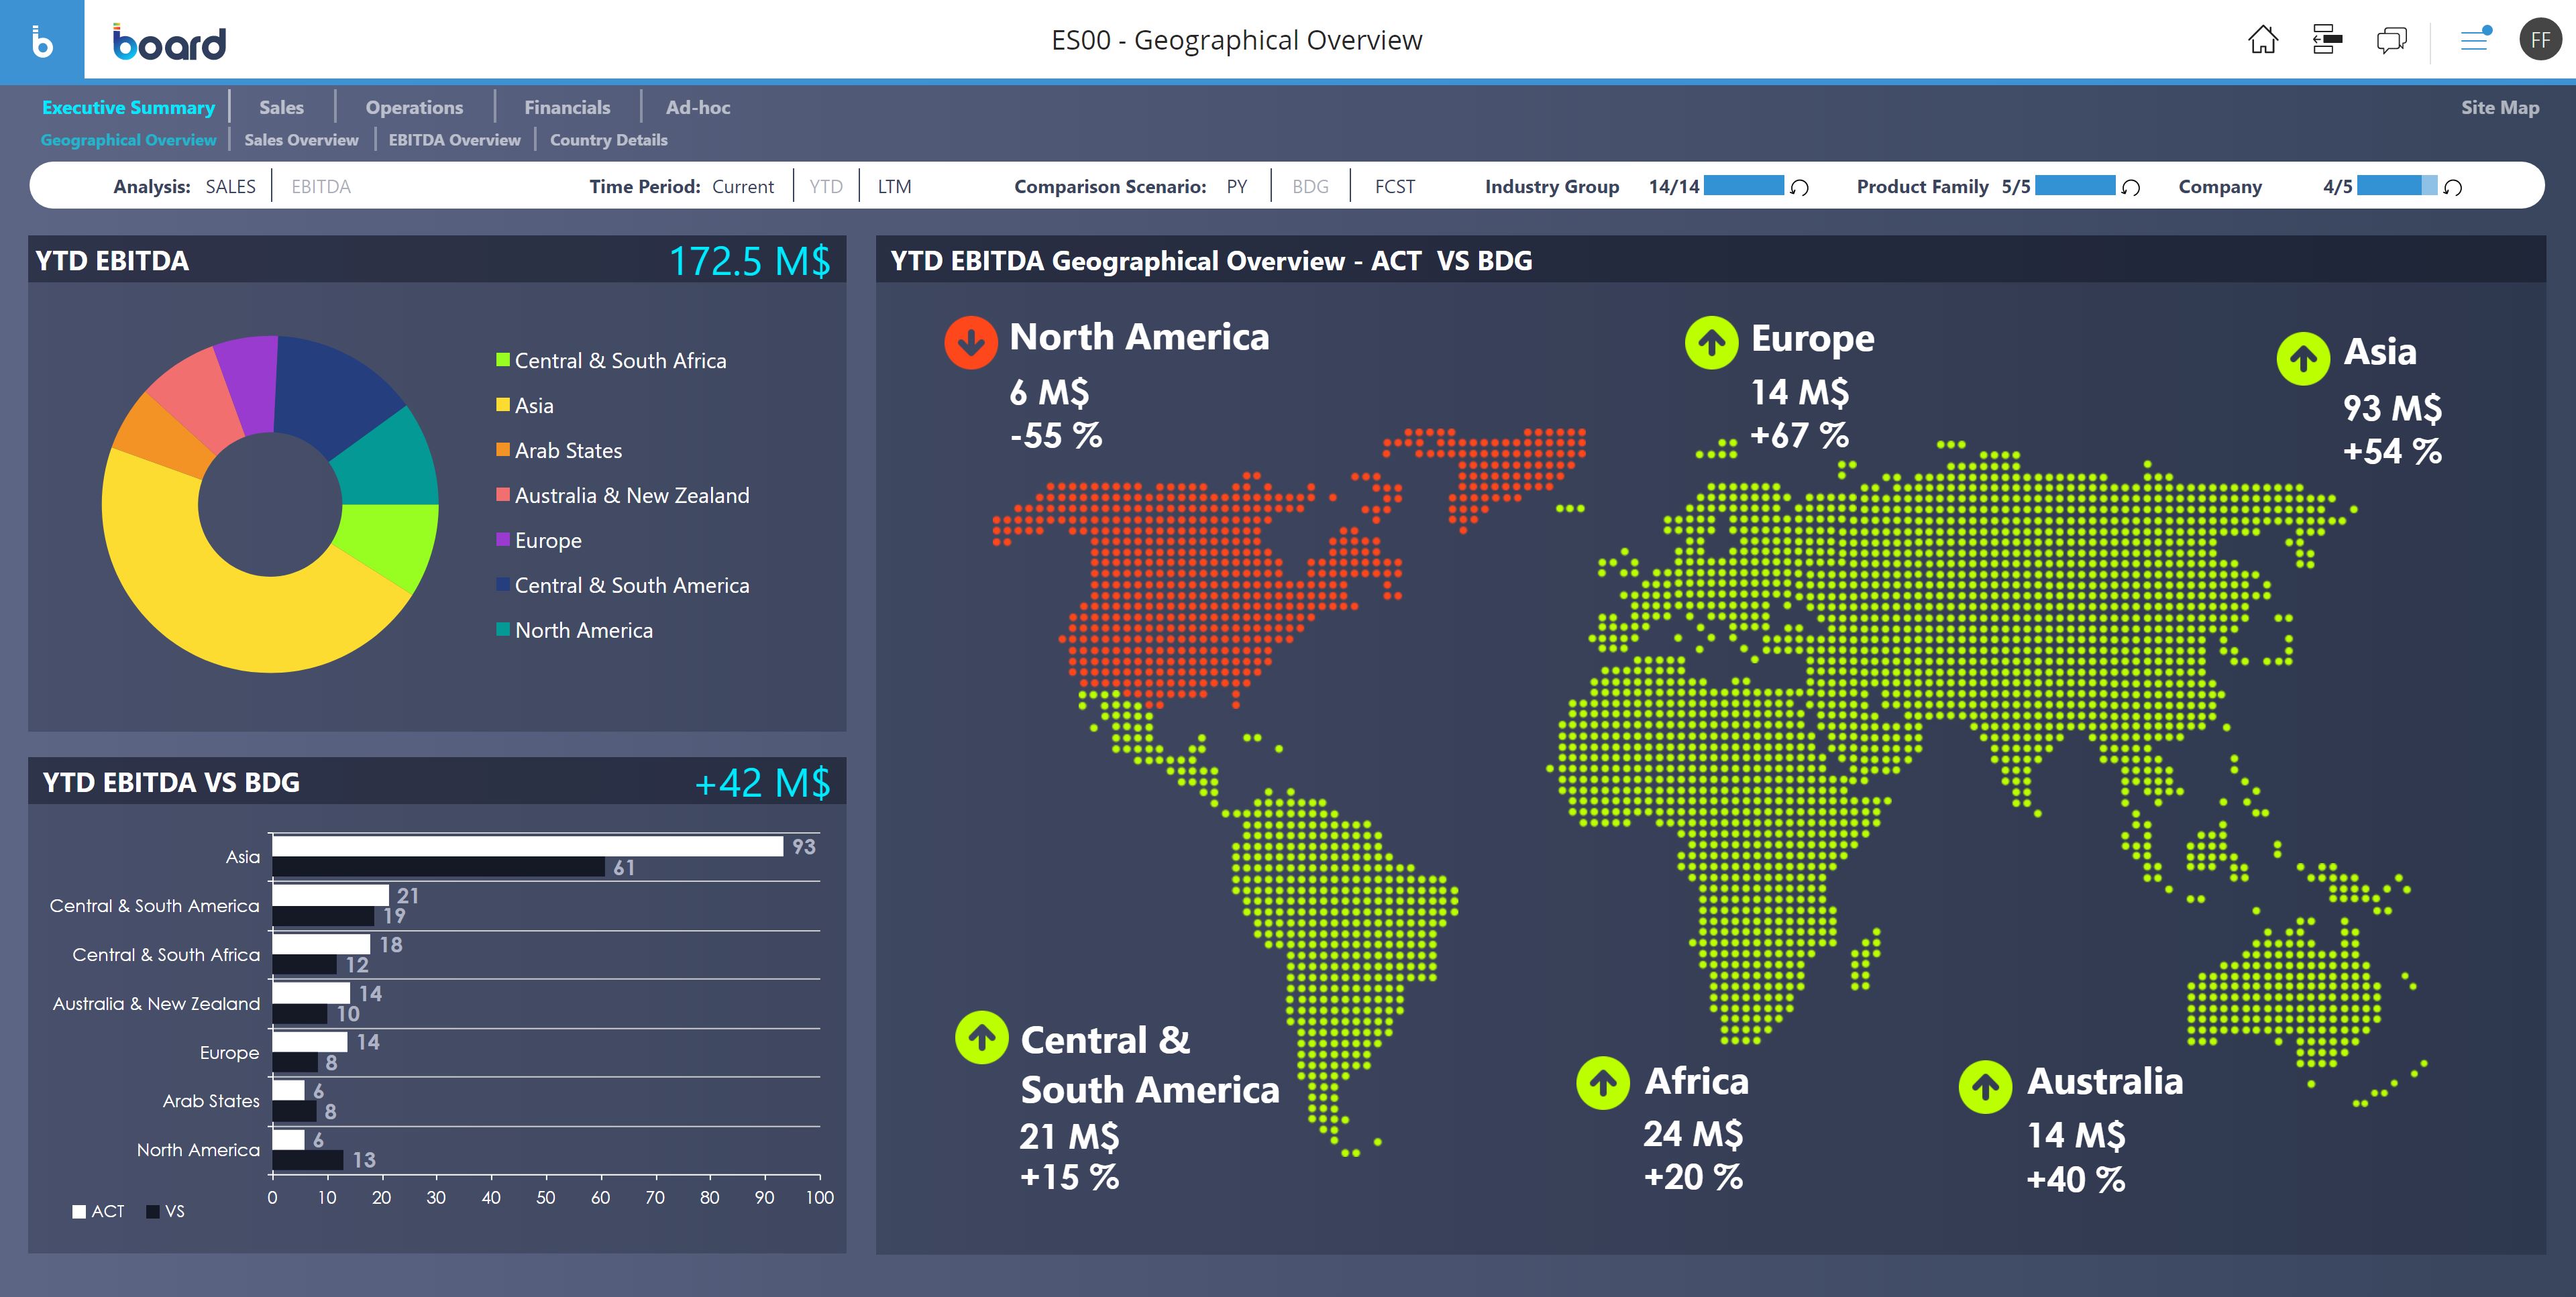
- Easy to read reports
- Improves workflow and planning
- Optimal integration for any scenario
- Reliable data processing.
Cons
- PDF export is not the fastest
- Slow tech support response time
Return on Investment
- Time optimization saves money
- Planning is improved thanks to Board
- Reports are easy to read
Other Software Used
Sage CRM


