Dynatrace is an APM scaled for enterprises with cloud, on-premise, and hybrid application and SaaS monitoring. Dynatrace uses AI-supported algorithms to provide continual APM self-learning and predictive alerts for proactive issue resolution.
$0
per synthetic request
IBM Cloudability
Score 8.8 out of 10
N/A
IBM Cloudability is a cloud cost management and optimization (FinOps) tool that enables IT, finance, and business teams to optimize their cloud spend across all cost sources, all maturity levels, and for all stakeholders.
N/A
LogicMonitor
Score 9.1 out of 10
Mid-Size Companies (51-1,000 employees)
LogicMonitor’s SaaS-based platform, LM Envision, enables observability across on-prem and multi-cloud environments. It provides IT and business teams operational visibility and predictability across their technologies and applications.
N/A
Pricing
Dynatrace
IBM Cloudability
LogicMonitor
Editions & Modules
Synthetic Monitoring
$0.001
per synthetic request
Kubernetes Platform Monitoring
$0.002
per hour for any size pod
Real User Monitoring
$0.00225
per session
Application Security
$0.018
per hour for 8 GIB host
Infrastructure Monitoring
$0.04
per hour for any size host
Full-Stack Monitoring
$0.08
per hour for 8 GIB host
No answers on this topic
Enterprise
Contact sales team
Website Monitoring
Contact sales team
Offerings
Pricing Offerings
Dynatrace
IBM Cloudability
LogicMonitor
Free Trial
No
Yes
Yes
Free/Freemium Version
No
No
No
Premium Consulting/Integration Services
No
No
Yes
Entry-level Setup Fee
No setup fee
No setup fee
No setup fee
Additional Details
—
—
Our platform is broken down into Pro and Enterprise Pricing. Pro includes monitoring for all of your cloud, hybrid, and on-premises infrastructure. Our Enterprise package includes all of this, plus our AIOps and Machine Learning functionality that provides dynamic thresholds, root cause analysis, anomaly detection and more!
LogicMonitor only charges by the device. What is considered a device? A device is anything with an IP address that you want to monitor, including a physical device or a cloud resource. This means multiple data sources under the same IP address can be monitored for the same price. Unlike some monitoring platforms. we don’t charge per node, interface, or metric.
Some of these tools we use alongside Dynatrace, and others we chose Dynatrace over. Since Ruby is not a Dynatrace supported language, we use New Relic to monitor those applications. We are an AWS shop so naturally, we use CloudWatch metrics for things like auto-scaling where it …
Hands down, from a feature, support, and AI standpoint, Dynatrace is the clear winner. OneAgent removes the need for configuration management. They have frequent releases and are stable.
IBM Cloudability
No answer on this topic
LogicMonitor
Verified User
Professional
Chose LogicMonitor
We are only in a POC with LogicMonitor but what really makes this tool stand out in our opinion is its excellent discovery capabilities. I'd put this on a par with Dynatrace (which uses AI to discover and map out application and associated infrastructure) for sure. Of course, …
I did use Dynatrace for my freelance work, as I was doing some projects on weekends for some extra income. We used to protect all of the financial information. However, LogicMonitor is used by our organization. I must say I really like LogicMonitor, as it is the best solution …
One of our main objectives while choosing a next gen monitoring platform was scalability in that regard we were not interested in legacy on prem solution and SAAS model was our preferred solution which supports rapid scalability when needed. Another important objective was to …
Dynatrace is well suited to a number of tasks. It is important to determine who the end users are and gather good information to tailor their experience accordingly. For instance, business/marketing should not have access to some of the more technical data, and business metrics can be a distraction for IT operations personnel.
I don't have much exposure to the tool. I mean, I'm relatively new to using it as a platform, but I haven't really seen the benefit, especially with the actual renewal talks at the company. I'm not seeing what AWS native solutions are, how probability improves on that as opposed to just using AWS and just, I don't know. I'm not seeing the benefit, at least in my eyes.
The example I will give will explain my rating for it. One employee left our company due to a personal issue, and at that time, our team was working on a highly secure project. He wanted to take revenge on our company, so he began hacking our systems from the outside. Since it appears that someone without authorization is attempting to access our systems, LogicMonitor simultaneously alerted our team to the problem. We stopped that threat with LogicMonitor.
We loved Dynatrace's ability to show the data flow - from the front end points through the back end points straight to the database and various API's. It was advanced in its data visualization. This is useful for debugging - showing when/where the errors are. It can even enable non-technical individuals in the corporation to help debug
Dynatrace has some great highly customizable integration options as well as monitoring. You can configure your layout & integration options to create custom monitoring alerts for your applications performance. Further you can increase the extensibility of using a REST API on your architecture.
Some advanced dev-ops systems are utilizing Kubernetes/docker aswell as Node.JS - Dynatrace was able to log and help understand all of our dev-ops needs. It gave us native alerts based off of deviations from the baseline that we set during initial configuration. These metrics are priceless.
Dynatrace does not monitor easily on a C-based application.
The way DPGR is addressed by Dynatrace is not very complete, and not clear. One thing is to mask the IP and request attributes but is not enough, the replay session feature is great but raises serious questions about user tracking.
For me, it is a lot of anomaly detection and I think there's a lot of improvement that can be made to show anomalies that happen over time because if it's just day to day or week to week, you may not see the change. But if you see the trend over a period of time, show me something that has grown 40%, 50% over the past three months and maybe you can do those things and we just haven't figured them out yet. So we are very new to the product, but I think anomaly detection for me is one of the bigger things.
We have already renewed our purchase with the company. They make it easy for us to get a temporary license for our contingency site that is only used for testing twice a year. We are expanding our license with for this tool. We find it very useful and will renew it again.
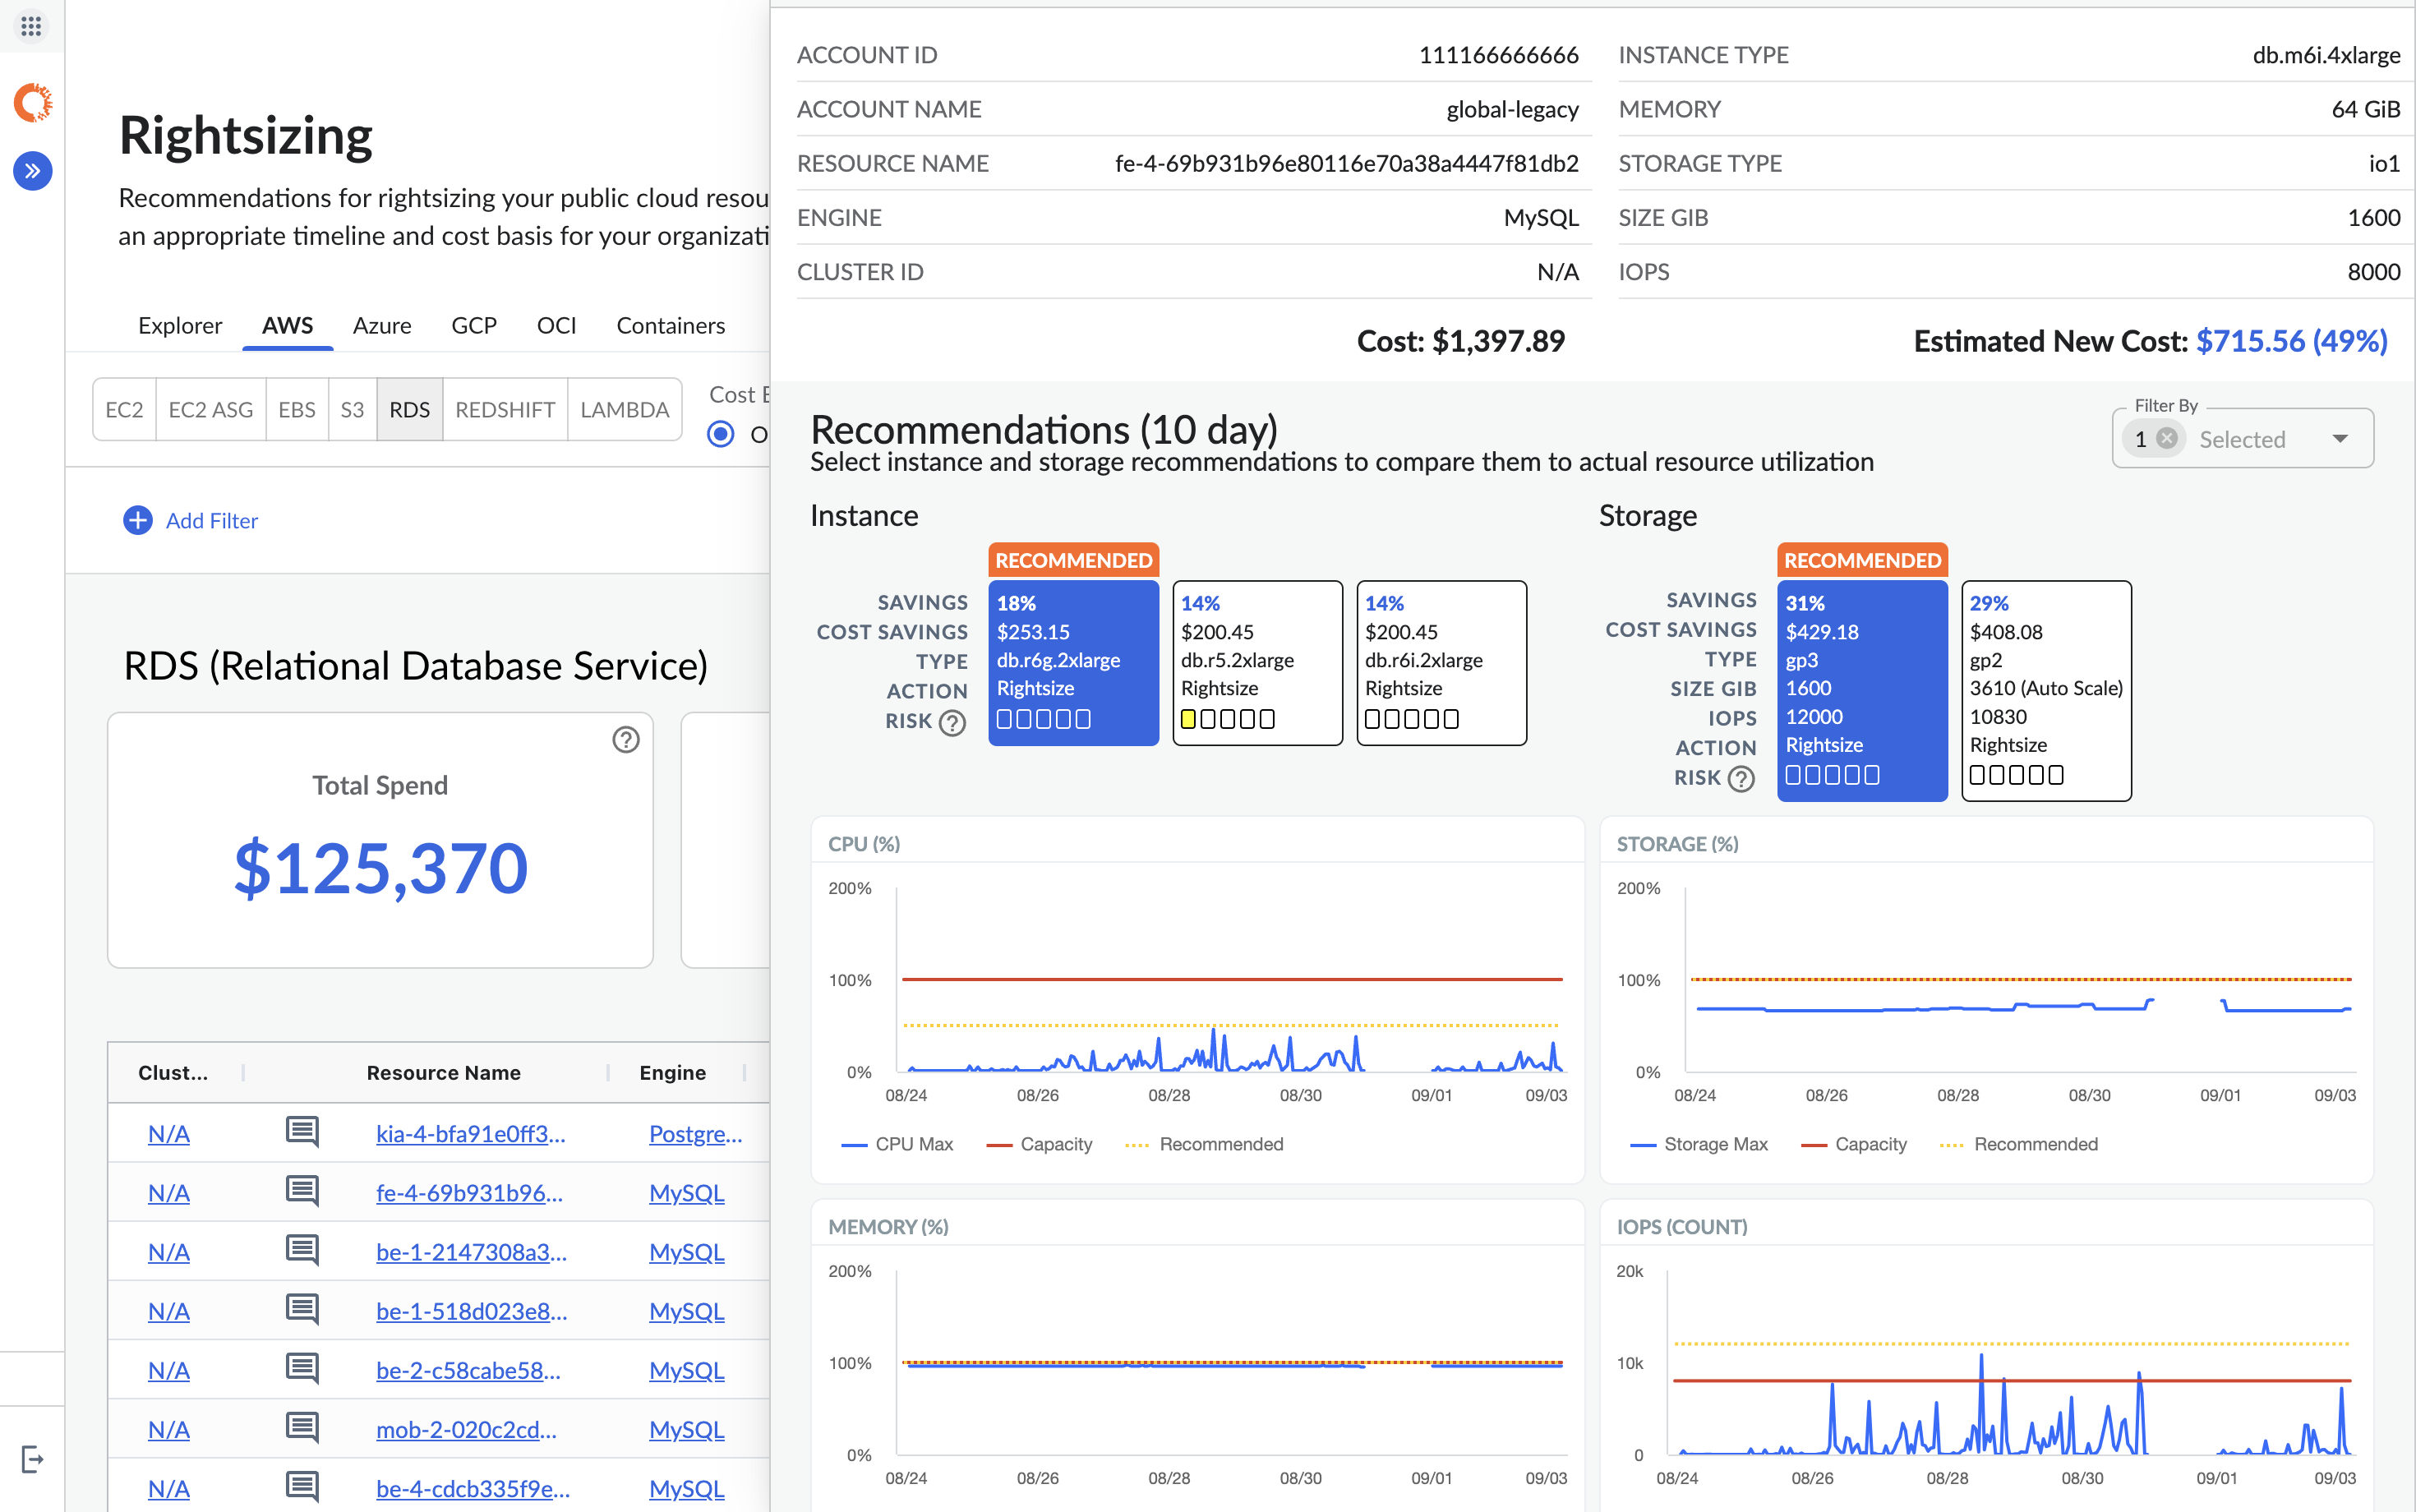
Cloudability has been one solution for almost all of our FinOps needs. Except for Data transfer costs, we have covered all use cases and have made significant savings across our cloud infrastructure. Reporting has provided management a deeper analysis into their spending and helped them forecast their budgets for next year
This product has met virtually all of our needs. It was easy to implement and has been simple to support. Customization has been intuitive with many options available. They keep adding features and expanding available options. The future of LogicMonitor looks even better than it is today which is very promising. The management and support teams at LogicMonitor are always helpful
Dynatrace is great to use once you understand how to use it correctly and get used to the layout of it. While I do not actively use it every day, whenever I do use it, I do have to get refamiliarized with it. However, once you have your dashboards setup correctly with the data that you want to see when you first login to Dynatrace, it's amazing.
I gave the IBM Cloudability a 7/10 because it is good, but it could improve in some places. It is easy to get data uploaded and ready to view, but it is only up to a certain point in time, and not live data. As for how it looks, the interface is good for viewing, however navigation could be a little better, maybe supported with a roadmap.
Set up is super easy. Just stand up a small Linux or Windows server to act as a collector. There are no agents to install on monitored devices and all you need is SNMP or WMI access. When creating dashboards, all you have to do is find the widget on the device you want to show up and choose the menu option to add it.
Given that Dynatrace has become an informal industry standard, the plethora of information available on forums is massive. Most problems or roadblocks you come across are most likely (almost certainly, in fact) already solved and solutions available on these forums. The tech support at Dynatrace is also quite good, with prompt and knowledgeable people at their end.
While there have been few support cases where the experience was good. But in multiple support cases it's firstly delayed and even after weeks or months of time, team is not able to provide us with the RCA of the issue. All they are claiming is the issue is now fixed which I still see coming back after few days or weeks as we've never identified and addressed the root cause.
The sales team support we received was top notch. They worked hand in hand to make sure the product met all expectations. So far we have not really had to work with support that much; we have worked with setup team after purchase to deploy product fully. No issues so far and we are four weeks in.
Training was adequate, but the real learning begins when you start using the product, like most things. All major functions were covered so as an entry point, was a good introduction to the product. The training pace was good as well, the areas were covered in decent depth, without being too much of an information overload.
I did not truly dedicate myself to implementing LogicMonitor. However, I overheard the IT team members explain that "LogicMonitor is perfect for us as it has made most of the work automated, and implementation and training sessions were perfect for us." Thus, I can state that everything went smoothly with our implementation.
Synthetic Monitoring automatically does what other products do only through the use of other tools or through the development of user applications that still have a high cost of maintenance. The other products are not immediately usable and require many customizations. Through the use of configuration automatisms, you can be immediately operational and, in our case, we detected several imperfections in the applications.
Before Apptio we extensively used the cloud native and in house automated and developed cost optimization tool using python , powershell and leveraging the various cloud native services like AWS systems manager , Azure Functions and Azure automation run books.
Basically, we did not have any idea about it and how to choose, but we asked one of our former bosses, as they were very experienced with it, so they helped us by clarifying a few things between New Relic and LogicMonitor, as they told us that if you are looking for an automated option, then there is no better option than LogicMonitor.
Pricing seems to be getting more and more aggressive, I worry that it's going to turn into ServiceNow or SAP and everything minor feature will be an extreme cost that prices out us and our customers
Haven't really used it but our initial onboarding PS was disappointing. Felt like we were being told what we needed to cover as opposed to what we wanted to cover. In addition, we were pushed into using the PS in tight time frames and we were not ready to do so.