Looker is a BI application with an analytics-oriented application server that sits on top of relational data stores. It includes an end-user interface for exploring data, a reusable development paradigm for data discovery, and an API for supporting data in other systems.
N/A
Sigma
Score 8.2 out of 10
N/A
Sigma Computing headquartered in San Francisco provides a suite of data services such as code free data modeling, data search and explorating, and related BI and data visualization services.
N/A
ThoughtSpot
Score 8.5 out of 10
N/A
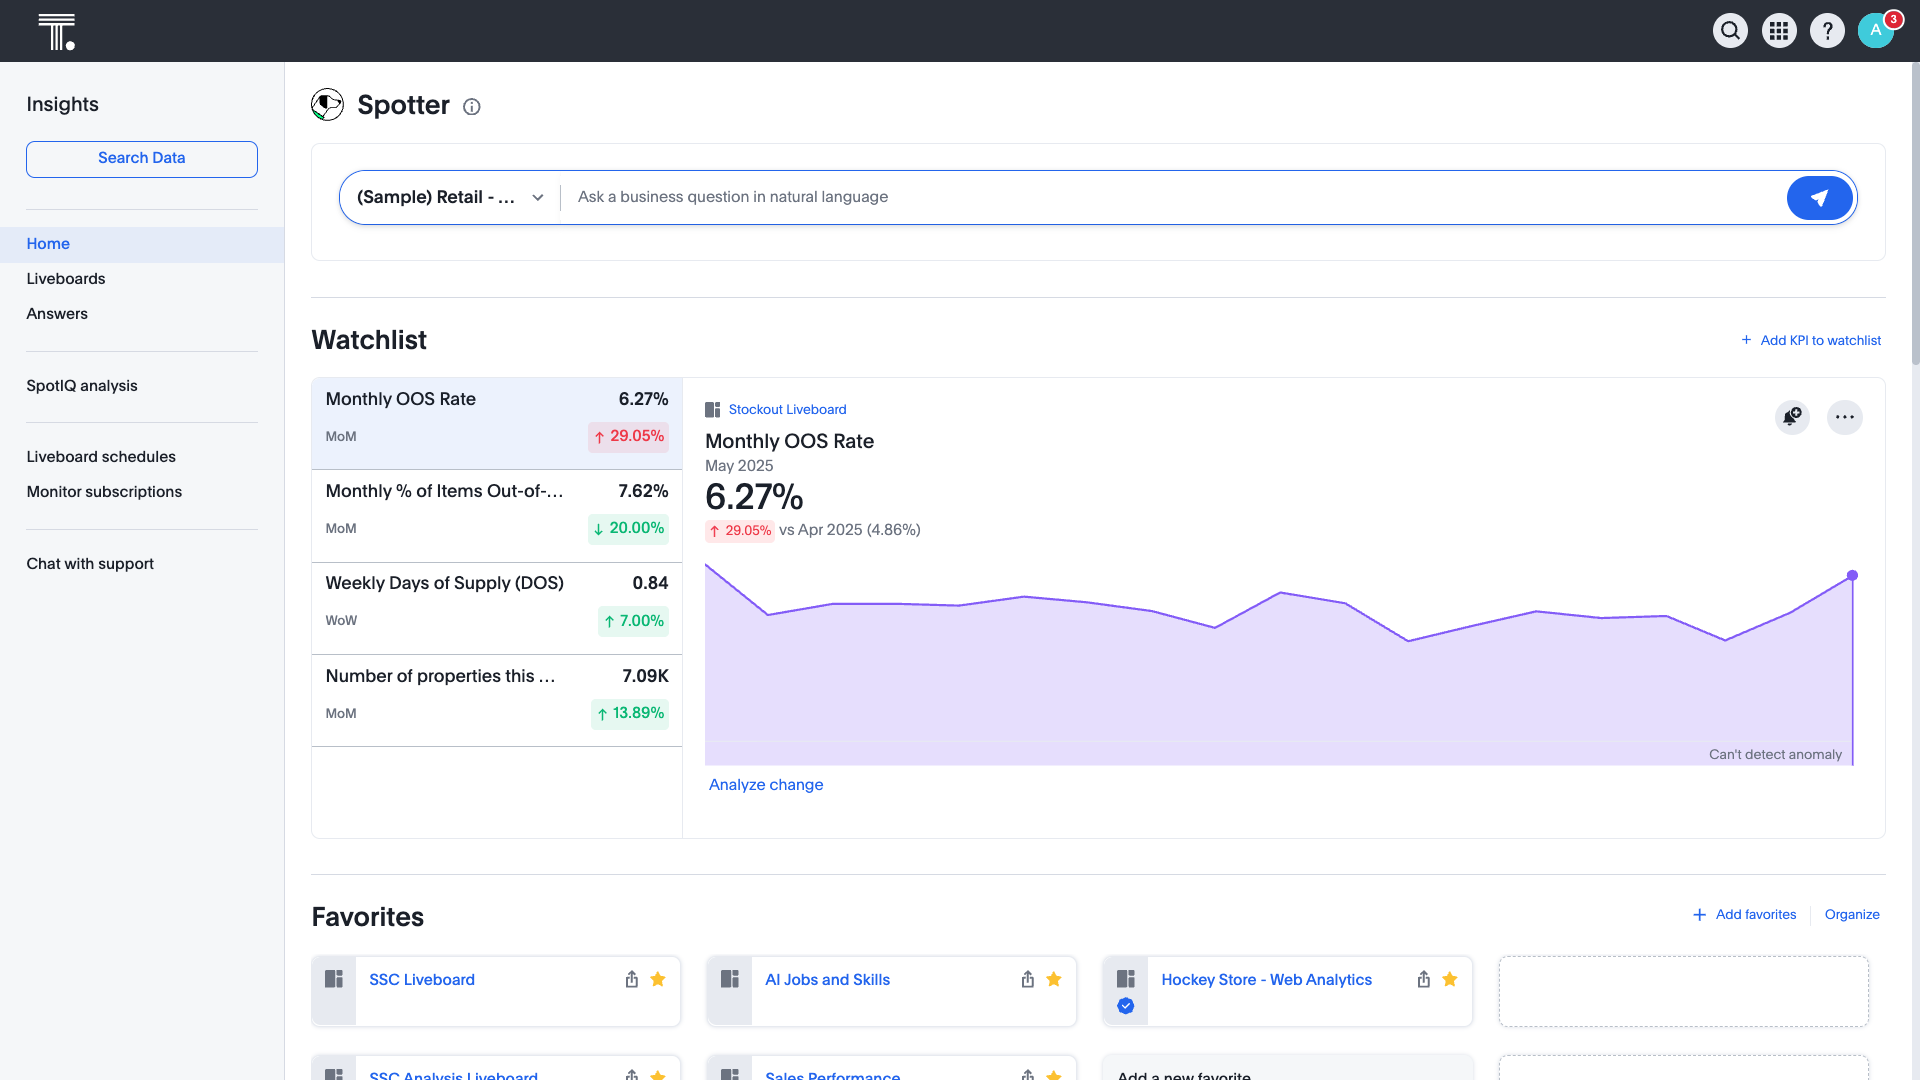
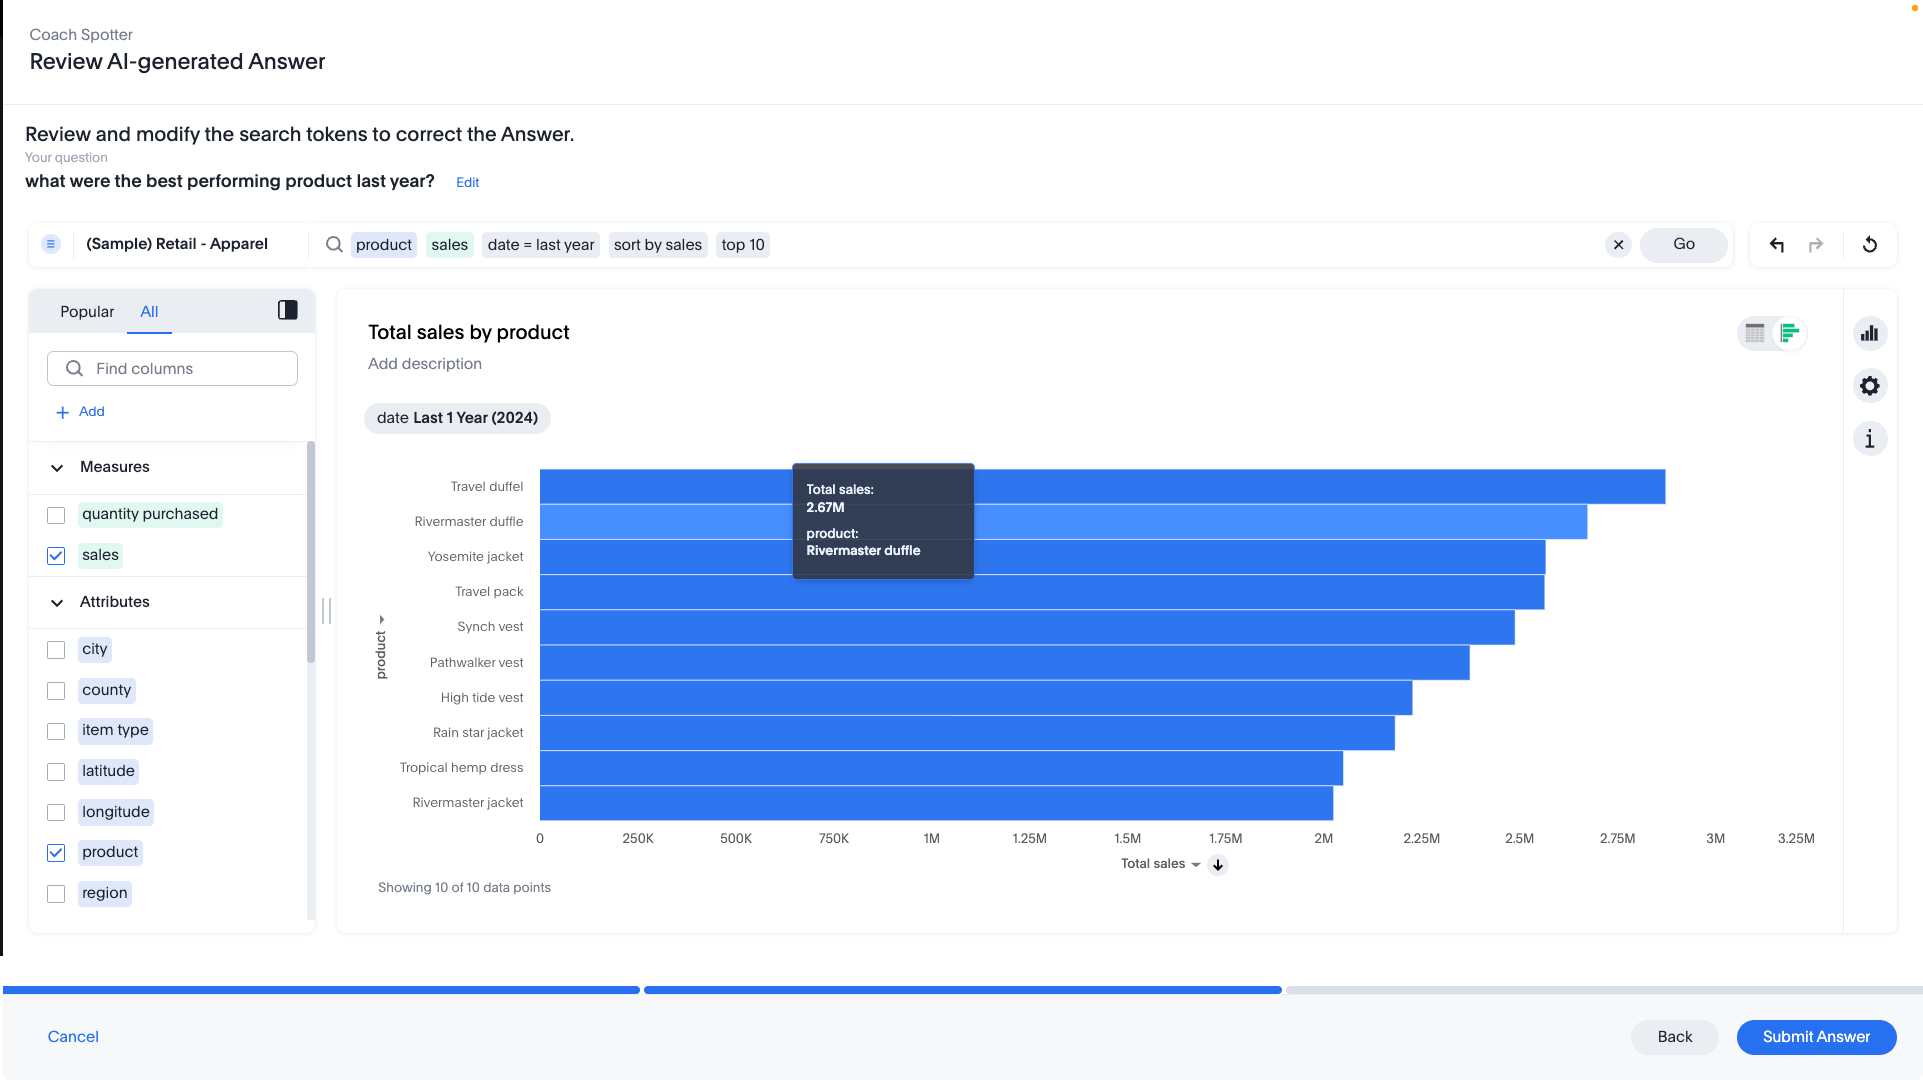
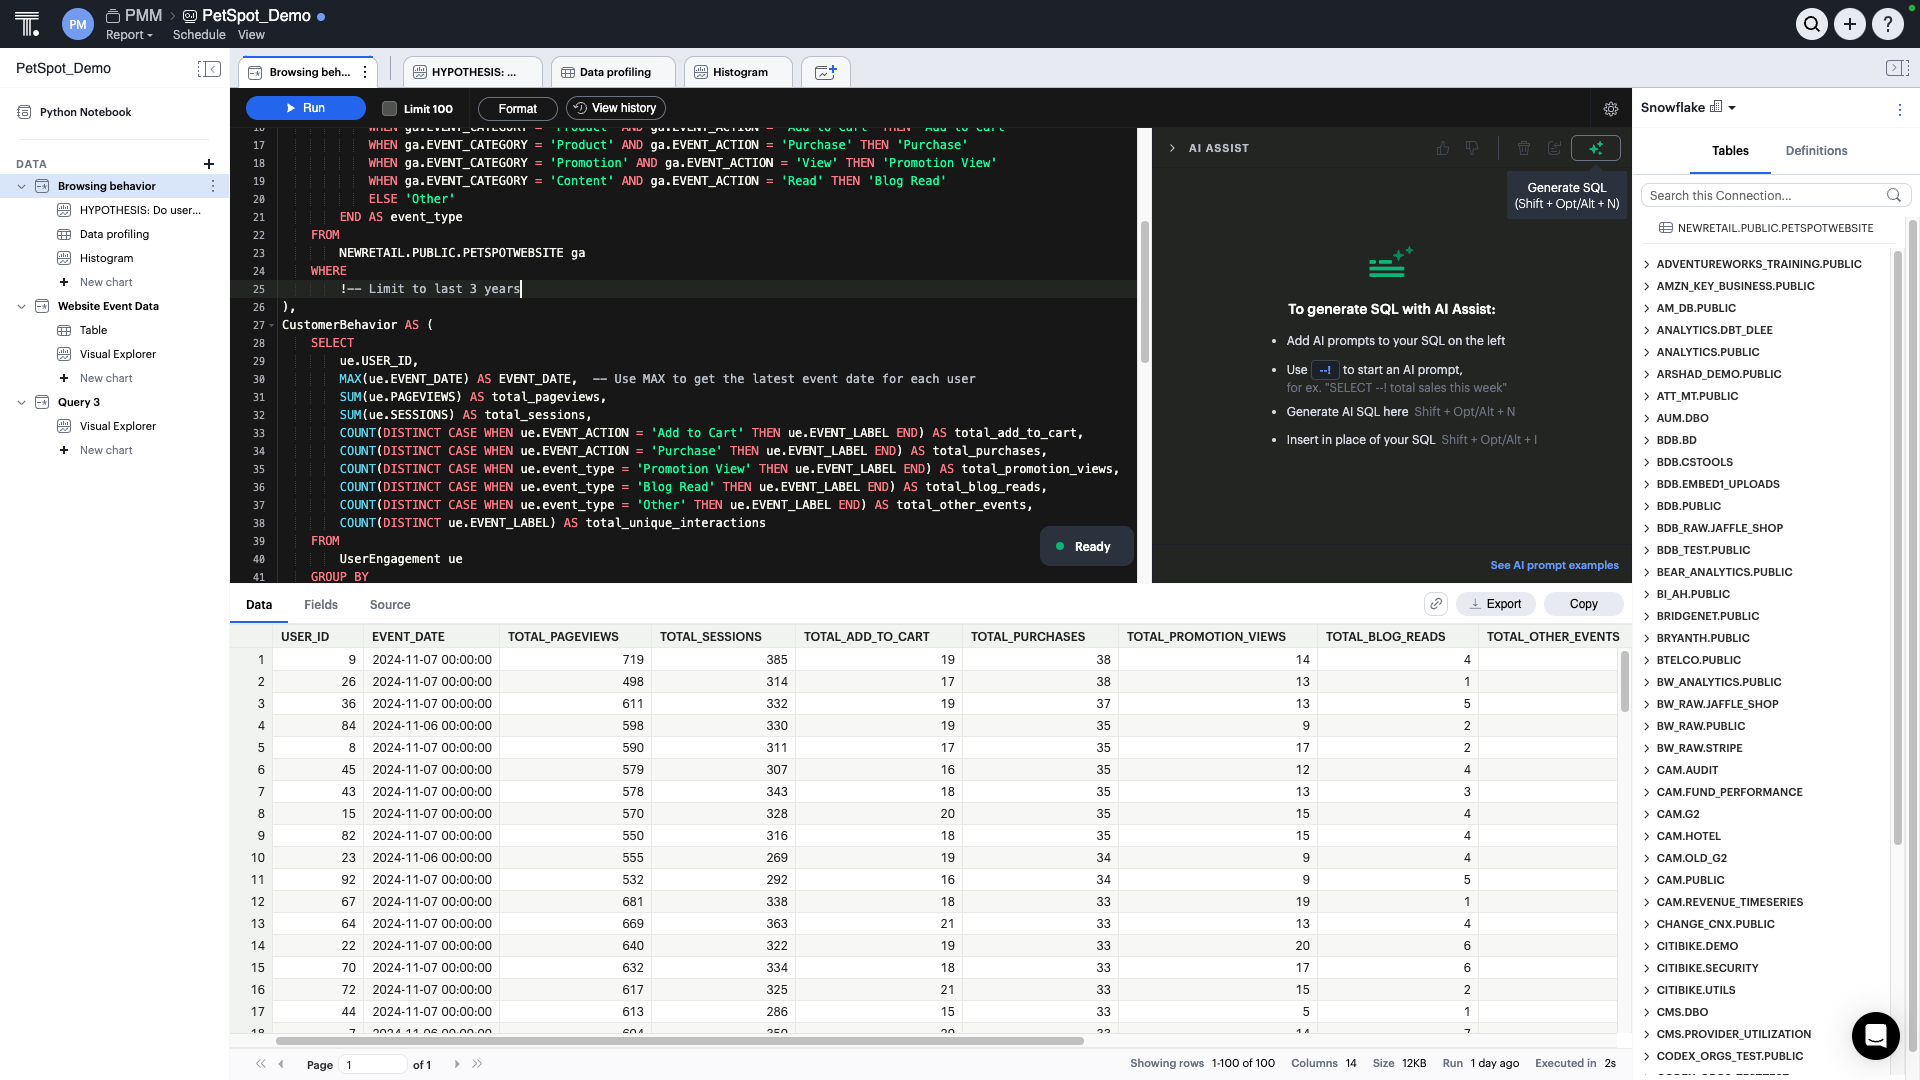
ThoughtSpot is an Agentic Analytics Platform for enterprises where users ask data questions using natural language and get answers with AI. Code-first for data teams and code-free for business users, ThoughtSpot can handle large, complex cloud data at scale.
$1,500
per year (5 users)
Pricing
Looker
Sigma Computing
ThoughtSpot
Editions & Modules
No answers on this topic
No answers on this topic
Thoughtspot Analytics - Pro
$50
per month (billed annually) per user (25-1000 users)
Thoughtspot Analytics - Enterprise
Custom
Offerings
Pricing Offerings
Looker
Sigma
ThoughtSpot
Free Trial
Yes
Yes
Yes
Free/Freemium Version
No
No
Yes
Premium Consulting/Integration Services
Yes
No
Yes
Entry-level Setup Fee
Required
Optional
Optional
Additional Details
Must contact sales team for pricing.
Contact us for pricing.
—
More Pricing Information
Community Pulse
Looker
Sigma Computing
ThoughtSpot
Considered Multiple Products
Looker
Verified User
Analyst
Chose Looker
There are some specific use cases where other tools are not useful in our organization. Some software solutions are shared with other organizations inside the company and Looker is the only tool where we can collaborate good enough.
I choose Looker when I need quick charts. It is easier to start and configure, browser-based, and easy to connect with Google Sheets. This gives it a good competitive advantage when comparing pricing—other similar tools have expensive licenses. In a corporate Google …
I was not involved in the decision-making process, and we stopped using chartio because it was discontinued. Chartio was great for looking under the hood at individual queries. Sigma is superior in the visualization aspects - it looks more professional and clean-cut. I've …
With Looker, to be effective, a substantial amount of coding & modeling needs to happen in LookML. Being another language to learn, users have to context switch again from at a minimum either SQL or Python into LookML. The concept of being able to source control, code review, …
I'd rate Sigma to be extremely similar to Sisense except it looks not as nice. I would say that as a tool, Sigma is more user-friendly than Tableau, Power BI, Trevor, and Metabase.
I do feel that Looker is far more powerful and looks great, but I also recognize that Looker does …
I am not an expert in any of these, though from my brief exposure to Looker it felt like a steeper learning curve, more appropriate to companies with dedicated and skilled BI engineers, whereas Sigma (and Tableau, and Looker Studio) offer a quicker and more intuitive interface …
maintianed is very user friendly. Its various ways of embedding helped us in various aspects. The usage of control ids of the filters as parameters helped us in optimizing very longSQL queries. The live Support team every weekday is a very great intiative that helped in quick …
Sigma has the capabilities of the other BI tools. I think it's pretty user friendly and easy to learn. Many of our stakeholders are used to using Excel so it's nice that it is a smooth onboarding process for them. We haven't looked into much of the visualization capabilities so …
Sigma is by far the best. It is easiest to learn and easiest to use on a day to day basis. I never have to wait for dashboards to load and it's very easy to understand the variables that are going into my visualizations. Best of all I can manipulate the data within Sigma …
flexibility, works really well with Snowflake, export capability, level of support, the fact that Sigma Computing is a start up and improving so quickly. Web based software
Google Data Studio is free, intuitive and easy to use but the analytics are limited. In-table calculations can't be done easily and it lacks a native connector for Snowflake. Moreover, table columns cannot be arranged in any order--they must be dimension first, and metrics …
Easy entry tool that can grow with you as the data expertise and literacy grows within the org. Start up effort and cost is too high in the tools that are built for large corporate solutions.
Sigma was chosen for three reasons. 1. Excel-like workflow. Many of our researchers have a background in excel, and the excel-like workflow Sigma offers enabled them to get up and running quickly. 2. Embeds. We can easily embed dashboards into our SAS platform 3. Price. Sigma …
Sigma has a good balance of affordability, self-service ability for technical teams, and ease of use. We chose it over the others basically based on ROI.
Sigma Computing was our top choice due to the ease of use of the platform for end users doing self-exploration of data. The structure of the platform for how datasets are created and access provisioned was much better than other products we considered. Sigma Computing may not …
It is more flexible and PowerBI, easier work online, and share information with many users. Also the dashboards and beautiful, and the user experience is better. Performance used to be faster.
We use Looker for different use cases but, when it comes to reporting and sharing …
Compared to most reporting and analytics tools of a similar nature, ThoughtSpot seems to work particularly well with financial and sales related data. In terms of ease of use, ThoughtSpot ranks above average. On the other hand, there are dozens of basic features (esp. …
When data drives potential for new orders, Looker earns its place in our tech stack. If, on the other hand, we are hoping for pipeline generation, Looker is useful if you are willing to repeatedly go check customer utilizations .... it is not appropriate if you are hoping to automate data analysis for this purpose.
We were able to set up client-facing embedded reports with ease and security. The interface is not difficult to learn, although we may not be aware of or lack the necessary expertise to utilize more advanced features that would likely benefit us.
It is well suited when the same data is consumed by many different people with different analytics and visualization requirements because, if you have the data available in ThoughtSpot, every user can prepare different views. Also, it is a good reporting tool, you can get rid of slides if you have a good dashboard prepared, gaining flexibility and agility.
Show visited pages - sessions, pageviews - which programs are viewed the most.
Displays session source/medium views to see where users are coming from.
It shows the video titles, URLs, and event counts so we can monitor the performance of our videos.
It gives a graphic face to the numbers, such as using bar charts, pie graphs, and other charts to show user trends or which channels are driving engagement.
Our clients like to see the top pages visited for a month.
I like the drop-and-drag approach, and building charts is a little easier than it was before.
Beautiful visualizations. The visuals are distinct, clean, and easy to discern from one another.
Intelligent querying functionality. When looking to manipulate the data, the search function makes it easy to manipulate the features in the data, along with aggregating them in the way you'd like.
Embedding! It has been a smooth process thus far for our product & technical teams to work with ThoughtSpot and bring it into our product.
Sigma Computing does not allow custom ordering of pivot fields in pivot tables easily
Sigma Computing lacks functionality for creating tables or sections that dynamically adjust to the browser window's height while maintaining a fixed height textbox at the bottom
Sigma Computing does not provide straightforward options for formatting totals in tables, such as renaming 'Total' to 'Average', 'Team Total', etc
Sigma Computing does not support searching by individual tab names within a workbook
It would be great if ThoughtSpot can add the feature to filter by clicking on visualizations. i.e if I click on a particular data point in the chart if the full dashboard can filter just for that particular data point.
Color coding the heatmap with different colors like green to orange to red.
I give it this rating because it deems as effective, I am able to complete majority of my tasks using this app. It is very helpful when analyzing the data provided and shown in the app and it's just overall a great app for Operational use, despite the small hiccups it has (live data).
Sigma has helped us a lot and has become an integral part of our daily workflow. It would be difficult to switch to another platform and have to rebuild the numerous metrics and performance reports that we have already established
I give it just waiting because passport is brilliant and it has helped our organisation In advancing to the next stage in the age of AI. It has allowed or non-tech people to better service and clients in a cost-effective way. George port has allowed us to create new products for us and for our clients increasing our revenue streams and reducing clients churn
Looker is relatively easy to use, even as it is set up. The customers for the front-end only have issues with the initial setup for looker ml creations. Other "looks" are relatively easy to set up, depending on the ETL and the data which is coming into Looker on a regular basis.
It has a clean and modern interface. However, it is not completely intuitive. I think it would be better and easier to navigate with more Windows style drop down menus and/or tabls. There is a significant learning curve, but that may be due in part to the technical nature of this type of software tool.
The rating is because of the ease of use of the interface as it has a no code interface that makes it easy to setup data pipelines without extensive programming. Cloud native integration: It integrates seamlessly with cloud based data warehouses. Automated data loading, Scalability, Cost Effective, Transformations, Data Governance and security.
Somehow resources heavy, both on server and client. I recommned at least 50Mbs data rate and high performance desktop comouter to be abke to run comolex tasks and configure larger amount of data. On the other hand, the client does not need to worry when viewing, the performance is usually ok
Never had to work with support for issues. Any questions we had, they would respond promptly and clearly. The one-time setup was easy, by reading documentation. If the feature is not supported, they will add a feature request. In this case, LDAP support was requested over OKTA. They are looking into it.
They are very friendly and informative. They are quick in resolving our queries and help us understand very minute things as well. They are quick in creating feature tickets based on our custom requirements, and they would also create a bug ticket if there is any discrepancy and get that checked on time.
I give it this meeting because the team is not only help able to help us in the current solutions but also amazing and taking feedback and feeding it back to their development team which includes more products and features into ThoughtSpot
Looker Studio, you can easily report on data from various sources without programming. Looker Studio is available at no charge for creators and report viewers. Enterprise customers who upgrade to Looker Studio Pro will receive support and expanded administrative features, including team content management. So it's good.
With Looker, to be effective, a substantial amount of coding & modeling needs to happen in LookML. Being another language to learn, users have to context switch again from at a minimum either SQL or Python into LookML. The concept of being able to source control, code review, and deploy your models is a plus though.
Tableau is the gold standard for data visualization, no question. Power users will be able to create dazzling content that Sigma won't necessarily be able to easily match. However, since development usually happens via an extract, helping other users troubleshoot is an arduous process. Trying to re-do or un-do all the transformations and calculations that cause a certain number is very difficult.
With Sigma, all the queries happen directly against Snowflake and you can see the query logs. The data modeling happens right in a tabular, spreadsheet-like manner, so within only a few minutes, substantial transformations can happen, with visualizations just a few more clicks away.
We also explored Tableau Ask Data. Tableau is our standard for BI in our organization. We want to use the smallest amount of tools in our company to have the best adaption. ThoughSpot will fill a few gaps that we have with our current set up and will also enhance out offering for our employees in the transition of being more data driven within in near future
Because it is very reliable, inside the situation, we need strong internet connection to access a lot of data but easily never had any downtime except during the upgrades
Looker has a poignant impact on our business's ROI objectives. As an advertising exchange we have specific goals for daily requests and fill, and having premade Looks to monitor this is an integral piece of our operational capability
To facilitate an efficient monthly billing cycle in our organization, Looker is essential to track estimated revenue and impression delivery by publisher. Without the Looks we have set up, we would spend considerably more time and effort segmenting revenue by vertical.
Looker's unique value proposition is making analytical tools more digestible to people without conventional analytical experience. Other competing tools like Tableau require considerably more training and context to successfully use, and the ability to easily plot different visualizations is one of its greatest selling points.
Monitoring health of cloud platform has allowed the company to anticipate issues before they affect customers – Sigma prompted us building a canary monitoring process that provides customer container health.
Customer success has used an activity report to discover customers running runaway processes that they were unaware of, creating an alert to contact the customer and prevent an embarrassing situation.
Customer success uses the activity report to prompt conversations regarding increases or declines in behavior that led to increasing contract limits or addressing churn concerns.
Time to market ROI is massive vs hiring the full-time dedicated team to build and maintain a frontend multi-tenant SaaS data viz product.
It will be interesting to see over time how the advanced features play out in terms of usability and end value, such as Natural Search, which we are very excited about, and the machine learning tools.