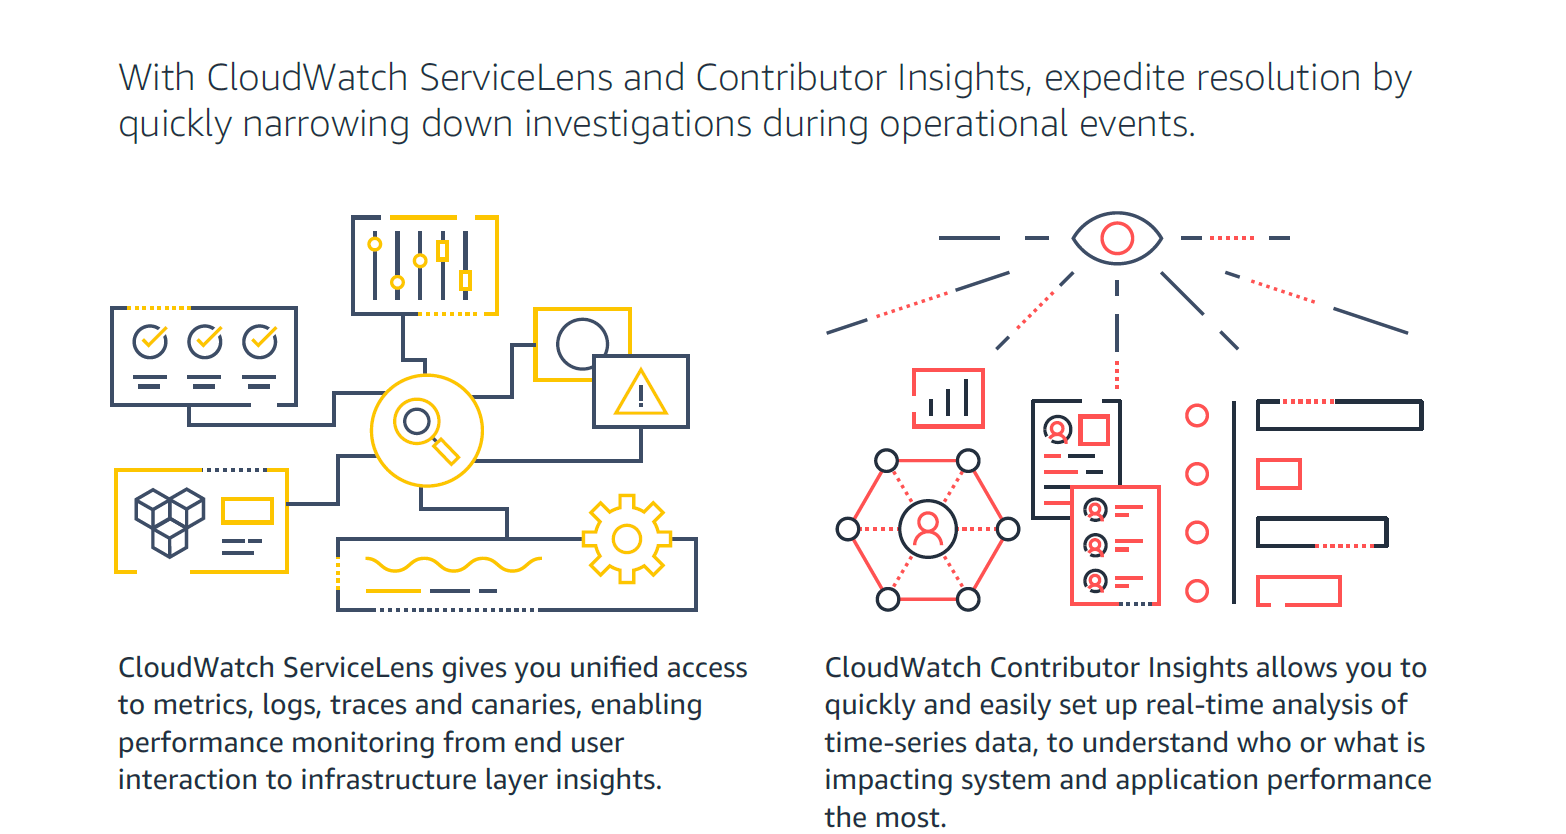
Amazon CloudWatch is a native AWS monitoring tool for AWS programs. It provides data collection and resource monitoring capabilities.
$0
per canary run
New Relic
Score8.1 out of 10
N/A
New Relic is a SaaS-based web and mobile application performance management provider for the cloud and the datacenter. They provide code-level diagnostics for dedicated infrastructures, the cloud, or hybrid environments and real time monitoring.
$0
No credit card required; 100 GB free ingest per month, 1 free full user + unlimited basic users, 8 days retention, 100 Synthetics Checks
Zabbix
Score8.5 out of 10
N/A
Zabbix is an open-source network performance monitoring software. It includes prebuilt official and community-developed templates for integrating with networks, applications, and endpoints, and can automate some monitoring processes.
N/A
Pricing
Amazon CloudWatch
New Relic
Zabbix
Editions & Modules
Canaries
$0.0012
per canary run
Logs - Analyze (Logs Insights queries)
$0.005
per GB of data scanned
Over 1,000,000 Metrics
$0.02
per month
Contributor Insights - Matched Log Events
$0.02
per month per one million log events that match the rule
Logs - Store (Archival)
$0.03
per GB
Next 750,000 Metrics
$0.05
per month
Next 240,000 Metrics
$0.10
per month
Alarm - Standard Resolution (60 Sec)
$0.10
per month per alarm metric
First 10,000 Metrics
$0.30
per month
Alarm - High Resolution (10 Sec)
$0.30
per month per alarm metric
Alarm - Composite
$0.50
per month per alarm
Logs - Collect (Data Ingestion)
$0.50
per GB
Contributor Insights
$0.50
per month per rule
Events - Custom
$1.00
per million events
Events - Cross-account
$1.00
per million events
CloudWatch RUM
$1
per 100k events
Dashboard
$3.00
per month per dashboard
CloudWatch Evidently - Events
$5
per 1 million events
CloudWatch Evidently - Analysis Units
$7.50
per 1 million analysis units
Free (Forever)
$0
No credit card required; 100 GB free ingest per month, 1 free full user + unlimited basic users, 8 days retention, 100 Synthetics Checks
Telemetry Data Platform
$0.25
per month per extra GB data ingest (after first free 100GB per month)
Incident Intelligence
$0.50
per month per event (after first 1000 free events per month)
Standard
$99
per month per full user (after first free full user - unlimited free basic users)
Pro
Contact sales team
Enterprise
Contact sales team
No answers on this topic
Offerings
Pricing Offerings
Amazon CloudWatch
New Relic
Zabbix
Free Trial
Yes
No
No
Free/Freemium Version
Yes
Yes
No
Premium Consulting/Integration Services
Yes
No
No
Entry-level Setup Fee
No setup fee
No setup fee
No setup fee
Additional Details
With Amazon CloudWatch, there is no up-front commitment or minimum fee; you simply pay for what you use. You will be charged at the end of the month for your usage.
—
—
More Pricing Information
Community Pulse
Amazon CloudWatch
New Relic
Zabbix
Considered Multiple Products
Amazon AWS
Verified User
Chose Amazon CloudWatch
CloudWatch is incredibly cheap compared to New Relic and much more intuitive and easy to use than Nagios. It requires no setup, expertise, or otherwise extensive knowledge to use.
A de minimis incentive was given to thank the reviewer for their time. The incentive was not used to bias or drive a particular response, nor was the incentive contingent on a positive endorsement. More Info
Verified User
Chose Amazon CloudWatch
CloudWatch's log search features are impoverished compared to PaperTrail's or Loggly's. However, CloudWatch aggregates logs from Lambda, ECS, API Gateway and more out-of-the-box. You do not need to manage anything. You do not need to worry about an errant logging configuration …
A de minimis incentive was given to thank the reviewer for their time. The incentive was not used to bias or drive a particular response, nor was the incentive contingent on a positive endorsement. More Info
Verified User
Chose Amazon CloudWatch
Amazon CloudWatch is fully integrated into your existing AWS account, and provides easy hooks into several different services to make a cohesive infrastructure. Unfortunately, using other services will not allow you to get into the weeds to do everything Amazon CloudWatch can …
A de minimis incentive was given to thank the reviewer for their time. The incentive was not used to bias or drive a particular response, nor was the incentive contingent on a positive endorsement. More Info
Verified User
Chose Amazon CloudWatch
I feel that CloudWatch will always remain the backbone of log analytics, events, and alarms. However, we can use other products in conjunction with it for better log analytics and monitoring. In my organization, we also ingest logs from CloudWatch to Splunk and ELK. This way we …
A de minimis incentive was given to thank the reviewer for their time. The incentive was not used to bias or drive a particular response, nor was the incentive contingent on a positive endorsement. More Info
Founder in Engineering at finbox.io (Internet, 1-10 employees)
Chose Amazon CloudWatch
We found that CloudWatch provides great value in terms of cost and maintenance time. It is cheap and requires virtually 0 upkeep. Of the other solutions we evaluated, Loggly and New Relic get quite expensive when you reach the volume of log data that we are processing even …
A de minimis incentive was given to thank the reviewer for their time. The incentive was not used to bias or drive a particular response, nor was the incentive contingent on a positive endorsement. More Info
New Relic
Verified User
Chose New Relic
Even though Catchpoint is an excellent tool when it comes to synthetics and end-user monitoring, also Amazon CloudWatch is a very good tool for monitoring cloud infrastructure, New Relic gives a complete solution of full-stack monitoring along with the features provided by …
A de minimis incentive was given to thank the reviewer for their time. The incentive was not used to bias or drive a particular response, nor was the incentive contingent on a positive endorsement. More Info
Verified User
Chose New Relic
Elasticsearch with its Beats technology is open source and has good community support. Amazon CloudWatch is another good alternative if you are using AWS because then the metrics are right there. In fact, I like CloudWatch especially because it is mostly free for basic use and …
A de minimis incentive was given to thank the reviewer for their time. The incentive was not used to bias or drive a particular response, nor was the incentive contingent on a positive endorsement. TR verified that a representative sample of customers was invited. More Info
Verified User
Chose New Relic
Amazon CloudWatch lacks a free trial. New Relic APM has a free trial. Having living, up to the minute graphs describing the health of various web apps & receiving monitoring alerts is a pro on both. New Relic seems to be a memory hog where Amazon CloudWatch is not. Amazon …
A de minimis incentive was given to thank the reviewer for their time. The incentive was not used to bias or drive a particular response, nor was the incentive contingent on a positive endorsement. More Info
Verified User
Chose New Relic
New Relic continuously focusing on Open Telemetry and agentic AI integrations which is helping users to focus on the latest technology and as we all know that in future Observability will be mostly on OTel concept and AI driven and New Relic focusing on those area. Apart from …
A de minimis incentive was given to thank the reviewer for their time. The incentive was not used to bias or drive a particular response, nor was the incentive contingent on a positive endorsement. More Info
Verified User
Chose New Relic
Its covers all the observability aspects as well as giving us more competitive pricing models compared to other providers that's why I like to use New Relic in place of other tools. And also it introduces new Agentic AI features as well as it adopts AI in its RCA. As an …
A de minimis incentive was given to thank the reviewer for their time. The incentive was not used to bias or drive a particular response, nor was the incentive contingent on a positive endorsement. More Info
Verified User
Chose New Relic
Tracing of the services calls between the entire components in the architecture is good and easy to understand. Dashboarding building process is simple. UI is simple.
A de minimis incentive was given to thank the reviewer for their time. The incentive was not used to bias or drive a particular response, nor was the incentive contingent on a positive endorsement. More Info
Verified User
Chose New Relic
Because of its easy to use, its good features, value for money.
A de minimis incentive was given to thank the reviewer for their time. The incentive was not used to bias or drive a particular response, nor was the incentive contingent on a positive endorsement. More Info
Verified User
Chose New Relic
New Relic has a native integration with the IaaS service that the company utilizes which made it very easy to set up, integrate, and it also has consolidated billing with that IaaS service which is a big plus for the organization. After evaluating, I also thought it had the …
A de minimis incentive was given to thank the reviewer for their time. The incentive was not used to bias or drive a particular response, nor was the incentive contingent on a positive endorsement. More Info
Verified User
Chose New Relic
My background before using NR was with Java enterprise systems. Cloudwatch has recently been mentioned by OPs to be a tool to consider.
A de minimis incentive was given to thank the reviewer for their time. The incentive was not used to bias or drive a particular response, nor was the incentive contingent on a positive endorsement. More Info
Software Development Director in Information Technology at Fresh Consulting (Internet, 51-200 employees)
Chose New Relic
We had originally looked into CloudWatch to monitor our resources since we have our stack built in AWS, but found that it would take additional work to setup the dashboards, alerts, and details that we wanted to see in our reports. It was worth the additional investment for us …
A de minimis incentive was given to thank the reviewer for their time. The incentive was not used to bias or drive a particular response, nor was the incentive contingent on a positive endorsement. More Info
Verified User
Chose New Relic
Along with New Relic, our engineering and SRE teams also use PagerDuty for setting up alerts, Datadog for APM and AWS CloudWatch for infrastructure level monitoring on AWS.
AWS CloudWatch is available as a service if you use AWS. We use Datadog for things similar to New Relic. A …
A de minimis incentive was given to thank the reviewer for their time. The incentive was not used to bias or drive a particular response, nor was the incentive contingent on a positive endorsement. More Info
Infrastructure Engineer in Information Technology at Matthews International (Internet, 1001-5000 employees)
Chose Zabbix
Most of the SolarWinds are separated out, whereas Zabbix includes templates and capabilities for all of them out of the box. Other solutions listed include most or all of them to varying degrees as well.
A de minimis incentive was given to thank the reviewer for their time. The incentive was not used to bias or drive a particular response, nor was the incentive contingent on a positive endorsement. More Info
Senior Devops Engineer in Information Technology at iENGINEERING (Information Technology & Services, 51-200 employees)
Chose Zabbix
Zabbix is very easy to configure and this tool provides a more active alert system. We have evaluated ipMonitor and CloudWatch but the scope for sending alerts is very limited and this tool is very efficient in sending alerts through emails, MS Teams, and even on SMS. We are …
A de minimis incentive was given to thank the reviewer for their time. The incentive was not used to bias or drive a particular response, nor was the incentive contingent on a positive endorsement. More Info
CEO in Information Technology at OpsStack (Internet, 51-200 employees)
Chose Zabbix
Zabbix was much better at handling traditional systems, and in ease of customization, both in the system itself, and customizing data sources, such as adding deep MySQL or JMX integrations. It's very good for organizing large-scale (hundreds or thousands of servers) systems; …
A de minimis incentive was given to thank the reviewer for their time. The incentive was not used to bias or drive a particular response, nor was the incentive contingent on a positive endorsement. More Info
Linux Engineer in Information Technology at Thomas Jefferson University Hospitals (Entertainment, 10,001+ employees)
Chose Zabbix
I personally prefer Zabbix over any other monitoring software that I have ever tried. Zabbix is so customizable that if there is a feature I need, I can easily implement it. I can then add that feature to a template in no time and have it applied to hundreds, or even thousands, …
A de minimis incentive was given to thank the reviewer for their time. The incentive was not used to bias or drive a particular response, nor was the incentive contingent on a positive endorsement. More Info
Linux Administrator in Information Technology at Rackspace, the #1 managed cloud company (Information Technology and Services, 11-50 employees)
Chose Zabbix
Nagios will always be at or near the top, but I really like how sleek Zabbix is. Also, once it's up and running its really helps keep things in order for you and your customers. As for PandoraFMS, it would have beat out Zabbix, but the documentation on PandoraFMS is really …
A de minimis incentive was given to thank the reviewer for their time. The incentive was not used to bias or drive a particular response, nor was the incentive contingent on a positive endorsement. More Info
For out business we find that AWS Cloudwatch is good at providing real-time metrics for monitoring and analysing the performance and usage of our platform by customers. It is possible to create custom metrics from log events, such people adding items to a basket, checking out or abandoning their orders.
A de minimis incentive was given to thank the reviewer for their time. The incentive was not used to bias or drive a particular response, nor was the incentive contingent on a positive endorsement. More Info
New Relic its an excellent tool for monitoring services used on the SAAS universe, like web servers, relational and nosql dbms, reverse proxies, text databases, etc. Its also a powerful tool to monitor resource usage on said servers. However, its not well fitted to monitor custom services - if you need to generate alerts based on logs or database information, for example
A de minimis incentive was given to thank the reviewer for their time. The incentive was not used to bias or drive a particular response, nor was the incentive contingent on a positive endorsement. TR verified that a representative sample of customers was invited. More Info
Zabbix is great for monitoring your servers and seeing alerts when the system uses too much CPU or memory. This allowed the system Engineer to be proactive and add resources to these systems to avoid interrupting the services. Especially servers running operations applications and services. This is one of the best usages for Zabbix.
A de minimis incentive was given to thank the reviewer for their time. The incentive was not used to bias or drive a particular response, nor was the incentive contingent on a positive endorsement. More Info
It provides lot many out of the box dashboard to observe the health and usage of your cloud deployments. Few examples are CPU usage, Disk read/write, Network in/out etc.
It is possible to stream CloudWatch log data to Amazon Elasticsearch to process them almost real time.
If you have setup your code pipeline and wants to see the status, CloudWatch really helps. It can trigger lambda function when certain cloudWatch event happens and lambda can store the data to S3 or Athena which Quicksight can represent.
A de minimis incentive was given to thank the reviewer for their time. The incentive was not used to bias or drive a particular response, nor was the incentive contingent on a positive endorsement. More Info
A de minimis incentive was given to thank the reviewer for their time. The incentive was not used to bias or drive a particular response, nor was the incentive contingent on a positive endorsement. More Info
Collecting hardware data - CPU, Memory, Network, and Disk Metrics are collected and reported on.
Flexible design - It is very easy to build out even very large environments via the templating system. You can also start where you are - network monitoring, server monitoring, etc. and then build it out from there as time and resources permit.
Provides a "plugin architecture" (via XML templates) to allow end users to extend it to monitor all kinds of equipment, software, or other metrics that are not already added into the software already.
Very complete documentation. Almost every aspect of Zabbix has been documented and reported on.
Cost - Zabbix is FOSS software and always free. Support is reasonably priced and readily available.
A de minimis incentive was given to thank the reviewer for their time. The incentive was not used to bias or drive a particular response, nor was the incentive contingent on a positive endorsement. More Info
Memory metrics on EC2 are not available on CloudWatch. Depending on workloads if we need visibility on memory metrics we use Solarwinds Orion with the agent installed. For scalable workloads, this involves customization of images being used.
Visualization out of the box. But this can easily be addressed with other solutions such as Grafana.
By design, this is only used for AWS workloads so depending on your environment cannot be used as an all in one solution for your monitoring.
A de minimis incentive was given to thank the reviewer for their time. The incentive was not used to bias or drive a particular response, nor was the incentive contingent on a positive endorsement. More Info
And while powerful, building tailored dashboards with organ-specific metrics (such as energy load variance across regions) can be difficult to navigate. The UI isn't as drag-and-drop easy, and query-based widgets typically involve some trial and error for non-devs.
Alerts may be hypersensitive or over general. I We often get a spam of non-critical alerts while doing load testing, all overhauling to me alone and making it difficult to identify actual issues especially in energy systems where spikes are very common.
With our expanding fleet of Iot devices, the per-host pricing model is becoming expensive, quickly. More detailed billing based on microservices, or that works at sensor level, would make it more adaptable for energy platforms.
A de minimis incentive was given to thank the reviewer for their time. The incentive was not used to bias or drive a particular response, nor was the incentive contingent on a positive endorsement. More Info
A de minimis incentive was given to thank the reviewer for their time. The incentive was not used to bias or drive a particular response, nor was the incentive contingent on a positive endorsement. More Info
The only issue that we have had with New Relic is that the price might be a little expensive for smaller companies. The amount of data you store in New Relic impacts the cost, and can get away from you if you don't work closely with the vendor. Overall though the application is top notch.
A de minimis incentive was given to thank the reviewer for their time. The incentive was not used to bias or drive a particular response, nor was the incentive contingent on a positive endorsement. TR verified that a representative sample of customers was invited. More Info
It is free. It didn't cost anything to implement (other than my time and the cost incurred for it) and it is filling a badly needed gap in our IT infrastructure. Support is available if we have issues and can be done annually or paid for on a per incident basis as needed. Expansion, updates, and all other future lifecycle activities are likewise free of cost, so as long as someone is able to implement/maintain the software (and the OSS project is maintained) then I imagine the company will never leave it.
A de minimis incentive was given to thank the reviewer for their time. The incentive was not used to bias or drive a particular response, nor was the incentive contingent on a positive endorsement. More Info
It's excellent at collecting logs. It's easy to set up. The viewing & querying part could be much better, though. The query syntax takes some time to get used to, & the examples are not helpful. Also, while being great, Log Insights requires manual picking of log streams to query across every time.
A de minimis incentive was given to thank the reviewer for their time. The incentive was not used to bias or drive a particular response, nor was the incentive contingent on a positive endorsement. More Info
I have given this much rating as I am used New Relic in different sectors and for different use cases like its K8s monitoring, infra monitoring, full stack monitoring as compare to other tools New Relic gives data in a formatted and connected way, and also it is giving us value for money. It also launches new features day by day which helps users to track the issue very quickly. It also supports OTel integrations which is the latest trend of observability tools. thats why I had given this much rating to New Relic.
A de minimis incentive was given to thank the reviewer for their time. The incentive was not used to bias or drive a particular response, nor was the incentive contingent on a positive endorsement. More Info
I think every organization, especially the IT department, needs a tool like this. I know of another product like Zabbix that gives a similar or the same solution, but its range makes it very useful. You can see almost all the device info in one place: disk usage, disk space, network usage, etc.
A de minimis incentive was given to thank the reviewer for their time. The incentive was not used to bias or drive a particular response, nor was the incentive contingent on a positive endorsement. More Info
A de minimis incentive was given to thank the reviewer for their time. The incentive was not used to bias or drive a particular response, nor was the incentive contingent on a positive endorsement. More Info
A de minimis incentive was given to thank the reviewer for their time. The incentive was not used to bias or drive a particular response, nor was the incentive contingent on a positive endorsement. More Info
Support is effective, and we were able to get any problems that we couldn't get solved through community discussion forums solved for us by the AWS support team. For example, we were assisted in one instance where we were not sure about the best metrics to use in order to optimize an auto-scaling group on EC2. The support team was able to look at our metrics and give a useful recommendation on which metrics to use.
A de minimis incentive was given to thank the reviewer for their time. The incentive was not used to bias or drive a particular response, nor was the incentive contingent on a positive endorsement. More Info
The support team has been really helpful and resolved most of the issues on time. However, for a couple of issues, several follow-ups were needed to elicit a reasonable response. The issue was deeply technical and could have been investigated only by their Architects, and bringing them into the ticket took longer than needed
A de minimis incentive was given to thank the reviewer for their time. The incentive was not used to bias or drive a particular response, nor was the incentive contingent on a positive endorsement. TR verified that a representative sample of customers was invited. More Info
The setup is the most time-consuming portion of using zabbix. It takes a lot of effort to shape it into a usable format and even then it can get very messy. It's not exactly intuitive and as mentioned the UI seems a bit antiquated. If I was to roll out a monitoring solution from scratch, I'd probably look for alternatives which are easier to use and maintain.
A de minimis incentive was given to thank the reviewer for their time. The incentive was not used to bias or drive a particular response, nor was the incentive contingent on a positive endorsement. More Info
It's better to start by implementing New Relic in one project and test everything. Try to follow best recommended practices and read all the official documentation. Everything seems well tested. Then, start by installing agents to the rest of your projects and keep a close look to all logs and metrics New Relic gives you.
We are a mainly Windows environment, so it would be useful if we could have used Active Directory to deploy agents. As of version 4.2, Zabbix has announced a new agent MSI file to allow exactly that. Unfortunately, we didn't have that option. Also, for Linux and MAC deployments, there is no simple way to deploy that. Using remote scripts you may be able to create something, but most places will opt for either SNMP (agentless) or manual installation of agents to add to Zabbix. A way of deploying agents via discovery would go a long way to helping in the adoption of the tool.
A de minimis incentive was given to thank the reviewer for their time. The incentive was not used to bias or drive a particular response, nor was the incentive contingent on a positive endorsement. More Info
Grafana is definitely a lot better and flexible in comparison with Amazon CloudWatch for visualisation, as it offers much more options and is versatile. VictoriaMetrics and Prometheus are time-series databases which can do almost everything cloudwatch can do in a better and cheaper way. Integrating Grafana with them will make it more capable Elasticsearch for log retention and querying will surpass cloudwatch log monitoring in both performance and speed
A de minimis incentive was given to thank the reviewer for their time. The incentive was not used to bias or drive a particular response, nor was the incentive contingent on a positive endorsement. More Info
Data Dog has solutions that look more attractive, but not at their price point. We have also tried to build a solution straight from the Cloud, where our business is built, but some things are too hard to replicate. This shows that New Relic is useful and helps our efficiency.
A de minimis incentive was given to thank the reviewer for their time. The incentive was not used to bias or drive a particular response, nor was the incentive contingent on a positive endorsement. TR verified that a representative sample of customers was invited. More Info
We're using the Solarwinds suite as our global monitoring standard, but it is very complex and its licensing model makes it difficult to monitor a wide range of technologies. So, we're using Zabbix as a complement on our monitoring process. Zabbix is a way more flexible and has free integrations to a wide range of technologies. It is also more 'user friendly' and easy to manage.
A de minimis incentive was given to thank the reviewer for their time. The incentive was not used to bias or drive a particular response, nor was the incentive contingent on a positive endorsement. More Info
A de minimis incentive was given to thank the reviewer for their time. The incentive was not used to bias or drive a particular response, nor was the incentive contingent on a positive endorsement. More Info
A de minimis incentive was given to thank the reviewer for their time. The incentive was not used to bias or drive a particular response, nor was the incentive contingent on a positive endorsement. More Info
A de minimis incentive was given to thank the reviewer for their time. The incentive was not used to bias or drive a particular response, nor was the incentive contingent on a positive endorsement. More Info