
T. Blane McMichen
President
Chose Google Analytics
Campaign tracking requires more set-up in Webtrends, and the additional cost is hard to justify.
| Product | Rating | Most Used By | Product Summary | Starting Price |
|---|---|---|---|---|
 Google Analytics | N/A | Google Analytics is perhaps the best-known web analytics product and, as a free product, it has massive adoption. Although it lacks some enterprise-level features compared to its competitors in the space, the launch of the paid Google Analytics Premium edition seems likely to close the gap. | $0 per month | |
 Tableau Desktop | N/A | Tableau Desktop is a data visualization product from Tableau. It connects to a variety of data sources for combining disparate data sources without coding. It provides tools for discovering patterns and insights, data calculations, forecasts, and statistical summaries and visual storytelling. | $1,380 per year (purchased via a Creator license) | |
 Webtrends Analytics | N/A | WebTrends provides an enterprise web analytics platform and, according to Forrester, has a strong focus on support for mobile and social channels and a very open platform. Webtrends competes directly with Adobe Site Catalyst, IBM Coremetrics. and comScore DigitalAnalytix. | N/A |
| Google Analytics | Tableau Desktop | Webtrends Analytics | ||||||||||||||||||||||
|---|---|---|---|---|---|---|---|---|---|---|---|---|---|---|---|---|---|---|---|---|---|---|---|---|
| Editions & Modules |
|
| No answers on this topic | |||||||||||||||||||||
| Offerings |
| |||||||||||||||||||||||
| Entry-level Setup Fee | No setup fee | No setup fee | No setup fee | |||||||||||||||||||||
| Additional Details | — | All pricing plans are billed annually. A Creator license includes Tableau Desktop, Tableau Prep Builder, and Tableau Pulse. Discounts sometimes available for volume. | — | |||||||||||||||||||||
| More Pricing Information | ||||||||||||||||||||||||
| Google Analytics | Tableau Desktop | Webtrends Analytics | |
|---|---|---|---|
| Considered Multiple Products |  Google Analytics T. Blane McMichen President Chose Google Analytics Campaign tracking requires more set-up in Webtrends, and the additional cost is hard to justify.  Alex Nejako Marketing Automation Manager Chose Google Analytics  Ellen Moon Senior Manager Chose Google Analytics Google Analytics provides everything you need in terms of straight forward analytics needs. The tool is not very flexible compared to other software such as adobe, and if you want to upgrade to premium or add in a bunch of custom situations, that can be become very [tedious] …  Adam Hatfield Head of Digital Chose Google Analytics We have been using Google Analytics for over 10 years. Over that time we have periodically reviewed our analytics platforms a number of times. For us, it made more sense to stay with google analytics primarily because if we migrated to another platform we would lose the …  Michael Baker Digital Marketing Manager Chose Google Analytics We tested Webtrends and purchased Omniture (which we used for 2 years). Webtrends wasn't a good fit overall. Omniture was too cumbersome and expensive. The support was HORRIBLE and for a paid product it lacked some basic, no-brainer features.  Jennifer (Utterback) Davis Vice President, Emarketing Chose Google Analytics We have used Omniture and WebTrends. WebTrends is an outdated analytics tool. Omniture, while robust is just not as customizable. Basically, if you have no intention or no need to do customization and you just want out-of-the-box reporting and not willing to spend the time in … |  Tableau Desktop  Jasmeet S Babra Marketing Data Analyst Chose Tableau Desktop Excel, Google Analytics, Google Charts  Karol Kozłowski Project manager Chose Tableau Desktop We used to use products from the Google family in parallel. After migrating to GA4, we use Tableau much more.  Andres Meza Ingeniero de Homologación de Terminales Inalámbricos Chose Tableau Desktop Tableau Desktop was selected because it offers all the tools to design presentations of information of the results thrown by the process of execution of an activity, project, programs or plans. This gives staff, managers or clients the possibility of observing in an easy and …  Yusmelys Lopez Analista financiero Chose Tableau Desktop Because Tableau is an Intelligence tool that allows me to analyze, visualize and share large volumes of information in a fast, flexible and friendly way. Complement is very easy to use, generates tangible impacts in the short term. The Organization has been able to create …  sanjeev pandey Software Engineer Chose Tableau Desktop In tableau you can achieve things really quickly and it has the power to show you insight data very easily. Tableau is also economical in comparison to what these tools cost. It's a full value tool.  Andy G Teasdale Analyst - Asset Managment Chose Tableau Desktop Tableau was already widely utilised at the point which I joined the organisation. Depending on how you have your site set up for tracking, Data Studio 360 (GA) is looking like a more effective solution for up to the minute results, and the beta interface has a similar look and …  Stéphane Hamel Renowned digital analytics consultant, innovator, speaker, thought leader Chose Tableau Desktop I haven't used other tools for a number of years - when I made the selection my criteria were ease of use (including, slicing & dicing data at will), connectivity to various data sources (especially REST API - which Tableau doesn't support natively but now has a way to use …  James Martin Measurement Solutions Designer Chose Tableau Desktop Tableau is the most powerful and easy to use of the alternatives, as long as the data sources are properly connected. None of the other tools have allowed us to connect and integrate data into one report in the way that Tableau's data connectivity allows us to. Then the ability … |  Webtrends Analytics  Jaclyn Wallace Campaign Measurement & Reporting Coordinator Chose Webtrends Analytics I find Google Analytics to be very limiting. This may also be the way that the reports have been structured by our organization. It is viewed as an older way to obtain the metrics we are after and no new projects are implemented through Google Analytics.  David Cox Senior Business Intelligence Analyst Chose Webtrends Analytics We currently use WebTrends, Google Analytics, Kissmetrics and ClickTale. I would like us to consolidate our activities to be focused on just Webtrends as it covers all of the requirements we have very well.  Nathan Collins CRM Analyst Chose Webtrends Analytics Using Omniture at my current place of employment and using Google Analytics as a backup at both, Webtrends is the clear superior product. I go back to how easy the UI is to navigate and how simple it is to get user level data that isn't duplicated or doesn't try to pigeon hold …  Mary Kay Scott Web Developer III Chose Webtrends Analytics Compared to WebTrends, Google Analytics has a slicker interface, provides live site usage data, and is easier to jump into with basic usage. These days users expect to be able to create their own reports as needed, rather than have an "expert" do it for them. They are used to …  Matthieu Dejardins Head of Web Analytics & Testing Chose Webtrends Analytics Webtrends was selected because of the price for Google Analytics Premium ($110k per year) and Adobe Omniture Analytics (twice the price). Clearly, it needed the Visitor Data Mart to get additional capability that you would expect as part of a Web Analytics suite. In our case, …  Brian Mackintosh Director of eCommerce Chose Webtrends Analytics I have only had significant experience with Google Analytics (GA) and WebTrends in this space. Overall - it is easier to learn and modify GA reports as a casual user - I always struggled with the fact that GA only offered partial data (sampling based).  Chaim (Daniel) Arnstein Consultant (6+ Years) Sr. Systems Analyst - VP (7 Years) Chose Webtrends Analytics Have not use Webtrends competitors  Kevin Ornduff Marketing Analyst Chose Webtrends Analytics Webtrends is just an option, depending on client budget. It's a simple analytics tool that does the job but we always recommend Omniture whenever possible.  Adam Krause Manager of Web Analytics Chose Webtrends Analytics We evaluated Google Analytics, but we picked Webtrends as it offered better value for the price. |
| Google Analytics | Tableau Desktop | Webtrends Analytics | |||||||||||||||||||||||||||||||||||
|---|---|---|---|---|---|---|---|---|---|---|---|---|---|---|---|---|---|---|---|---|---|---|---|---|---|---|---|---|---|---|---|---|---|---|---|---|---|
| Web Analytics |
| ||||||||||||||||||||||||||||||||||||
| BI Standard Reporting |
| ||||||||||||||||||||||||||||||||||||
| Ad-hoc Reporting |
| ||||||||||||||||||||||||||||||||||||
| Report Output and Scheduling |
| ||||||||||||||||||||||||||||||||||||
| Data Discovery and Visualization |
| ||||||||||||||||||||||||||||||||||||
| Access Control and Security |
| ||||||||||||||||||||||||||||||||||||
| Mobile Capabilities |
| ||||||||||||||||||||||||||||||||||||
| Application Program Interfaces (APIs) / Embedding |
|
| Google Analytics | Tableau Desktop | Webtrends Analytics | |
|---|---|---|---|
| Small Businesses |  StatCounter Score 9.0 out of 10 |  Yellowfin Score 8.7 out of 10 | StatCounter Score 9.0 out of 10 |
| Medium-sized Companies |  Siteimprove Score 9.0 out of 10 |  Reveal Score 10.0 out of 10 | Siteimprove Score 9.0 out of 10 |
| Enterprises |  Optimal Score 9.1 out of 10 |  Kyvos Semantic Layer Score 9.5 out of 10 | Optimal Score 9.1 out of 10 |
| All Alternatives | View all alternatives | View all alternatives | View all alternatives |
| Google Analytics | Tableau Desktop | Webtrends Analytics | |
|---|---|---|---|
| Likelihood to Recommend | 8.5 (192 ratings) | 8.8 (203 ratings) | 7.1 (30 ratings) |
| Likelihood to Renew | 9.0 (51 ratings) | 7.5 (41 ratings) | 5.4 (25 ratings) |
| Usability | 7.4 (19 ratings) | 8.3 (73 ratings) | 5.4 (7 ratings) |
| Availability | 10.0 (4 ratings) | 10.0 (11 ratings) | 9.0 (4 ratings) |
| Performance | 10.0 (2 ratings) | 8.0 (10 ratings) | 8.2 (3 ratings) |
| Support Rating | 7.0 (42 ratings) | 1.0 (57 ratings) | 8.8 (8 ratings) |
| In-Person Training | - (0 ratings) | 9.4 (4 ratings) | 9.7 (3 ratings) |
| Online Training | 10.0 (2 ratings) | 8.0 (5 ratings) | 9.0 (4 ratings) |
| Implementation Rating | 9.0 (7 ratings) | 8.0 (34 ratings) | 9.9 (5 ratings) |
| Configurability | 6.0 (2 ratings) | 7.0 (3 ratings) | 7.1 (2 ratings) |
| Ease of integration | 10.0 (1 ratings) | 10.0 (1 ratings) | - (0 ratings) |
| Product Scalability | 10.0 (2 ratings) | 9.0 (4 ratings) | - (0 ratings) |
| Vendor post-sale | 10.0 (1 ratings) | 10.0 (1 ratings) | 9.0 (1 ratings) |
| Vendor pre-sale | 9.0 (1 ratings) | 10.0 (1 ratings) | 9.0 (1 ratings) |
| Google Analytics | Tableau Desktop | Webtrends Analytics | |
|---|---|---|---|
| Likelihood to Recommend | Google
 sandro merkvilishvili Head of e-commerce deparment | Tableau
Karol Kozłowski Project manager | Webtrends
Chaim (Daniel) Arnstein Consultant (6+ Years) Sr. Systems Analyst - VP (7 Years) |
| Pros | Google
| Tableau
 Afia Tamanna Information Technology Business Consultant | Webtrends
 Mitchell Teixeira Consultant |
| Cons | Google
| Tableau
| Webtrends
 Chris Grant Associate Director of Analytics |
| Likelihood to Renew | Google
| Tableau
| Webtrends
|
| Usability | Google
 Victor Campos Web Developer | Tableau
 Al Mubassir Muin Software Engineer | Webtrends
|
| Reliability and Availability | Google
| Tableau
 Brad Llewellyn Associate Data Analytics Consultant | Webtrends
|
| Performance | Google
| Tableau
| Webtrends
Adam Krause Manager of Web Analytics |
| Support Rating | Google
 Sarah Hoffman Media Director | Tableau
| Webtrends
 Matthew Koppel Analytics and Insights Supervisor |
| In-Person Training | Google No answers on this topic | Tableau
 Jon Boeckenstedt Associate Vice President | Webtrends
Adam Krause Manager of Web Analytics |
| Online Training | Google
 Roy Morejon President | Tableau
| Webtrends
Adam Krause Manager of Web Analytics |
| Implementation Rating | Google
 Joshua Van Horsen Marketing Manager | Tableau
 David Fickes Decision Sciences - Modeling, Simulation & Analysis | Webtrends
Mitchell Teixeira Consultant |
| Alternatives Considered | Google
| Tableau
| Webtrends
|
| Scalability | Google
| Tableau
| Webtrends No answers on this topic |
| Return on Investment | Google
 Heide Rembold Director of Marketing & Analytics | Tableau
| Webtrends
 Lindsay Buescher Senior Manager, Analytics |
| ScreenShots | Webtrends Analytics Screenshots  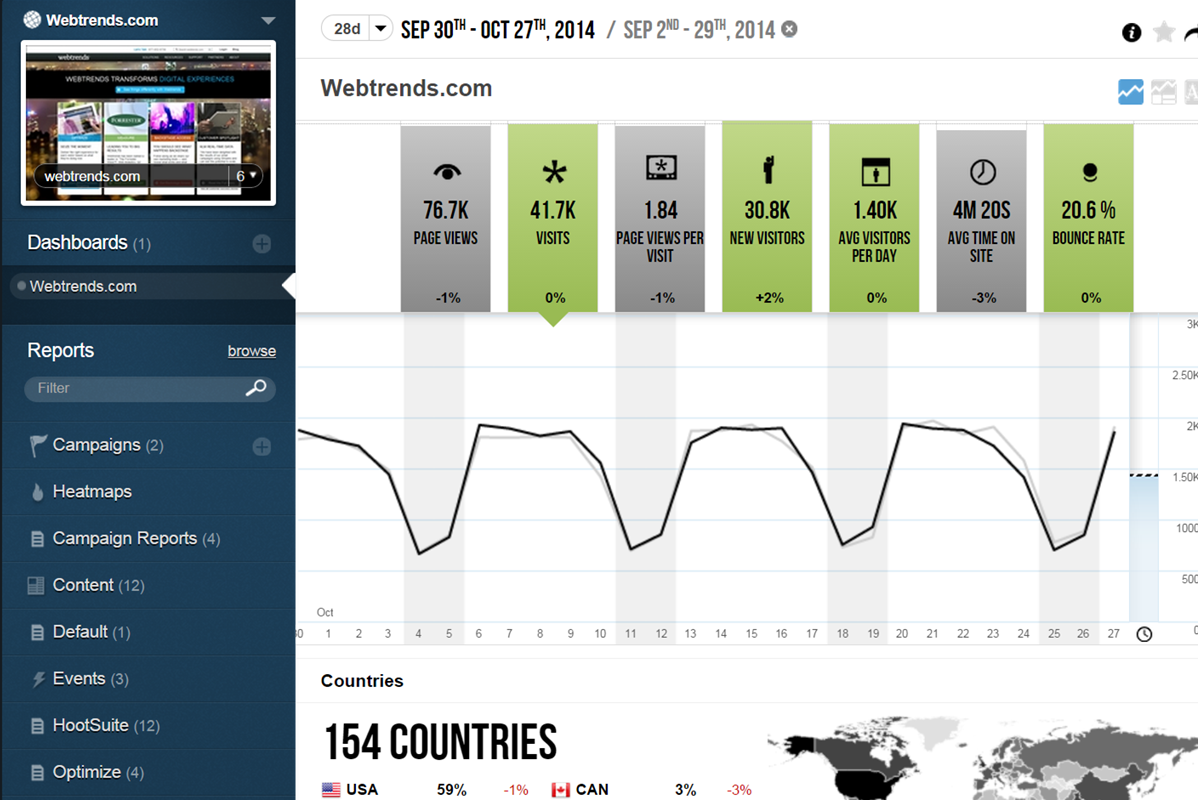 |