Kibana vs. Lightning Tools Data Viewer

Overview
ProductRatingMost Used ByProduct SummaryStarting Price
Kibana
Score 8.1 out of 10
N/A
Kibana allows users to visualize Elasticsearch data and navigate the Elastic Stack so you can do anything from tracking query load to understanding the way requests flow through your apps.N/A
Lightning Tools Data Viewer
Score 9.1 out of 10
Mid-Size Companies (51-1,000 employees)
The Data Viewer provides data visualization in the form of reports or charts that can be created and customized to suit a business's needs. Silos of data exist in most organizations and yet contain valuable insights into how well the organization is performing and where action is needed. Those silos often include Microsoft Excel workbooks, Microsoft SQL Azure databases, On-Premises data sources accessible through OData or Business Connectivity Services and even SharePoint Lists. These data…
$1,250
per year per installation
Pricing
KibanaLightning Tools Data Viewer
Editions & Modules
No answers on this topic
Data Viewer OnPrem
$1,000
per year Per installation, 1 x WFE
Data Viewer Online
$1,250
per year per installation
Data Viewer OnPrem Enterprise Edition
POA
per year Per installation, 4+ WFE
Data Viewer Online Enterprise Edition
POA
per year per installation
Offerings
Pricing Offerings
KibanaLightning Tools Data Viewer
Free Trial
NoYes
Free/Freemium Version
NoNo
Premium Consulting/Integration Services
NoNo
Entry-level Setup FeeNo setup feeNo setup fee
Additional Details—Prices stated are minimum per installation for "stock" products. Enterprise editions can be amended to suit business needs if deemed necessary, additional costs incurred and TBD. All packages include free technical support. Free upgrades available to latest versions of tool as they are released. (online version)
More Pricing Information
Community Pulse
KibanaLightning Tools Data Viewer
Top Pros

No answers on this topic

Top Cons

No answers on this topic

Features
KibanaLightning Tools Data Viewer
BI Standard Reporting
Comparison of BI Standard Reporting features of Product A and Product B
Kibana
9.0
5 Ratings
7% above category average
Lightning Tools Data Viewer
9.1
1 Ratings
8% above category average
Pixel Perfect reports9.02 Ratings00 Ratings
Customizable dashboards9.05 Ratings9.11 Ratings
Report Formatting Templates9.03 Ratings9.11 Ratings
Ad-hoc Reporting
Comparison of Ad-hoc Reporting features of Product A and Product B
Kibana
5.7
5 Ratings
34% below category average
Lightning Tools Data Viewer
8.2
1 Ratings
2% above category average
Drill-down analysis7.05 Ratings6.41 Ratings
Formatting capabilities7.04 Ratings9.11 Ratings
Report sharing and collaboration3.04 Ratings9.11 Ratings
Report Output and Scheduling
Comparison of Report Output and Scheduling features of Product A and Product B
Kibana
8.8
2 Ratings
5% above category average
Lightning Tools Data Viewer
-
Ratings
Publish to Web9.52 Ratings00 Ratings
Publish to PDF8.52 Ratings00 Ratings
Report Versioning9.01 Ratings00 Ratings
Report Delivery Scheduling9.01 Ratings00 Ratings
Delivery to Remote Servers8.01 Ratings00 Ratings
Data Discovery and Visualization
Comparison of Data Discovery and Visualization features of Product A and Product B
Kibana
8.8
4 Ratings
7% above category average
Lightning Tools Data Viewer
3.6
1 Ratings
78% below category average
Pre-built visualization formats (heatmaps, scatter plots etc.)7.04 Ratings3.61 Ratings
Location Analytics / Geographic Visualization9.52 Ratings00 Ratings
Predictive Analytics10.01 Ratings00 Ratings
Best Alternatives
KibanaLightning Tools Data Viewer
Small Businesses
IBM SPSS Modeler
IBM SPSS Modeler
Score 7.8 out of 10
IBM SPSS Modeler
IBM SPSS Modeler
Score 7.8 out of 10
Medium-sized Companies
Mathematica
Mathematica
Score 8.2 out of 10
Mathematica
Mathematica
Score 8.2 out of 10
Enterprises
IBM SPSS Modeler
IBM SPSS Modeler
Score 7.8 out of 10
IBM SPSS Modeler
IBM SPSS Modeler
Score 7.8 out of 10
All AlternativesView all alternativesView all alternatives
User Ratings
KibanaLightning Tools Data Viewer
Likelihood to Recommend
7.0
(5 ratings)
9.1
(1 ratings)
Support Rating
7.7
(2 ratings)
-
(0 ratings)
User Testimonials
KibanaLightning Tools Data Viewer
Likelihood to Recommend
Elastic
Kibana integrates seamlessly with Elastic Search which gives us access to parse and analyze data generated from our systems in order to make decisions. Also, Kibana helps us create insightful reports and dashboards that give us insights into the end-users usage on the system and helps us find the root cause of issues as well.
Read full review
Lightning Tools
Lightning Tools Data Viewer is well suited for re-surfacing data and customizing its look and feel.
Read full review
Pros
Elastic
  • Fast searches with powerful index.
  • Beautiful data visualizations.
  • Real-time observability.
Read full review
Lightning Tools
  • Shows Lists created on different sites to be seen and controlled on another site in a Tenant
  • Allows selection of layouts and coloring way beyond what other programs do.
  • Easy to learn and very functional.
Read full review
Cons
Elastic
  • Some performance issues with large datasets.
  • Linking to dashboards makes extremely long urls.
  • Lack of reports.
Read full review
Lightning Tools
  • Data Viewer has a graph feature that is old school flat design. We loved the In House real 3D graph Lightning Tools program.
Read full review
Support Rating
Elastic
We did not use the official Kibana support. Documentation was easy enough to follow.
Read full review
Lightning Tools
No answers on this topic
Alternatives Considered
Elastic
Kibana has a better usability experience, the core features I was using existed in all of them. I liked more in Kibana how you can easily create dashboards, charts, and reports without the need to be a tech person.
Read full review
Lightning Tools
Lightning Tools Data Viewer is much easier and more powerful than Infowise similar viewer in their lineup. In this case, we use Data Viewer over the one offered by Infowise.
Read full review
Return on Investment
Elastic
  • Issues that affect checkout experiences for customers are able to be prioritized and solved quickly.
  • We are able to more efficiently use resources due to the automation of reporting alerts. Decreasing employee resources needed.
  • Visualization allows us to quickly share issues and explain to coworkers in order to escalate issues that can cost our bottom line.
Read full review
Lightning Tools
  • It allows us to do things that would take a great deal more time to duplicate in SharePoint
  • It cuts down on ugly looking built in SP list layouts
  • Users find it easy to access, thus this product is more productive
Read full review
ScreenShots

Lightning Tools Data Viewer Screenshots
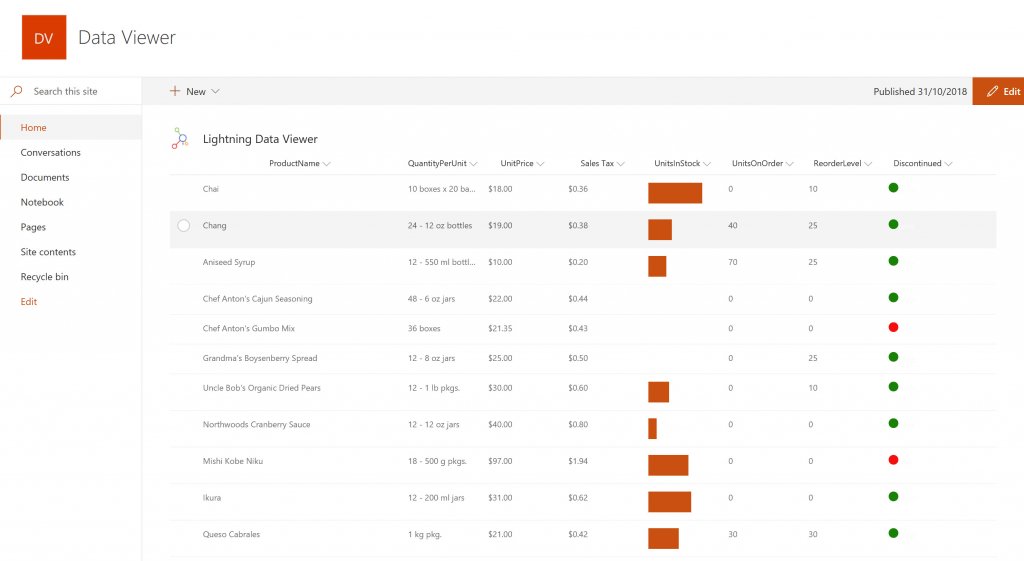
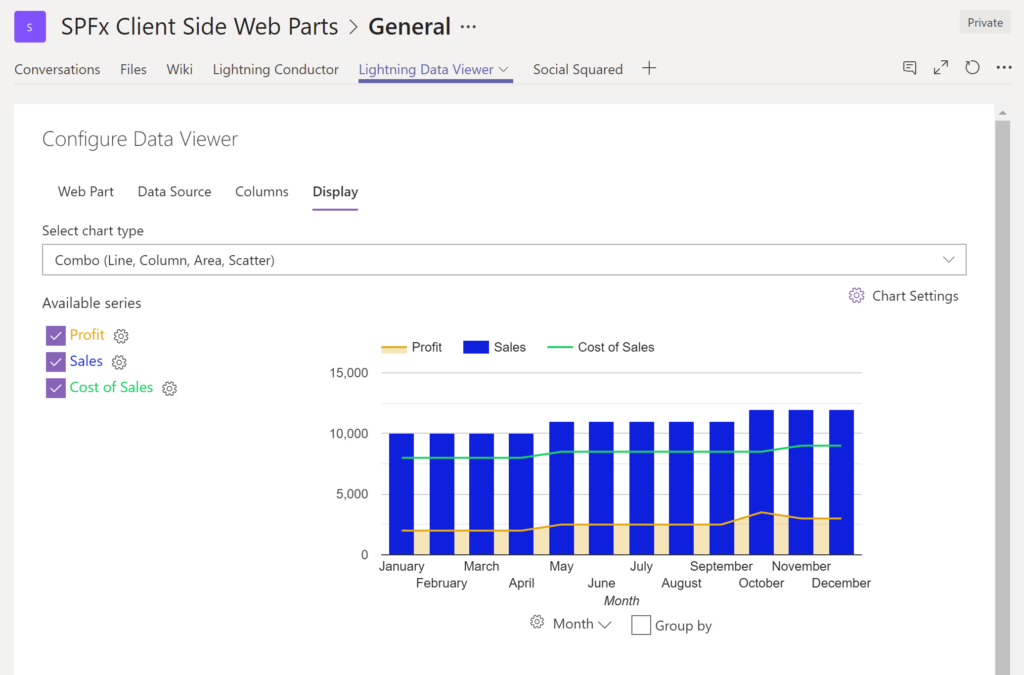
Screenshot of DISPLAYING EXTERNAL DATA WITHIN SHAREPOINT OR MICROSOFT TEAMS
The Data Viewer Client Side Web Part can be configured by Business Users within a few minutes to display Line of Business Data from Data Sources such as Excel,  SQL Azure, Business Connectivity Services, OData and SharePoint Lists.  Connections to an organizations data such as Customer Relationship Management Systems, Accounting Systems, or Custom Databases can be connected, giving business users a live up-to-date view of business information within the context of their SharePoint Team Sites or Microsoft Teams Tabs.Screenshot of HIGHLIGHTING KEY BUSINESS DATA (NO CODE)
Conditional formatting can be used to highlight key business data. Overdue Tasks, Low Stock, Currency Exchange Rates, Sales Revenue are examples of data to highlight visually allowing for a quick reaction time. Key Financial Indicators and Key Performance Indicators can be configured with a simple dialog and no need to write any code. Choose colours, icons or data bars to highlight key data.Screenshot of SELECTING AND STYLING ICONS
Icons can be chosen as part of the conditional formatting to make data stand out. The Office 365 Fabric icons can be selected and styled and applied to cell values. Pepper pots, Smileys, Envelopes and more icons are available. There are hundreds of options to choose from to highlight data that needs to be acted upon.Screenshot of DATA VIEWER CAN BE A GRID OF DATA OR A CHART IN SHAREPOINT OR MICROSOFT TEAMS
The Data Viewer can be used within Microsoft SharePoint Modern Sites or Microsoft Teams Tabs as a Grid of Data with styling or as a Chart which can be configured. The Charting Feature allows for Pie, Donut, Column, Line, Area, and Scatter Charts which can all be configured and displayed in 2D or 3D.Screenshot of TREEMAPS
summary information can be displayed within a TreeMap next to the detail. Users will be able to see trends, and how the business is performing  using the TreeMap view of data.Screenshot of CHARTS AND GAUGES
The Data Viewer is used to represent data in multiple ways using Gauges, TreeMaps, Multiple Series Charts, and Pie Charts.