Auvik Network Management is a vendor-agnostic cloud-based network monitoring and management solution providing automated network discovery. Auvik requires no service hardware or disruptive maintenance cycles and provides onboarding and training for new and existing users. Auvik delivers visibility and automation to reduce friction for IT teams and allow them to give end users the freedom to work wherever and however they…
N/A
SolarWinds Loggly
Score 7.3 out of 10
Mid-Size Companies (51-1,000 employees)
Loggly is a cloud-based log management service provider. It does not require the use of proprietary software agents to collect log data. The service uses open source technologies, including ElasticSearch, Apache Lucene 4 and Apache Kafka.
$79
per month/billed annually
LogicMonitor
Score 9.0 out of 10
Mid-Size Companies (51-1,000 employees)
LogicMonitor’s SaaS-based platform, LM Envision, enables observability across on-prem and multi-cloud environments. It provides IT and business teams operational visibility and predictability across their technologies and applications.
N/A
Pricing
Auvik
SolarWinds Loggly
LogicMonitor
Editions & Modules
No answers on this topic
Standard
$79
per month/billed annually
Pro
$159
per month/billed annually
Enterprise
$279
per month/billed annually
Enterprise
Contact sales team
Website Monitoring
Contact sales team
Offerings
Pricing Offerings
Auvik
SolarWinds Loggly
LogicMonitor
Free Trial
Yes
Yes
Yes
Free/Freemium Version
No
Yes
No
Premium Consulting/Integration Services
No
Yes
Yes
Entry-level Setup Fee
No setup fee
No setup fee
No setup fee
Additional Details
Pricing is calculated per number of switches, routers, firewalls, and controllers. Everything else is monitored for free.
Free trial for Standard and Pro plans for 14 days with all features.
Our platform is broken down into Pro and Enterprise Pricing. Pro includes monitoring for all of your cloud, hybrid, and on-premises infrastructure. Our Enterprise package includes all of this, plus our AIOps and Machine Learning functionality that provides dynamic thresholds, root cause analysis, anomaly detection and more!
LogicMonitor only charges by the device. What is considered a device? A device is anything with an IP address that you want to monitor, including a physical device or a cloud resource. This means multiple data sources under the same IP address can be monitored for the same price. Unlike some monitoring platforms. we don’t charge per node, interface, or metric.
Actually, we went from Auvik to LogicMonitor, Auvik is like playing with Tinker Toys compared to LogicMonitor. We moved from Auvik to LogicMonitor for a bunch of reasons, pricing was among them. Auvik charges extra for Netflow monitoring where LogicMonitor has is included. If …
Auvik was was simpler to configure and utilize. Less noise, less configuration, and more user-friendly. We moved from LogicMonitor due to be being overkill for us and too much time commitment to get things online and functional. Auvik network scanning and automatic discovery …
Auvik has a been recommended by other companies we have relation with and we started using it as the test. However we are using it more than we ever thought!
We currently use both Passler PRTG and Logic Monitor, we were looking for something to replace PRTG with and thought that we found the correct tool in Auvik. We quickly realized that Auvik was very easy to stand up, but once up it would take an army of engineers to configure …
We used LogicMonitor and ended up switching to Auvik for a variety of price, performance, and integration reasons. LogicMonitor did not suit us as an MSP.
Auvik and LogicMonitor are very different, but certainly competitors. Both solutions provide alerting. Auvik focuses on network equipment (firewalls, switches, etc), whereas LogicMonitor is more a jack of all trades alerting platform including servers, VMware, and websites.
Auvik was much more simple to use, and the graphical representation of the network topology was very useful for networking. LogicMonitor definitely has the upper hand in the amount of information you can manage, however.
Auvik did not provide historical data and could not monitor as many device types as LM. We found the Auvik collector to be more "buggy" and have had less issues with LM. We do feel that Auvik had a better network topology map and would clearly show device relationship. That is …
SolarWinds had the big breach just as we left it. We loved how powerful it was, and how customizable - however, it is an ON-Prem tool, and as a growing MSP, that dynamic didn't and couldn't scale. We then moved to Auvik, which had the cleanest GUI and some neat features. That …
SaaS monitoring makes so much sense. Why run your monitoring inside the same environment you're trying to monitor, and how do you monitor your on prem monitoring if there's an outage affecting your own infrastructure? Whilst LogicMonitor isn't a specific point solution so …
Verified User
Director
Chose LogicMonitor
Our initial business requirements in 2016 were to monitor Vblock and FlexPod deployments. We had specific gaps with particular storage appliances the monitoring tool we used at that time could not monitor effectively. When evaluating the mentioned solutions, LogicMonitor was …
Again, I really want to say how much I like the customization options with LogicMonitor when compared to previous solutions I've worked with. Also want to call out the fact that the deployment and configuration in new managed environments take less of our team's time to …
Auvik is well suited for managed service customers and small-scale SMB customers who do not have enough technical resource to manage and monitor their network. Also for customer who has distributed networks spreaded across worldwide or nation wide, Auvik is well suited since it does not need any on-premise setup at each site except for a collector. For customer who has already adopted and used cloud network and hosting services, Auvik is better as Auvik is also fully cloud based offering
SolarWinds Loggly is great for capturing and organizing logs from 3rd party sources such as NGINX. Without SolarWinds Loggly it's really difficult to manage the logs overtime, find traffic patterns, and identify issues before they become a problem. Anyone who is routinely searching through massive log files could quickly benefit from the SolarWinds Loggly and it's capabilities.
The example I will give will explain my rating for it. One employee left our company due to a personal issue, and at that time, our team was working on a highly secure project. He wanted to take revenge on our company, so he began hacking our systems from the outside. Since it appears that someone without authorization is attempting to access our systems, LogicMonitor simultaneously alerted our team to the problem. We stopped that threat with LogicMonitor.
Auvik is the big pic tool of choice for network diagramming, helps layout of our network infrastructure, and we'll know immediately the status of the devices that are successfully communicating, and those that may have, for example, credentials issues.
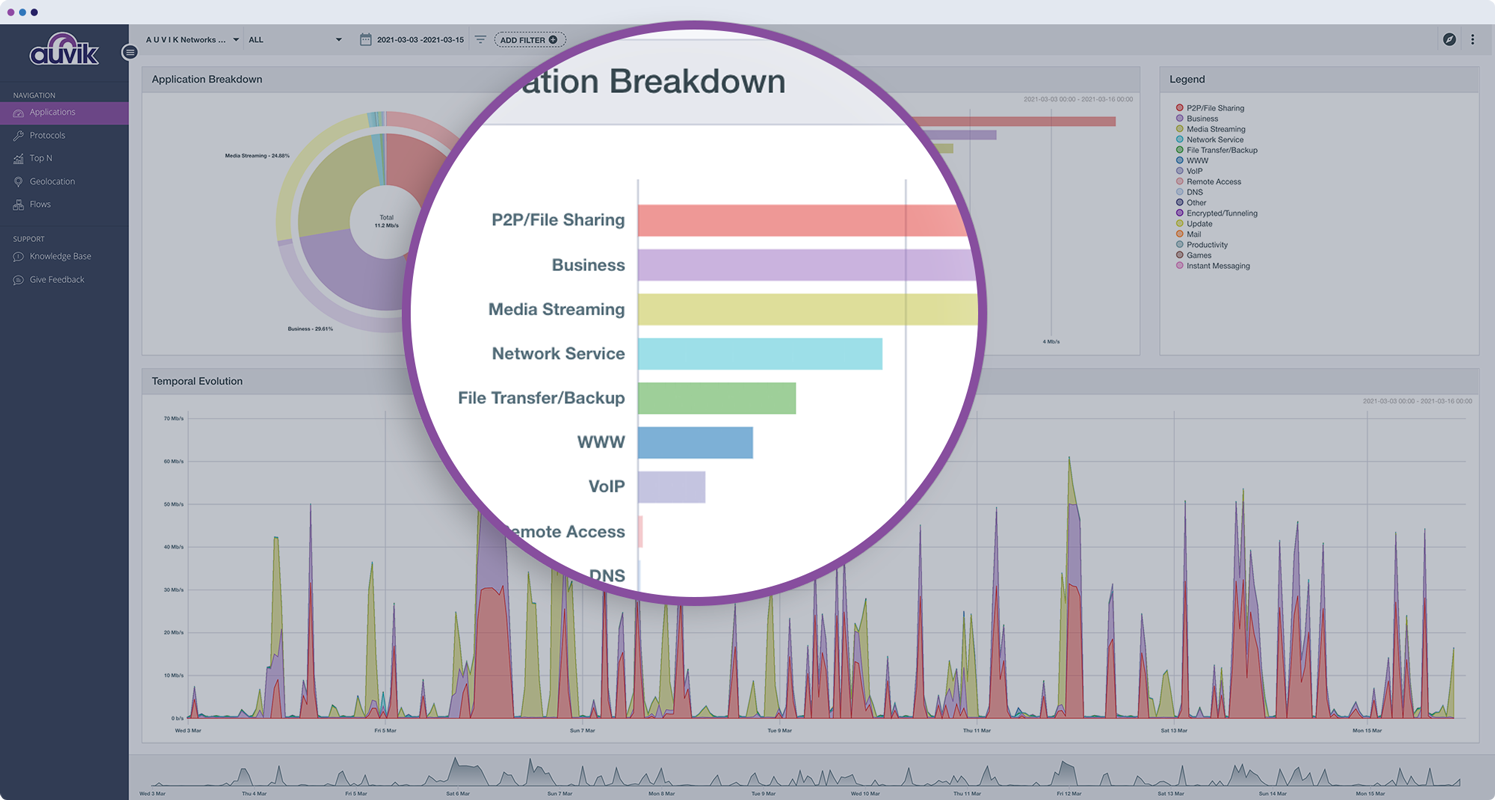
Auvik's "Traffic Insights" are key accelerators for intuitively isolating and resolving traffic-related issues quickly and easily, and the historical information makes it simpler to deduce what aspects may need replacement, capacity improvement, or possibly even re-architecture.
Auvik integration tools are excellent solution enhancers - that are of particular interest to our company, as we make use of MS Teams and Connectwise products; we would like to see some features to integrate to ServiceNow as well.
Putting our logs in one place and making them searchable. We use AWS, and CloudWatch has always been a little frustrating in this regard (though it has gotten better recently).
Deriving metrics from our logs. I think log-based metrics is such a good idea because your logs are the ultimate source for truth in regards to what the hell is going on inside your app. I have really loved the simplicity with which I can just count certain statements and call that a metric because just through the normal course of development certain log statements just naturally become a straightforward recording of an event having occurred.
Alerts. I actually have a few complaints about email alerts, but just the way I was able to set them up so easily has been huge. Since we started using Loggly, there have been at least 3 bugs that Loggly exposed that were frankly very bad. And withoutt Loggly or without a user reporting them, we would have never known they were happening! This is stuff I tried to set up in CloudWatch in various ways, but because of my own ignorance or perhaps the complexity/limitations of CloudWatch (or the complexity of my stack?), I wasn't getting the information that I needed until I was able to just tell Loggly to send me an email whenever the word "error" showed up.
We have to use a log aggregating device to ship our logs to Loggly as our network devices can not connect on an encrypted protocol. I would prefer if we could use some sort of VPN-based connector to ship logs securely.
Sometimes when drilled down, it can be difficult to fully reset a search term to back all the way out of a drill down.
This product has met virtually all of our needs. It was easy to implement and has been simple to support. Customization has been intuitive with many options available. They keep adding features and expanding available options. The future of LogicMonitor looks even better than it is today which is very promising. The management and support teams at LogicMonitor are always helpful
The program can be a bit unwieldy at times, however the majority of information is displayed in a readable and friendly way. The maps and popup information box from the bottom can be harder to use on a smaller screen but on a 1080p+ display tends to work fine.
Loggly's easy setup, very good customer support, and intuitive interface make Loggly very easy to use. User access management is also very easy as we can tailor the experience for each of our developers to access the information they need without having to wade through other information. While there was a slight learning curve in how to view the logs the way some specifically wanted, everything was possible and quite easy to do.
Set up is super easy. Just stand up a small Linux or Windows server to act as a collector. There are no agents to install on monitored devices and all you need is SNMP or WMI access. When creating dashboards, all you have to do is find the widget on the device you want to show up and choose the menu option to add it.
The support team have been great when we have logged tickets or had issues, most of the time it is down to user training, however we have had a couple of bugs that they have been able to iron out for us.
The sales team support we received was top notch. They worked hand in hand to make sure the product met all expectations. So far we have not really had to work with support that much; we have worked with setup team after purchase to deploy product fully. No issues so far and we are four weeks in.
I did not truly dedicate myself to implementing LogicMonitor. However, I overheard the IT team members explain that "LogicMonitor is perfect for us as it has made most of the work automated, and implementation and training sessions were perfect for us." Thus, I can state that everything went smoothly with our implementation.
Auvik can stand up against any of the big network management and monitoring solutions on the market. I've implemented and used SolarWinds at many organizations for over 15 years. The paradigm that SolarWinds, PRTG, Prime, etc., work under is completely different than Auvik. It's apparent that Auvik was aiming to solve a different problem and built that solution from the ground up. For any organization responsible for multiple other organizations' infrastructure, Auvik is invaluable in comparison to the other products listed.
We were using Zabbix. While it is an open-source solution that you can install for free the following things were limitations of the solution. 1) The scale and uptime of the solution are now your own problem. Since we were hosting at AWS this meant we still had a cost of the AWS solution. 2) The product is complicated from a configuration standpoint. In order to get anything meaningful out of it, you had to invest a lot of time and effort. We did consider NewRelic. I have experience with that product and do think that it is a solid alternative. Ultimately experience with the simplicity and speed of deployment with Loggly encouraged me to suggest using this again.
Basically, we did not have any idea about it and how to choose, but we asked one of our former bosses, as they were very experienced with it, so they helped us by clarifying a few things between New Relic and LogicMonitor, as they told us that if you are looking for an automated option, then there is no better option than LogicMonitor.
Pricing seems to be getting more and more aggressive, I worry that it's going to turn into ServiceNow or SAP and everything minor feature will be an extreme cost that prices out us and our customers
Auvik has worked on sites with 15+ offices connected with VPN's and we have not encountered any issues with the monitoring. On larger sites the map can be a bit cumbersome to read however it can be cleaned up easily with device filters.
Haven't really used it but our initial onboarding PS was disappointing. Felt like we were being told what we needed to cover as opposed to what we wanted to cover. In addition, we were pushed into using the PS in tight time frames and we were not ready to do so.
the ROI for Auvik comes from the time it saves in updating documentation and onboarding, new clients. We no longer have to spend a day investigating a network and documenting it, this is life and up to date so you always have true information for reporting and troubleshooting.
Unfortunately, we hit our logging cap on a weekly basis and we lose logs after that.
We have lost logs after hitting the maximum during service outages. We have become accustomed to not being able to rely on having them, then things go poorly.