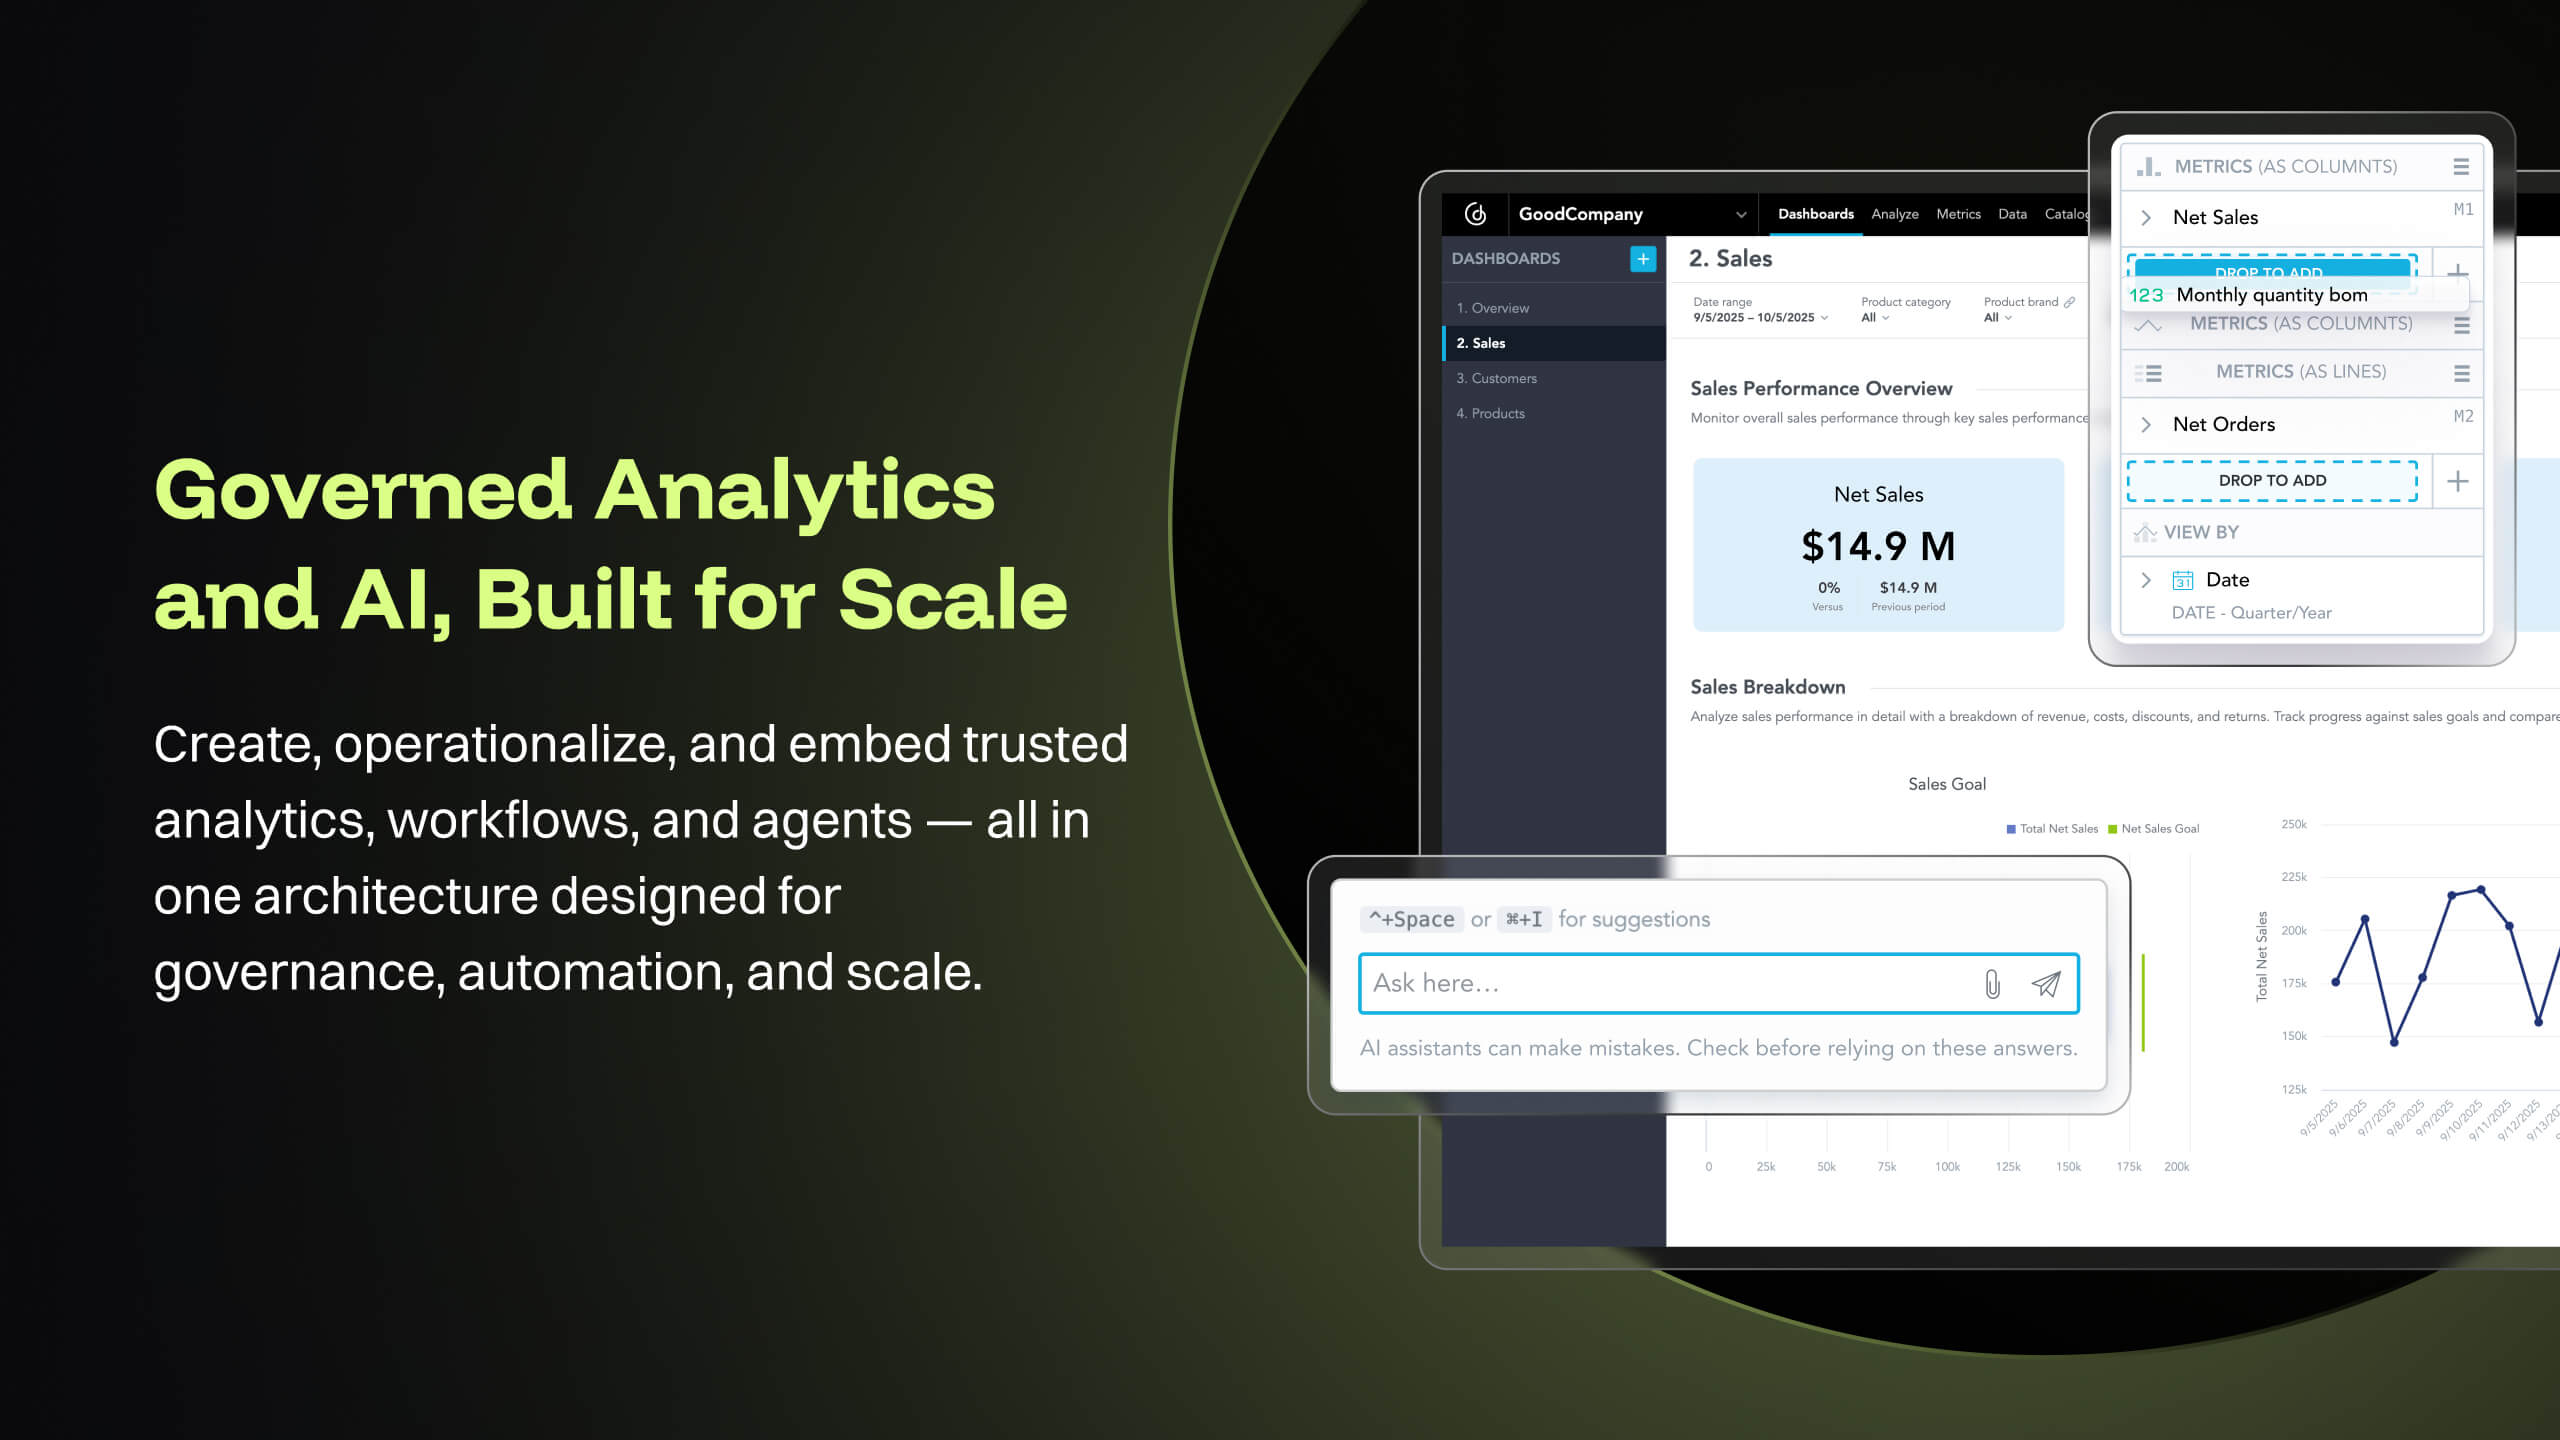
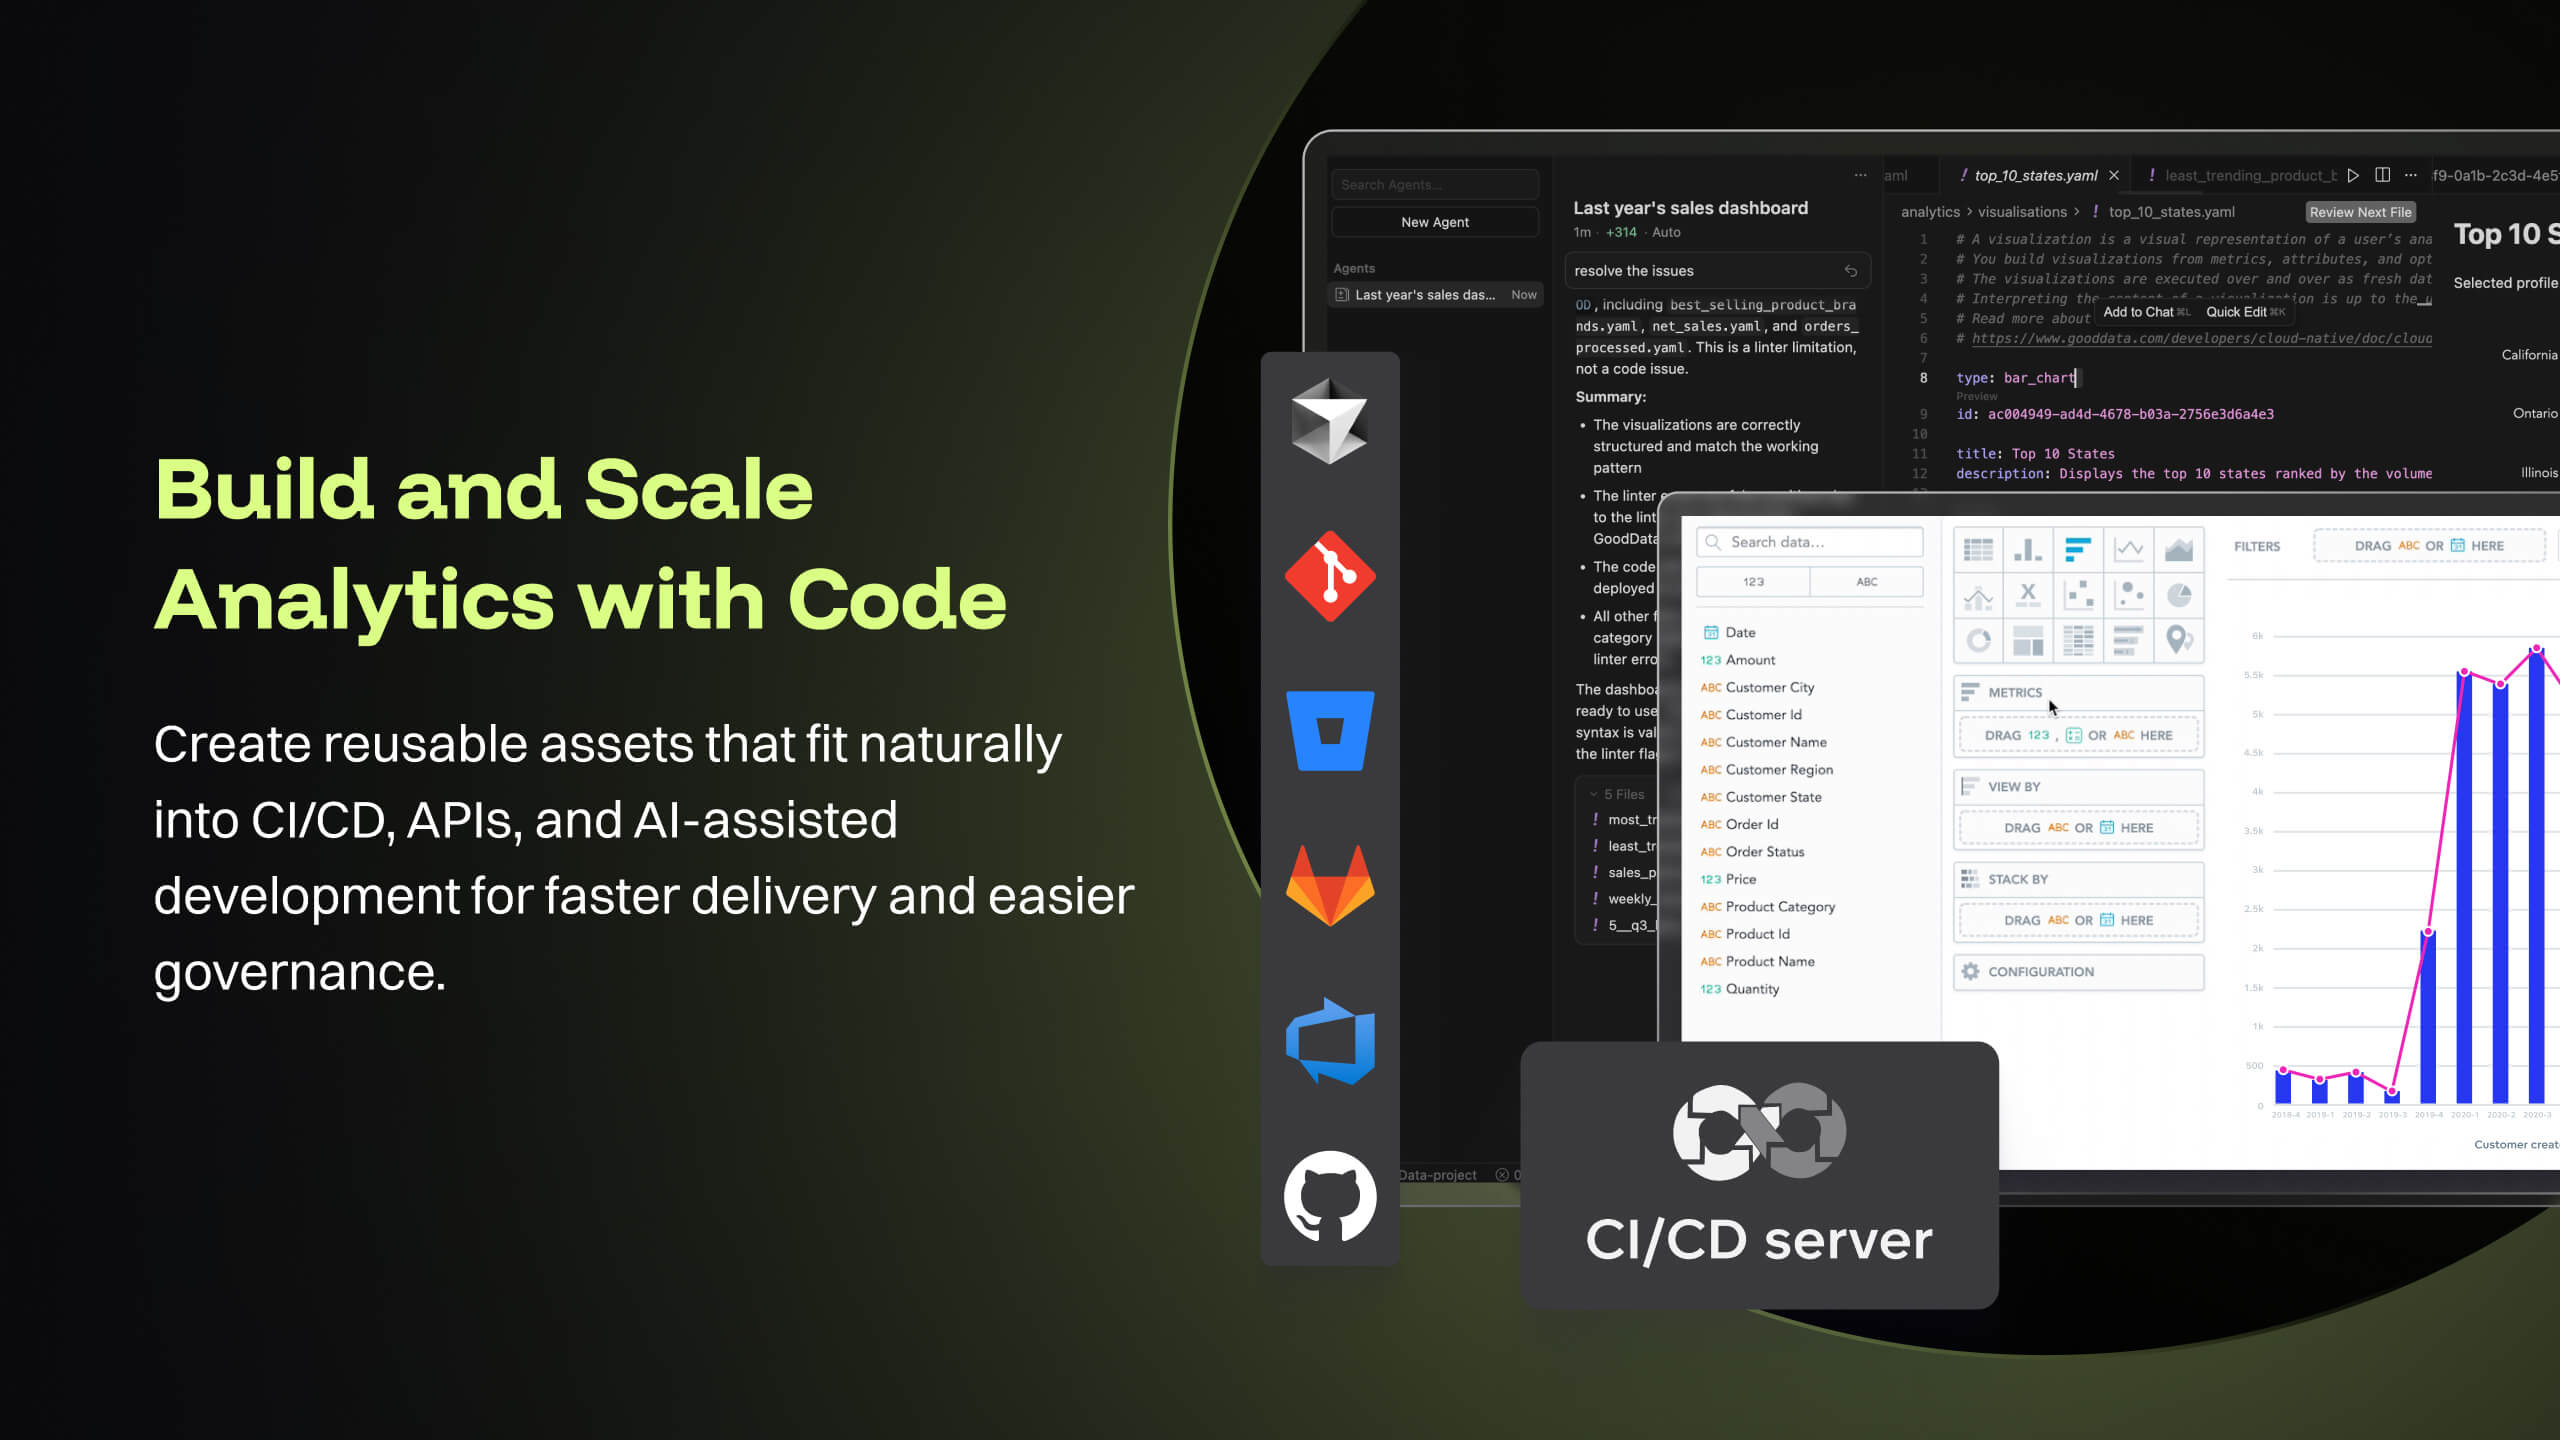
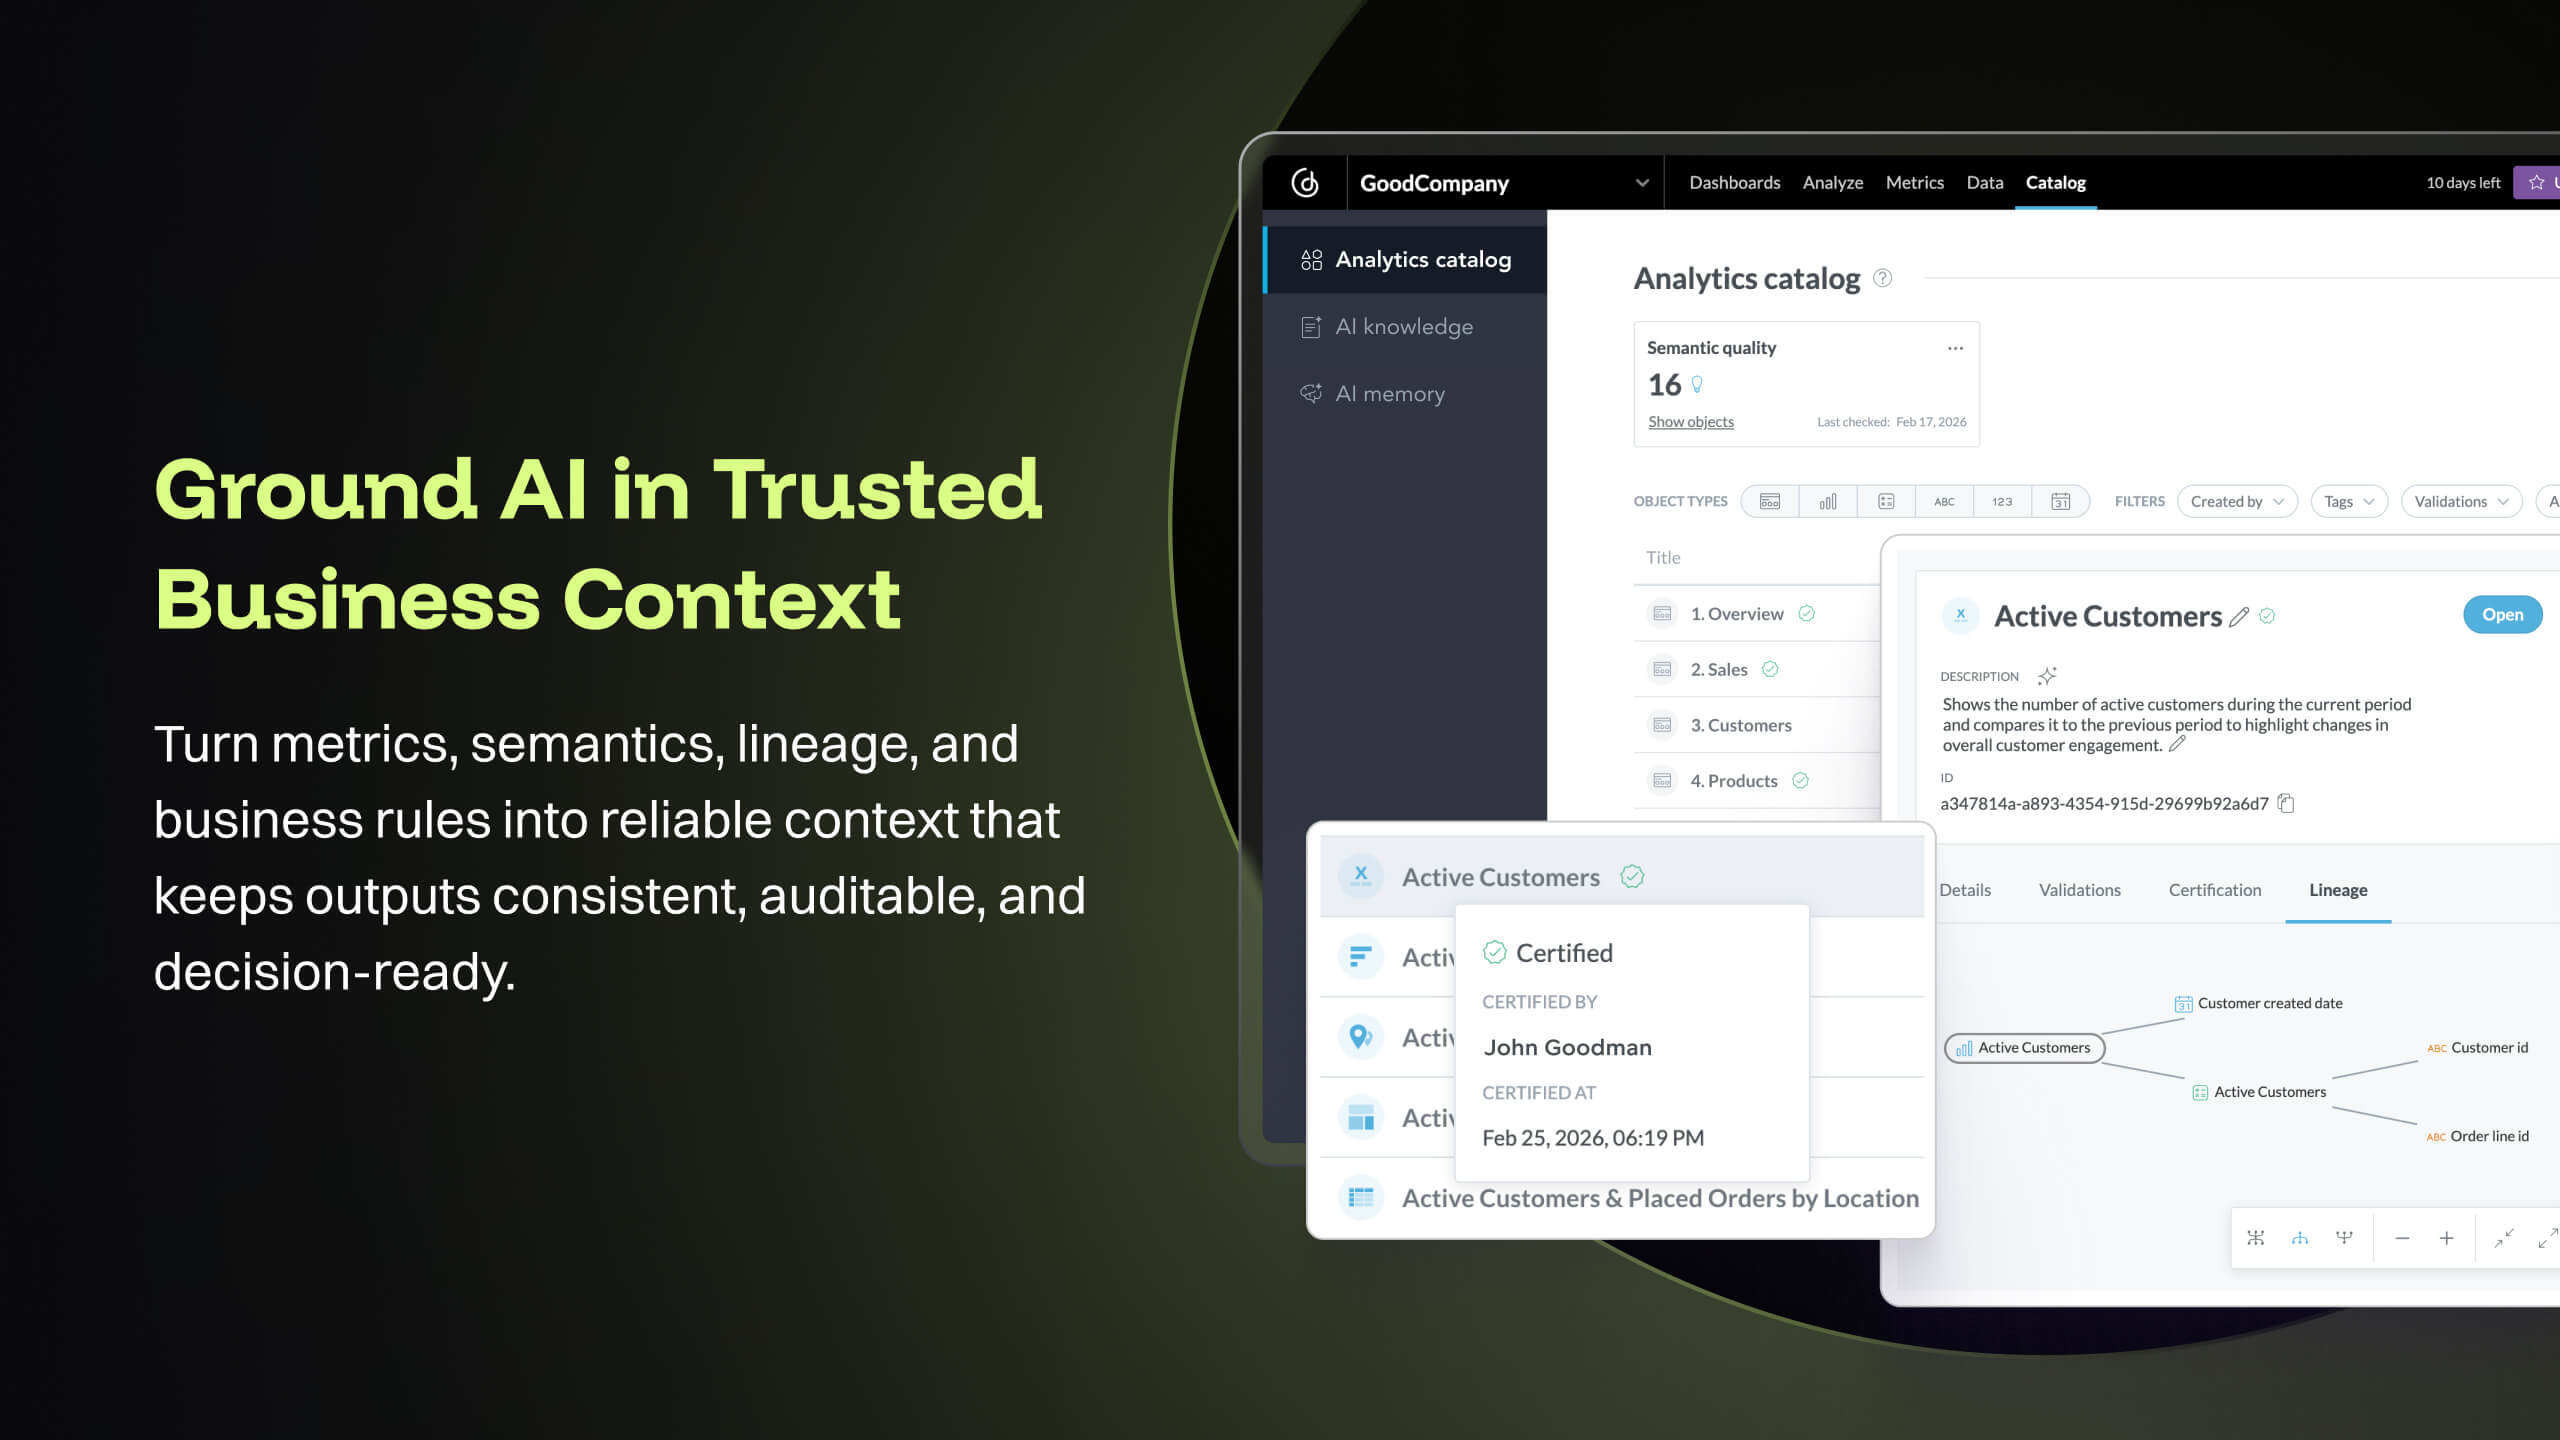
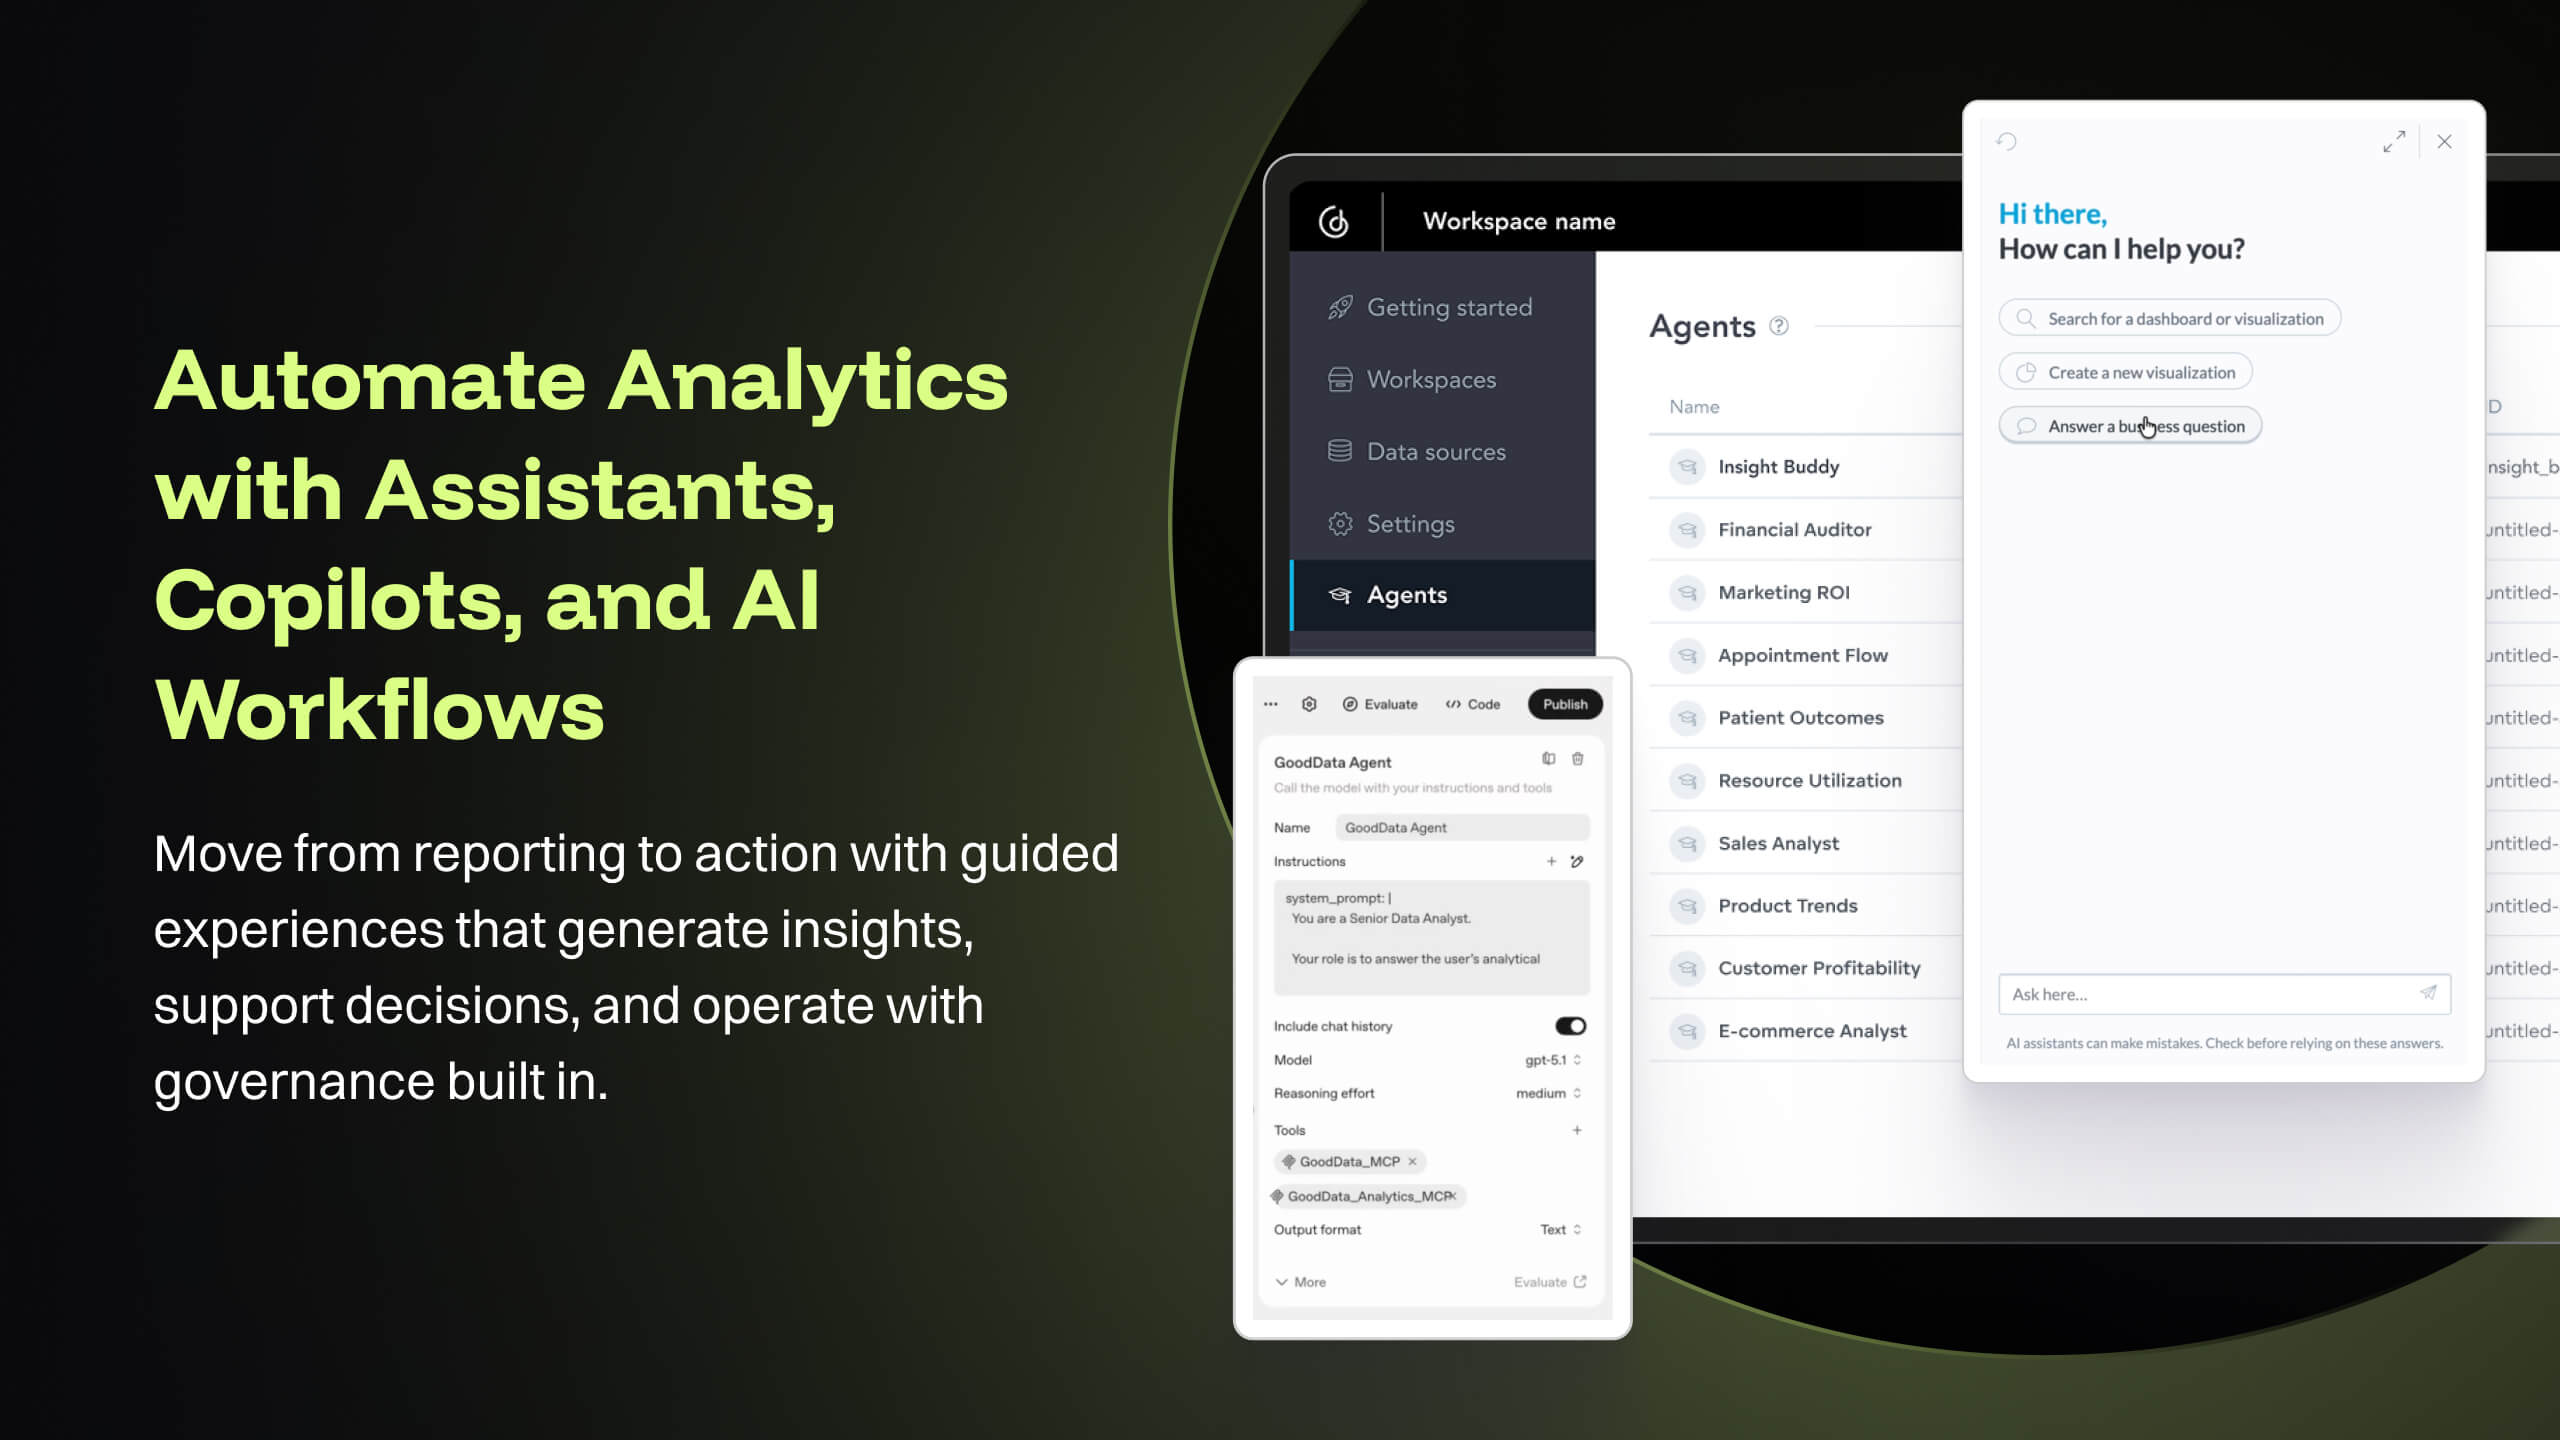
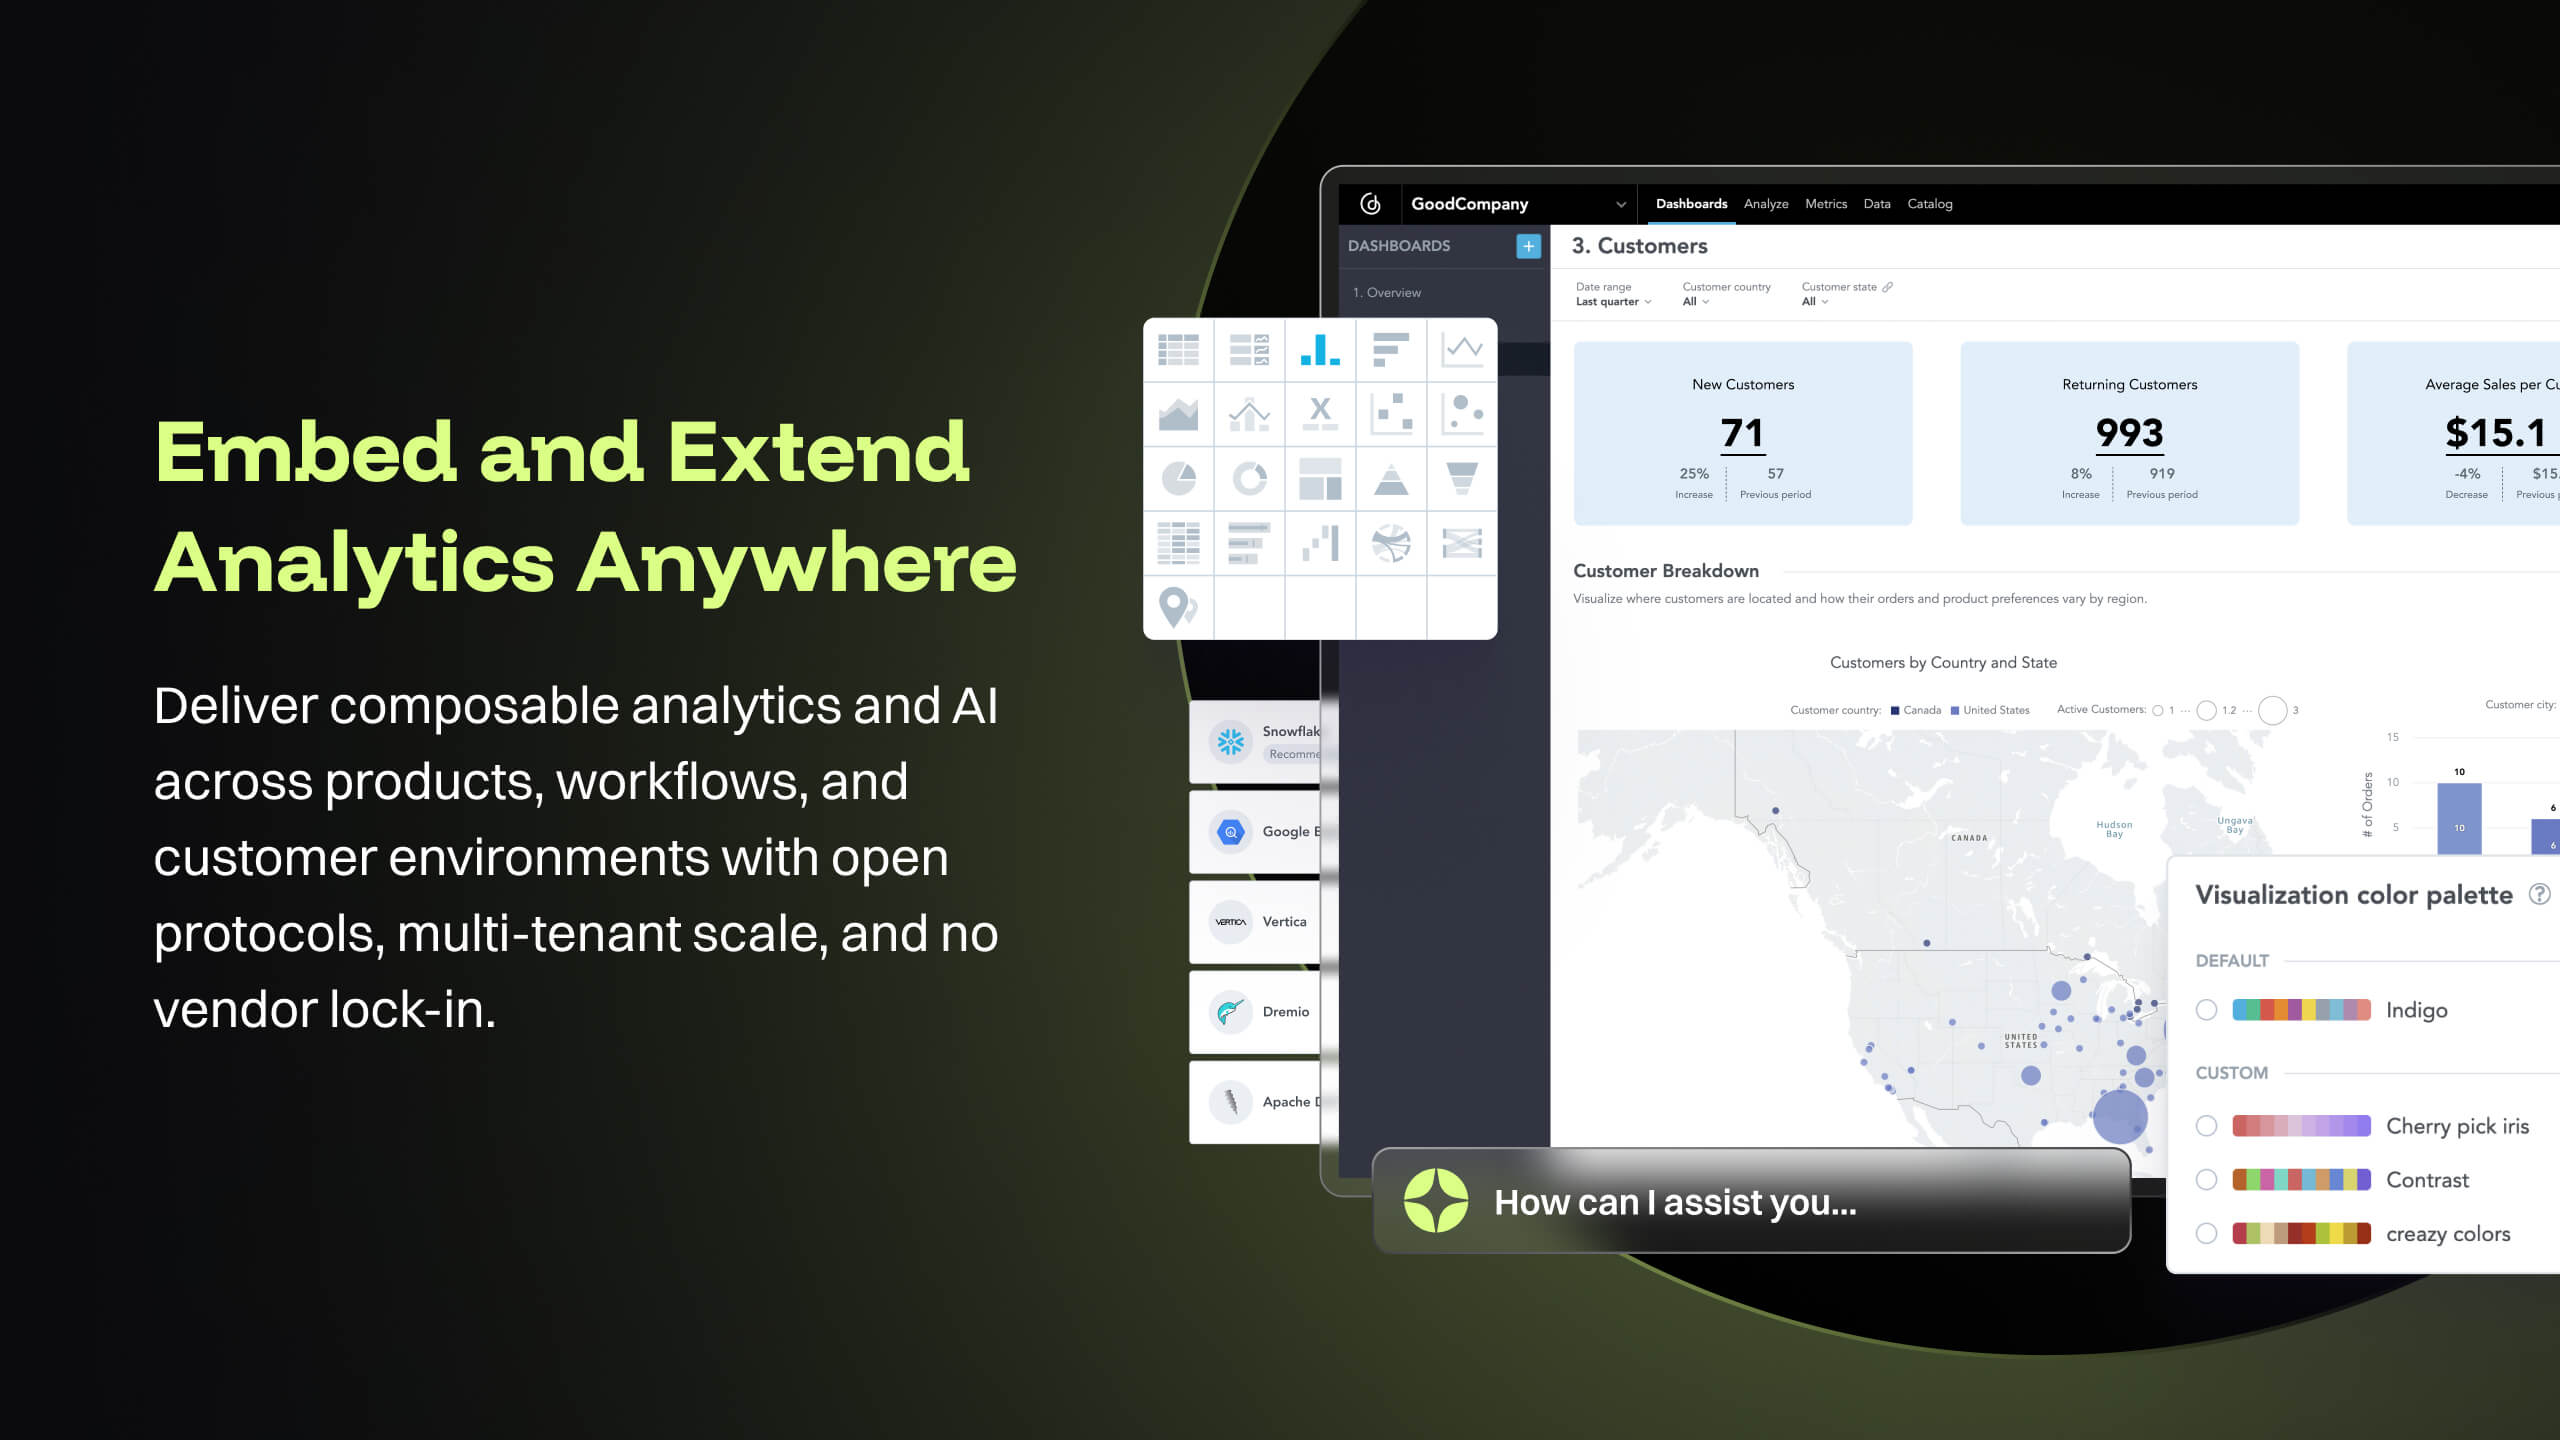
GoodData is an analytics platform used by organizations to deliver real-time, governed insights, embedded into products, customized for users, and integrated into any data environment.
N/A
Looker
Score 8.3 out of 10
N/A
Looker is a BI application with an analytics-oriented application server that sits on top of relational data stores. It includes an end-user interface for exploring data, a reusable development paradigm for data discovery, and an API for supporting data in other systems.
N/A
New Relic
Score 8.2 out of 10
N/A
New Relic is a SaaS-based web and mobile application performance management provider for the cloud and the datacenter. They provide code-level diagnostics for dedicated infrastructures, the cloud, or hybrid environments and real time monitoring.
$0
No credit card required; 100 GB free ingest per month, 1 free full user + unlimited basic users, 8 days retention, 100 Synthetics Checks
Pricing
GoodData.AI
Looker
New Relic
Editions & Modules
No answers on this topic
No answers on this topic
Free (Forever)
$0
No credit card required; 100 GB free ingest per month, 1 free full user + unlimited basic users, 8 days retention, 100 Synthetics Checks
Telemetry Data Platform
$0.25
per month per extra GB data ingest (after first free 100GB per month)
Incident Intelligence
$0.50
per month per event (after first 1000 free events per month)
Standard
$99
per month per full user (after first free full user - unlimited free basic users)
GoodData stacked better over Looker in its ability to manage distribute and provide custom control to end users. overall cost with GoodData would be lower as it would wound not depend on the data platform for compute resources.
Looker and GoodData are both powerful BI platforms, but they have distinct strengths. Looker offers seamless integration with Google Sheets, enabling easy data import and analysis. On the other hand, GoodData excels in data modeling, providing a user-friendly interface for …
GoodData seems less user friendly and doesn't provide that many visualization options so we are slowly moving to other solution in part of the company. There are still teams that plan to continue with GoodData and use React code in orther to supply missing functions.
Embedding flexibility was the main reason we chose GoodData. Interactivity, customization options, and programmatic ability were all very important to us and GoodData's embedding via React SDK offers exactly that. Implementation time was 50% shorter with GoodData than with …
GoodData is easier to understand and designed to detail critical data within a dashboard system. Visualization is essential, and the filters are quite varied. Metrics are also easy to use, so users only need to think a little more carefully about setting up the SQL required for …
GoodData is much more customisable in our case so we choose this. Also when it comes to pricing part GoodData is the best economically as well and in terms of features and functionalities. As compared to others similar products I believe that GoodData is much more reliable with …
GoodData has been proven best for us as it has given the most accurate analytical insights on our data. I've used other tools too but no one has been this good in terms of reporting, handling data, decision making. Using GoodData for almost every organisational decision and …
All of the tools have their plusses and minuses. The one thing that stands out with Qlik is that it allows for two-way API integrations with Salesforce. This means that analytics reporting results can interact with the Salesforce application.
The primary reasons GoodData was selected was data modeling capability, ability to standardize complex metrics, quality of viaualization and multi-tenancy
I have used all softwares in my past 10 years of experience. GoodData stands out with its seamless data integration, advanced predictive analytics, and collaborative features. Unlike Tableau and Power BI, GoodData offers scalable solutions with a user-friendly interface for …
Choosing between GoodData and other platforms was clear for me as the superiority of GoodData over others due to our needs. GoodData stands out for its awesome dashboards, robust predictive analytics, reports, and analysis. Data integration helps us for business intelligence …
GoodData is best among every other platform I used because it's a cloud based platform and way to easy to use. Its robust predictive analytics and unified data view set it way apart. While Power BI and Tableau excel in visualization, GoodData's focus on comprehensive business …
I was involved in the decision making but not final decision maker. Ease of implementation for GoodData vs Cognos (used for 15 years in multiple companies). I think Tableau's visualizations are better, but there is much that just can't be done in Tableau that GoodData handles …
In GoodData we really liked the fact that sales and engineering were on our side from the beginning, the calls were very easy to book and were efficient with clear agenda and participants. We also got invited on Slack were we had support from the team and also we liked the …
For analysts, Tableau is far better because of better graph visualization. Tableau does not need to deal with the amount of uploaded data. Our company uses Gooddata because of its unbeatable price.
I actually investigated around 20 options and in most part the embedding + multi tenant mode that became a key concern. They either do not have the support or the price scaling is terrible or the startup cost is prohibitive. On the average startup cost is around 50k per year and …
I think it works nicely for shops that want the analytical power and are ok to host their own infrastructure for the data and etl. For smaller operations with limited budgets but still high demand for analytical features the math may not work out.
When data drives potential for new orders, Looker earns its place in our tech stack. If, on the other hand, we are hoping for pipeline generation, Looker is useful if you are willing to repeatedly go check customer utilizations .... it is not appropriate if you are hoping to automate data analysis for this purpose.
New Relic its an excellent tool for monitoring services used on the SAAS universe, like web servers, relational and nosql dbms, reverse proxies, text databases, etc. Its also a powerful tool to monitor resource usage on said servers. However, its not well fitted to monitor custom services - if you need to generate alerts based on logs or database information, for example
The source datasets are often complex, semi-structured and un-linked to key entities. With GoodData, all of these datasets are unified to serve as a central semantic data model layer, building into a galaxy schema with dimensions, bridge, and facts, which then forms the backbone that powers the [...] data intelligence cloud. Building insights and dashboards become a much easier task once the underlying data model is designed. GoodData enforces certain best practices as a BI tool, which must be adhered to get the true value of the raw data. For e.g. the source FDA dashboard may just show inspection data but the Site Profile dashboard built on GoodData goes beyond the standard information and shows more insight into site risk scores and can be drilled into details. There is blog written on this topic: [...].
GoodData provides a rich collection of visualization options that help us create compelling story-telling via dashboards. Being well-prepared for FDA inspections is essential for maintaining product quality, regulatory compliance, and avoiding serious business setbacks. FDA inspections are critical events that can shape a company’s market access and reputation. The FDA itself offers the FDA Data Dashboard, but it doesn’t make every document available. There is a blog written on this topic: [...].
Medical devices and technologies do not stop evolving after they receive regulatory approval. Once a product hits the market, it faces real-world usage, compliance challenges, and an array of regulatory scrutiny. Managing these postmarket dynamics is critical to a product’s long-term success and patient safety. However, many companies struggle to keep track of relevant events across a product’s markets, from adverse event reports to changing regulations. Postmarket Intelligence developed on GoodData platform enables us to solve that problem. It empowers MedTech companies to efficiently monitor, assess, and act on postmarket data—saving time, improving decision-making, and ensuring compliance with industry standards. Anyone who is used to trying to get the data they need from the various FDA, and other regulatory agency websites, knows that collecting, cleaning, and structuring that data takes hours. And that’s before any analysis can get done. We enable customers to free up time to focus only on the high-value analysis and subsequent recommendations to leadership, rather than wrangling the data.
The data pipeline refresh that is provided by GoodData Platform is also quite useful from data engineering perspective. The Automated Data Distribution v2 or commonly called as ADD refresh follows a set pattern of identifying the analytical data model through output stage which helps abstract the complex table definition to simpler views that can help with quick rebuild at the data warehouse level while loading the data into GoodData's ADS storage layer. The import first way of loading data into GoodData's cloud storage, followed by querying for any aggregations or metrics on the GoodData analyzer, makes this simple and fast.
GoodData's latest product i.e. Cloud also offers several good features like Analytics as Code which helps software engineering teams follow a code-first approach to analytics, where building insights, dashboards or even datasets can be done in YAML templates or serviced by REST APIs. This is particularly forward thinking in the modern technology stack and evolving industry requirements. These provide seamless integration options to front-end and backend code, embedded analytics with multiple choices from HTML to React based workloads. At [...], we are currently exploring most of these features while planning for a future migration from Platform to Cloud.
Show visited pages - sessions, pageviews - which programs are viewed the most.
Displays session source/medium views to see where users are coming from.
It shows the video titles, URLs, and event counts so we can monitor the performance of our videos.
It gives a graphic face to the numbers, such as using bar charts, pie graphs, and other charts to show user trends or which channels are driving engagement.
Our clients like to see the top pages visited for a month.
I like the drop-and-drag approach, and building charts is a little easier than it was before.
Good Data is already have certain customizable options. However, having more flexibility in customizing reports and dashboards & control over the visual aspects would enhance the overall user experience.
To make Good Data even more powerful tool, improving the speed and responsiveness of the tool, especially during data-intensive tasks, would be a significantly helpful.
For new users, the interface can be made more user friendly which would promote easy navigation through features of tool.
And while powerful, building tailored dashboards with organ-specific metrics (such as energy load variance across regions) can be difficult to navigate. The UI isn't as drag-and-drop easy, and query-based widgets typically involve some trial and error for non-devs.
Alerts may be hypersensitive or over general. I We often get a spam of non-critical alerts while doing load testing, all overhauling to me alone and making it difficult to identify actual issues especially in energy systems where spikes are very common.
With our expanding fleet of Iot devices, the per-host pricing model is becoming expensive, quickly. More detailed billing based on microservices, or that works at sensor level, would make it more adaptable for energy platforms.
Because gooddata really helps us in processing data to make reports or dashboards. So we are very satisfied when we use it. What we like is the flexible use of charts. We change at will the use of charts to display in reports or dashboards. Thank you Gooddata for helping companies like us who need flexibility in usage
I give it this rating because it deems as effective, I am able to complete majority of my tasks using this app. It is very helpful when analyzing the data provided and shown in the app and it's just overall a great app for Operational use, despite the small hiccups it has (live data).
The only issue that we have had with New Relic is that the price might be a little expensive for smaller companies. The amount of data you store in New Relic impacts the cost, and can get away from you if you don't work closely with the vendor. Overall though the application is top notch.
From a customer perspective it is incredibly usable. We have more users building their own reports that would normally need custom work from our support team. The back end can be daunting when trying to configure things like new data elements or push changes to a report to all existing customers.
Looker is relatively easy to use, even as it is set up. The customers for the front-end only have issues with the initial setup for looker ml creations. Other "looks" are relatively easy to set up, depending on the ETL and the data which is coming into Looker on a regular basis.
I have given this much rating as I am used New Relic in different sectors and for different use cases like its K8s monitoring, infra monitoring, full stack monitoring as compare to other tools New Relic gives data in a formatted and connected way, and also it is giving us value for money. It also launches new features day by day which helps users to track the issue very quickly. It also supports OTel integrations which is the latest trend of observability tools. thats why I had given this much rating to New Relic.
Somehow resources heavy, both on server and client. I recommned at least 50Mbs data rate and high performance desktop comouter to be abke to run comolex tasks and configure larger amount of data. On the other hand, the client does not need to worry when viewing, the performance is usually ok
Support team has been highly responsive and helpful from our first initial deployment to present day. They engage and work with us. know when to escalate for more challenging problems. They also follow up. Overall have had a very good experience with support
Never had to work with support for issues. Any questions we had, they would respond promptly and clearly. The one-time setup was easy, by reading documentation. If the feature is not supported, they will add a feature request. In this case, LDAP support was requested over OKTA. They are looking into it.
The support team has been really helpful and resolved most of the issues on time. However, for a couple of issues, several follow-ups were needed to elicit a reasonable response. The issue was deeply technical and could have been investigated only by their Architects, and bringing them into the ticket took longer than needed
Implementations are hard and we had limited technical resources. We relied too heavily on GD care team. When we found technical gaps, they weren't simple to overcome
It's better to start by implementing New Relic in one project and test everything. Try to follow best recommended practices and read all the official documentation. Everything seems well tested. Then, start by installing agents to the rest of your projects and keep a close look to all logs and metrics New Relic gives you.
GoodData comparing to other platform is very easy to use, customer support and on-boarding support. Set of features, speed of integration in our platform. Also great benefit for us was very competetive pricing.
Looker Studio, you can easily report on data from various sources without programming. Looker Studio is available at no charge for creators and report viewers. Enterprise customers who upgrade to Looker Studio Pro will receive support and expanded administrative features, including team content management. So it's good.
Data Dog has solutions that look more attractive, but not at their price point. We have also tried to build a solution straight from the Cloud, where our business is built, but some things are too hard to replicate. This shows that New Relic is useful and helps our efficiency.
Looker has a poignant impact on our business's ROI objectives. As an advertising exchange we have specific goals for daily requests and fill, and having premade Looks to monitor this is an integral piece of our operational capability
To facilitate an efficient monthly billing cycle in our organization, Looker is essential to track estimated revenue and impression delivery by publisher. Without the Looks we have set up, we would spend considerably more time and effort segmenting revenue by vertical.
Looker's unique value proposition is making analytical tools more digestible to people without conventional analytical experience. Other competing tools like Tableau require considerably more training and context to successfully use, and the ability to easily plot different visualizations is one of its greatest selling points.