
T. Blane McMichen
President
Chose Google Analytics
Campaign tracking requires more set-up in Webtrends, and the additional cost is hard to justify.
| Product | Rating | Most Used By | Product Summary | Starting Price |
|---|---|---|---|---|
 Google Analytics | N/A | Google Analytics is perhaps the best-known web analytics product and, as a free product, it has massive adoption. Although it lacks some enterprise-level features compared to its competitors in the space, the launch of the paid Google Analytics Premium edition seems likely to close the gap. | $0 per month | |
 Microsoft Power BI | N/A | Microsoft Power BI is a visualization and data discovery tool from Microsoft. It allows users to convert data into visuals and graphics, visually explore and analyze data, collaborate on interactive dashboards and reports, and scale across their organization with built-in governance and security. | $168 per year per user | |
 Webtrends Analytics | N/A | WebTrends provides an enterprise web analytics platform and, according to Forrester, has a strong focus on support for mobile and social channels and a very open platform. Webtrends competes directly with Adobe Site Catalyst, IBM Coremetrics. and comScore DigitalAnalytix. | N/A |
| Google Analytics | Microsoft Power BI | Webtrends Analytics | ||||||||||||||||||||||
|---|---|---|---|---|---|---|---|---|---|---|---|---|---|---|---|---|---|---|---|---|---|---|---|---|
| Editions & Modules |
|
| No answers on this topic | |||||||||||||||||||||
| Offerings |
| |||||||||||||||||||||||
| Entry-level Setup Fee | No setup fee | No setup fee | No setup fee | |||||||||||||||||||||
| Additional Details | — | Power BI Desktop is the data exploration and report authoring experience for Power BI, and is available as a free download. | — | |||||||||||||||||||||
| More Pricing Information | ||||||||||||||||||||||||
| Google Analytics | Microsoft Power BI | Webtrends Analytics | |
|---|---|---|---|
| Considered Multiple Products |  Google Analytics T. Blane McMichen President Chose Google Analytics Campaign tracking requires more set-up in Webtrends, and the additional cost is hard to justify.  Alex Nejako Marketing Automation Manager Chose Google Analytics  Thomas (TC) Riley Senior Director, Information Services Chose Google Analytics Adobe Analytics and Google Analytics 360 are both paid/premium options for website tracking. Though there are certain use cases when these might make sense (you operate entirely in the Adobe suite, you're a massive company/site that doesn’t mind the price tag on Google …  Adam Hatfield Head of Digital Chose Google Analytics We have been using Google Analytics for over 10 years. Over that time we have periodically reviewed our analytics platforms a number of times. For us, it made more sense to stay with google analytics primarily because if we migrated to another platform we would lose the …  Michael Baker Digital Marketing Manager Chose Google Analytics We tested Webtrends and purchased Omniture (which we used for 2 years). Webtrends wasn't a good fit overall. Omniture was too cumbersome and expensive. The support was HORRIBLE and for a paid product it lacked some basic, no-brainer features.  Jennifer (Utterback) Davis Vice President, Emarketing Chose Google Analytics We have used Omniture and WebTrends. WebTrends is an outdated analytics tool. Omniture, while robust is just not as customizable. Basically, if you have no intention or no need to do customization and you just want out-of-the-box reporting and not willing to spend the time in … | Microsoft Power BI  Scott Kennedy Director, eCommerce Analytics and Digital Marketing Chose Microsoft Power BI Power BI from a price perspective is the lowest cost (probably even from a total cost of ownership perspective) of all the offerings I have ever evaluated. The piece that really stands out for Power BI is the data transformation layer called Power Query. This section allows you …  Bernardo Cavalheiro People & Culture Assistant Chose Microsoft Power BI SPSS is a tool more focused in establishing relationships among different variables, in a given database. By being so, it has some specific commands that allow you to easily do regression analysis, ANOVAs, segment a sample, and so on. However, Power BI is much more developed in …  Rohit Acharya Business Intelligence Manager Chose Microsoft Power BI  Kevin Lee Elder Associate Professor Chose Microsoft Power BI Much easier learning curve and integration with Microsoft Office gives it a leg up. People not knowing they have it, believe it or not, is limiting it's usage. Microsoft really needs to market it!  Ryan Kasper Engagement Manager Chose Microsoft Power BI I thought the learning curve of Power BI was much easier than some of the other tools that I had tried. There were pieces that were not as robust, but nothing that was a show stopper for my needs.  jim paroly Freelance Photographer Chose Microsoft Power BI Microsoft's Power BI is what Excel graphing and pivoting should have been like. Power BI has much better ways to look at your data visually than you can with Excel's own tools. You can select from many built-in graph types or you can use the growing number of add-ons to get … |  Webtrends Analytics  Jaclyn Wallace Campaign Measurement & Reporting Coordinator Chose Webtrends Analytics I find Google Analytics to be very limiting. This may also be the way that the reports have been structured by our organization. It is viewed as an older way to obtain the metrics we are after and no new projects are implemented through Google Analytics.  David Cox Senior Business Intelligence Analyst Chose Webtrends Analytics We currently use WebTrends, Google Analytics, Kissmetrics and ClickTale. I would like us to consolidate our activities to be focused on just Webtrends as it covers all of the requirements we have very well.  Nathan Collins CRM Analyst Chose Webtrends Analytics Using Omniture at my current place of employment and using Google Analytics as a backup at both, Webtrends is the clear superior product. I go back to how easy the UI is to navigate and how simple it is to get user level data that isn't duplicated or doesn't try to pigeon hold …  Mary Kay Scott Web Developer III Chose Webtrends Analytics Compared to WebTrends, Google Analytics has a slicker interface, provides live site usage data, and is easier to jump into with basic usage. These days users expect to be able to create their own reports as needed, rather than have an "expert" do it for them. They are used to …  Matthieu Dejardins Head of Web Analytics & Testing Chose Webtrends Analytics Webtrends was selected because of the price for Google Analytics Premium ($110k per year) and Adobe Omniture Analytics (twice the price). Clearly, it needed the Visitor Data Mart to get additional capability that you would expect as part of a Web Analytics suite. In our case, …  Brian Mackintosh Director of eCommerce Chose Webtrends Analytics I have only had significant experience with Google Analytics (GA) and WebTrends in this space. Overall - it is easier to learn and modify GA reports as a casual user - I always struggled with the fact that GA only offered partial data (sampling based).  Chaim (Daniel) Arnstein Consultant (6+ Years) Sr. Systems Analyst - VP (7 Years) Chose Webtrends Analytics Have not use Webtrends competitors  Kevin Ornduff Marketing Analyst Chose Webtrends Analytics Webtrends is just an option, depending on client budget. It's a simple analytics tool that does the job but we always recommend Omniture whenever possible.  Adam Krause Manager of Web Analytics Chose Webtrends Analytics We evaluated Google Analytics, but we picked Webtrends as it offered better value for the price. |
| Google Analytics | Microsoft Power BI | Webtrends Analytics | |||||||||||||||||||||||||||||||||||
|---|---|---|---|---|---|---|---|---|---|---|---|---|---|---|---|---|---|---|---|---|---|---|---|---|---|---|---|---|---|---|---|---|---|---|---|---|---|
| Web Analytics |
| ||||||||||||||||||||||||||||||||||||
| BI Standard Reporting |
| ||||||||||||||||||||||||||||||||||||
| Ad-hoc Reporting |
| ||||||||||||||||||||||||||||||||||||
| Report Output and Scheduling |
| ||||||||||||||||||||||||||||||||||||
| Data Discovery and Visualization |
| ||||||||||||||||||||||||||||||||||||
| Access Control and Security |
| ||||||||||||||||||||||||||||||||||||
| Mobile Capabilities |
| ||||||||||||||||||||||||||||||||||||
| Application Program Interfaces (APIs) / Embedding |
|
| Google Analytics | Microsoft Power BI | Webtrends Analytics | |
|---|---|---|---|
| Small Businesses |  StatCounter Score 9.0 out of 10 |  Yellowfin Score 8.7 out of 10 | StatCounter Score 9.0 out of 10 |
| Medium-sized Companies |  Siteimprove Score 9.0 out of 10 |  Reveal Score 10.0 out of 10 | Siteimprove Score 9.0 out of 10 |
| Enterprises |  Optimal Score 9.1 out of 10 |  Kyvos Semantic Layer Score 9.5 out of 10 | Optimal Score 9.1 out of 10 |
| All Alternatives | View all alternatives | View all alternatives | View all alternatives |
| Google Analytics | Microsoft Power BI | Webtrends Analytics | |
|---|---|---|---|
| Likelihood to Recommend | 8.5 (192 ratings) | 8.5 (197 ratings) | 7.1 (30 ratings) |
| Likelihood to Renew | 9.0 (51 ratings) | 9.5 (3 ratings) | 5.4 (25 ratings) |
| Usability | 7.4 (19 ratings) | 8.3 (113 ratings) | 5.4 (7 ratings) |
| Availability | 10.0 (4 ratings) | - (0 ratings) | 9.0 (4 ratings) |
| Performance | 10.0 (2 ratings) | - (0 ratings) | 8.2 (3 ratings) |
| Support Rating | 7.0 (42 ratings) | 10.0 (52 ratings) | 8.8 (8 ratings) |
| In-Person Training | - (0 ratings) | - (0 ratings) | 9.7 (3 ratings) |
| Online Training | 10.0 (2 ratings) | - (0 ratings) | 9.0 (4 ratings) |
| Implementation Rating | 9.0 (7 ratings) | 9.0 (1 ratings) | 9.9 (5 ratings) |
| Configurability | 6.0 (2 ratings) | - (0 ratings) | 7.1 (2 ratings) |
| Ease of integration | 10.0 (1 ratings) | - (0 ratings) | - (0 ratings) |
| Product Scalability | 10.0 (2 ratings) | - (0 ratings) | - (0 ratings) |
| Vendor post-sale | 10.0 (1 ratings) | - (0 ratings) | 9.0 (1 ratings) |
| Vendor pre-sale | 9.0 (1 ratings) | - (0 ratings) | 9.0 (1 ratings) |
| Google Analytics | Microsoft Power BI | Webtrends Analytics | |
|---|---|---|---|
| Likelihood to Recommend | Google
 sandro merkvilishvili Head of e-commerce deparment | Microsoft
| Webtrends
Chaim (Daniel) Arnstein Consultant (6+ Years) Sr. Systems Analyst - VP (7 Years) |
| Pros | Google
| Microsoft
| Webtrends
 Mitchell Teixeira Consultant |
| Cons | Google
| Microsoft
| Webtrends
 Chris Grant Associate Director of Analytics |
| Likelihood to Renew | Google
| Microsoft
 David Jensen Operations Manager, Customer Success | Webtrends
|
| Usability | Google
 Victor Campos Web Developer | Microsoft
| Webtrends
|
| Reliability and Availability | Google
| Microsoft No answers on this topic | Webtrends
|
| Performance | Google
| Microsoft No answers on this topic | Webtrends
Adam Krause Manager of Web Analytics |
| Support Rating | Google
 Sarah Hoffman Media Director | Microsoft
| Webtrends
 Matthew Koppel Analytics and Insights Supervisor |
| In-Person Training | Google No answers on this topic | Microsoft No answers on this topic | Webtrends
Adam Krause Manager of Web Analytics |
| Online Training | Google
 Roy Morejon President | Microsoft No answers on this topic | Webtrends
Adam Krause Manager of Web Analytics |
| Implementation Rating | Google
 Joshua Van Horsen Marketing Manager | Microsoft
 Anuj Sant Senior buyer | Webtrends
Mitchell Teixeira Consultant |
| Alternatives Considered | Google
| Microsoft
| Webtrends
|
| Scalability | Google
| Microsoft No answers on this topic | Webtrends No answers on this topic |
| Return on Investment | Google
 Heide Rembold Director of Marketing & Analytics | Microsoft
| Webtrends
 Lindsay Buescher Senior Manager, Analytics |
| ScreenShots | Microsoft Power BI Screenshots      | Webtrends Analytics Screenshots  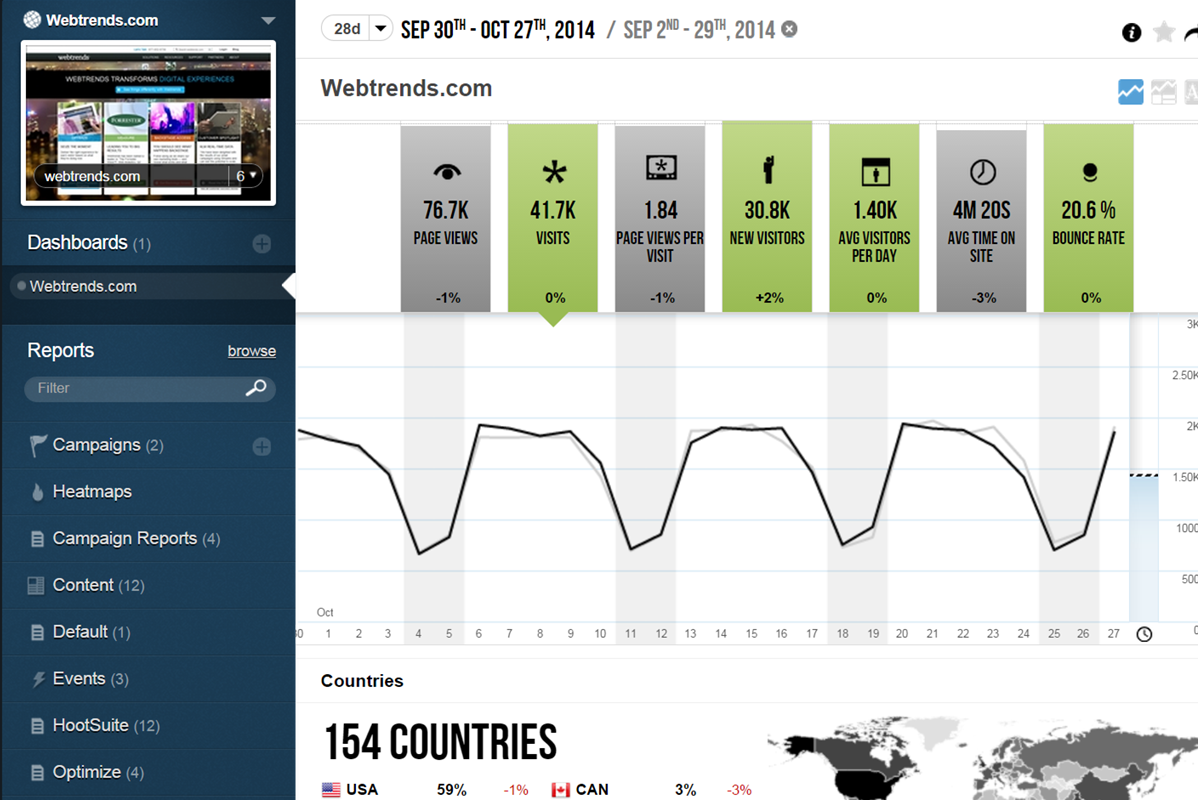 |