New Relic is a SaaS-based web and mobile application performance management provider for the cloud and the datacenter. They provide code-level diagnostics for dedicated infrastructures, the cloud, or hybrid environments and real time monitoring.
$0
No credit card required; 100 GB free ingest per month, 1 free full user + unlimited basic users, 8 days retention, 100 Synthetics Checks
SolarWinds Server & Application Monitor
Score 7.7 out of 10
N/A
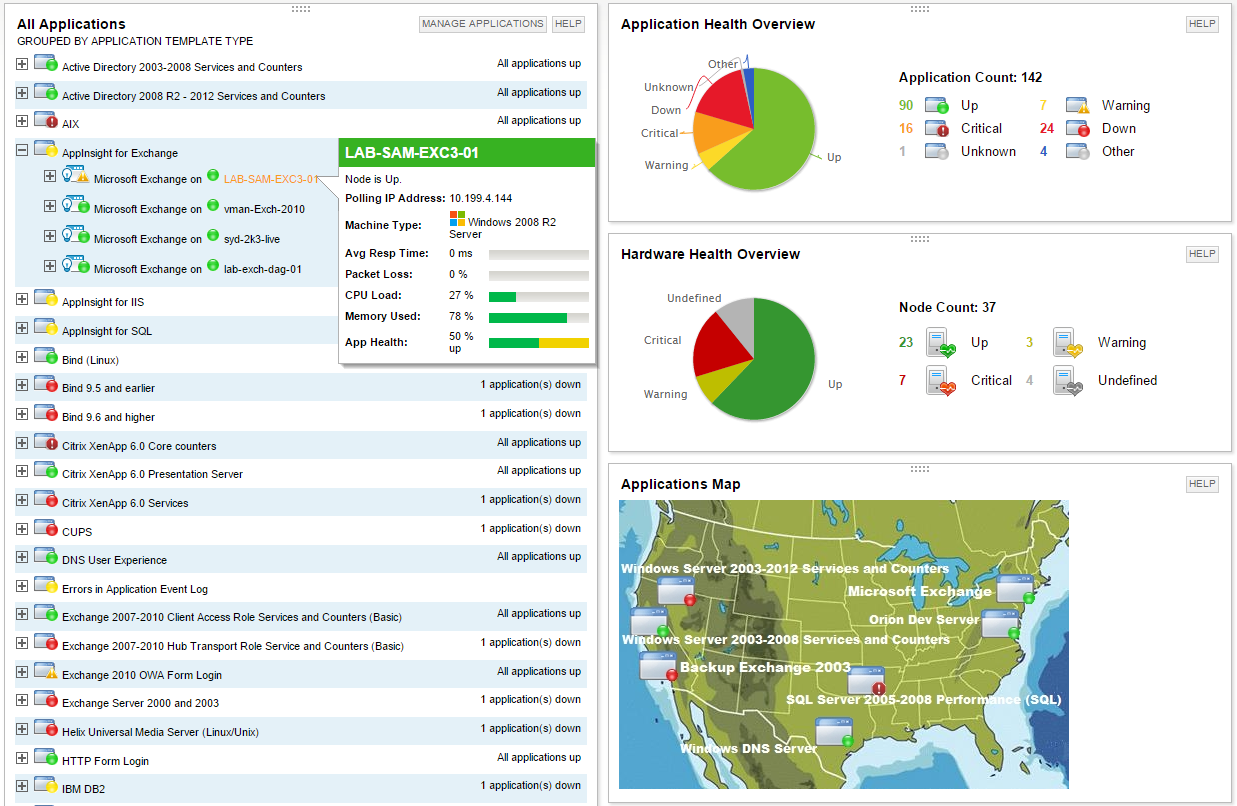
SolarWinds Server & Application Monitor (SAM) delivers application and server monitoring capabilities. SAM allows for self-service for easy setup, 1200+ monitoring templates, and customization options, as well as integrate with other SolarWinds products.
N/A
Zabbix
Score 8.5 out of 10
N/A
Zabbix is an open-source network performance monitoring software. It includes prebuilt official and community-developed templates for integrating with networks, applications, and endpoints, and can automate some monitoring processes.
N/A
Pricing
New Relic
SolarWinds Server & Application Monitor
Zabbix
Editions & Modules
Free (Forever)
$0
No credit card required; 100 GB free ingest per month, 1 free full user + unlimited basic users, 8 days retention, 100 Synthetics Checks
Telemetry Data Platform
$0.25
per month per extra GB data ingest (after first free 100GB per month)
Incident Intelligence
$0.50
per month per event (after first 1000 free events per month)
Standard
$99
per month per full user (after first free full user - unlimited free basic users)
Pro
Contact sales team
Enterprise
Contact sales team
No answers on this topic
No answers on this topic
Offerings
Pricing Offerings
New Relic
SolarWinds Server & Application Monitor
Zabbix
Free Trial
No
Yes
No
Free/Freemium Version
Yes
No
No
Premium Consulting/Integration Services
No
No
No
Entry-level Setup Fee
No setup fee
No setup fee
No setup fee
Additional Details
—
SAM pricing starts at $2,995.
—
More Pricing Information
Community Pulse
New Relic
SolarWinds Server & Application Monitor
Zabbix
Considered Multiple Products
New Relic
Verified User
Team Lead
Chose New Relic
New Relic is a SaaS-based tool where the health or sanity checks of the tool have been taken care of by the product team. So the maximum time can be invested in using the tool and making the best use of the feature available in the tool. The flexibility option it provides to …
The last time we did a monitoring and performance shootout was years ago. While I can say we picked SolarWinds' Orion suite over WhatsUp Gold, Zabbix, and several others, it would be unfair to list the shortcomings of each for our needs, because they might not be valid anymore.
Zabbix gives limited value. Even though the SAM is paid, we (Management) would agree to pay for it because of the value it brings in. The comparison was very positive towards SAM. It could be with Dashboards, In-built templates, Forecast, Monitoring, Alerts.
SAM shines in a mixed environment but really excels where the environment is predominantly on-prem. Both New Relic and Datadog offer an Infrastructure + APM solution. New Relic struggles with Infrastructure and Datadog struggles with APM. SolarWinds does not claim to be an APM …
The monitoring capabilities of both SCOM and Zabbix was OK, the licensing and configuration complexity for SCOM was huge. The Zabbix system was very good on the non-windows side, and limited on the Windows side. SAM, when utilized with the different modules that we own, …
The nature of monitoring applications is to alert, offer ways to keep a production environment up and running, and limit/reduce interruptions. We have Zabbix and Nagios Network Analyzer in place, which help uptime and other critical infrastructure stay in operation. Metrics …
Compared to New Relic, SolarWinds Server & Application Monitor definitely is a better option and a better tool to use due to it is more user friendly despite the poor UI of SolarWinds Server & Application Monitor. Because of the above reason, my company is switching from New …
I have tried and researched many products including Cacti, Zabbix, Dynatrace, as far as I have read the best crafted product among them is SolarWinds. [Already], SolarWinds company is the most successful company that has proven itself in issues such as monitoring and logging.
It provides accurate information on outages and traffic predictions, saving the company a lot of money. It provides clear visibility into performance issues, and one can easily identify solutions from it. It has a very good UI interface compared to the other technologies …
SolarWinds Server & Application Monitor (SAM) is an Excellent for Windows-heavy, on-prem or hybrid environments with Solid out-of-the-box templates (SQL Server, IIS, Active Directory) with Mature alert engine with dependencies, suppressions, escalations; Although it is Not …
Compared to other monitoring products we evaluated or have used in the past, SolarWinds Server & Application Monitor stands out as being significantly easier to use and quicker to adopt. It delivers excellent value for the price, offering a broad set of monitoring capabilities …
SolarWinds is cost-effective, we have a great solution provider that helps us with tool integrations and maintenance, the integration capability and extensive documentation also help a lot in the ability to use it in various monitoring models and scripts.
Nagios and Rancid are used internally by a company that was acquired last year. They're a big open source group.
Other groups also use HostMonitor, Big Brother, and a couple of home grown tools that don't really stack up. Those groups don't want to change the way they do …
SolarWinds is just easier to set up and manage out of the box. I don't want to waste time configuring a solution when that solution is meant to be monitoring my environment.
SAM is infinitely easier to set up. I don't have to build out low-level agents to gather the information I want. SAM makes it as easy as checking some boxes in the UI. The UI is much easier to understand and set up. SAM comes with easy integration of LDAP to help manage users.
Application and network monitoring are great, but we need an externally based site monitor (like site 24x7 that we use currently) to be available through the Orion web console.
Monitoring solutions are usually tricky to install, confgure and maintain. SAM is easy in all of those aspects. It is not super hard to configure or set up and day-to-day operation is simple as well. It is also nice that it is back by a company with a very good support staff if …
SolarWinds SAM dominates OpenSource solutions. It is straightforward and easy to understand. Built-in application templates make setting up monitors a snap!
SAM's biggest advantage by far is EASY OF SETUP and USE. This is the one reason I went with SolarWinds...it blows the others away when it come to the simplicity. But it's simplicity paired with power.
In the past, when rolling out tools like Nagios, I feel like I needed to …
Most of the SolarWinds are separated out, whereas Zabbix includes templates and capabilities for all of them out of the box. Other solutions listed include most or all of them to varying degrees as well.
Zabbix was much better at handling traditional systems, and in ease of customization, both in the system itself, and customizing data sources, such as adding deep MySQL or JMX integrations. It's very good for organizing large-scale (hundreds or thousands of servers) systems; …
I personally prefer Zabbix over any other monitoring software that I have ever tried. Zabbix is so customizable that if there is a feature I need, I can easily implement it. I can then add that feature to a template in no time and have it applied to hundreds, or even thousands, …
Nagios will always be at or near the top, but I really like how sleek Zabbix is. Also, once it's up and running its really helps keep things in order for you and your customers. As for PandoraFMS, it would have beat out Zabbix, but the documentation on PandoraFMS is really …
New Relic its an excellent tool for monitoring services used on the SAAS universe, like web servers, relational and nosql dbms, reverse proxies, text databases, etc. Its also a powerful tool to monitor resource usage on said servers. However, its not well fitted to monitor custom services - if you need to generate alerts based on logs or database information, for example
It is a well-suited software for monitoring and surveillance of your deployed nodes. The error-readability and filter options for filtering out logs and errors could be improved. But overall, it has a good UI design, is user-friendly, and is very easy to learn and access for new users.
Zabbix is great for monitoring your servers and seeing alerts when the system uses too much CPU or memory. This allowed the system Engineer to be proactive and add resources to these systems to avoid interrupting the services. Especially servers running operations applications and services. This is one of the best usages for Zabbix.
Collecting hardware data - CPU, Memory, Network, and Disk Metrics are collected and reported on.
Flexible design - It is very easy to build out even very large environments via the templating system. You can also start where you are - network monitoring, server monitoring, etc. and then build it out from there as time and resources permit.
Provides a "plugin architecture" (via XML templates) to allow end users to extend it to monitor all kinds of equipment, software, or other metrics that are not already added into the software already.
Very complete documentation. Almost every aspect of Zabbix has been documented and reported on.
Cost - Zabbix is FOSS software and always free. Support is reasonably priced and readily available.
And while powerful, building tailored dashboards with organ-specific metrics (such as energy load variance across regions) can be difficult to navigate. The UI isn't as drag-and-drop easy, and query-based widgets typically involve some trial and error for non-devs.
Alerts may be hypersensitive or over general. I We often get a spam of non-critical alerts while doing load testing, all overhauling to me alone and making it difficult to identify actual issues especially in energy systems where spikes are very common.
With our expanding fleet of Iot devices, the per-host pricing model is becoming expensive, quickly. More detailed billing based on microservices, or that works at sensor level, would make it more adaptable for energy platforms.
The only issue that we have had with New Relic is that the price might be a little expensive for smaller companies. The amount of data you store in New Relic impacts the cost, and can get away from you if you don't work closely with the vendor. Overall though the application is top notch.
We are heavily invested in Solarwinds products for a reason. They are generally easy to setup and run with, requiring only some interfacing with support or help articles on rare occasions. They do what we bought them to do and we can't ask for more.
It is free. It didn't cost anything to implement (other than my time and the cost incurred for it) and it is filling a badly needed gap in our IT infrastructure. Support is available if we have issues and can be done annually or paid for on a per incident basis as needed. Expansion, updates, and all other future lifecycle activities are likewise free of cost, so as long as someone is able to implement/maintain the software (and the OSS project is maintained) then I imagine the company will never leave it.
I have given this much rating as I am used New Relic in different sectors and for different use cases like its K8s monitoring, infra monitoring, full stack monitoring as compare to other tools New Relic gives data in a formatted and connected way, and also it is giving us value for money. It also launches new features day by day which helps users to track the issue very quickly. It also supports OTel integrations which is the latest trend of observability tools. thats why I had given this much rating to New Relic.
SolarWinds Server & Application Monitor is quite easy to use and super versatile. It allows you to do just about anything you can through premade templates or through scripting. You can use an agent on the servers if you want to, or you can monitor through WMI or SNMP credentials. You can customize thresholds for alerting quickly, and you can configure alerts to be as complex or as simple as you want.
I think every organization, especially the IT department, needs a tool like this. I know of another product like Zabbix that gives a similar or the same solution, but its range makes it very useful. You can see almost all the device info in one place: disk usage, disk space, network usage, etc.
The graphical interface and the performance of the database leave a little to be desired, they could be better explored.Some functionality and screens do not work well depending on the browser used. The integrations never had any problems or caused crashes in other systems.
The support team has been really helpful and resolved most of the issues on time. However, for a couple of issues, several follow-ups were needed to elicit a reasonable response. The issue was deeply technical and could have been investigated only by their Architects, and bringing them into the ticket took longer than needed
I think there was only a couple times I had to open a support case for SAM and one time they got multiple engineers on the phone to get a better idea what I was trying to monitor and was able to point me in the best direction to monitor that system.
The setup is the most time-consuming portion of using zabbix. It takes a lot of effort to shape it into a usable format and even then it can get very messy. It's not exactly intuitive and as mentioned the UI seems a bit antiquated. If I was to roll out a monitoring solution from scratch, I'd probably look for alternatives which are easier to use and maintain.
It's better to start by implementing New Relic in one project and test everything. Try to follow best recommended practices and read all the official documentation. Everything seems well tested. Then, start by installing agents to the rest of your projects and keep a close look to all logs and metrics New Relic gives you.
We are a mainly Windows environment, so it would be useful if we could have used Active Directory to deploy agents. As of version 4.2, Zabbix has announced a new agent MSI file to allow exactly that. Unfortunately, we didn't have that option. Also, for Linux and MAC deployments, there is no simple way to deploy that. Using remote scripts you may be able to create something, but most places will opt for either SNMP (agentless) or manual installation of agents to add to Zabbix. A way of deploying agents via discovery would go a long way to helping in the adoption of the tool.
Data Dog has solutions that look more attractive, but not at their price point. We have also tried to build a solution straight from the Cloud, where our business is built, but some things are too hard to replicate. This shows that New Relic is useful and helps our efficiency.
Nagios requires far more manual work to configure than SolarWinds does, though that also encourages customization and perfect-fit solutions. Nagios also requires far, far fewer resources to run than SolarWinds: SolarWinds wants great gobs of memory and disk, while Nagios is refreshingly humble. Nagios starts working from the first minute, too, whereas SolarWinds needs lots of set-up time.
We're using the Solarwinds suite as our global monitoring standard, but it is very complex and its licensing model makes it difficult to monitor a wide range of technologies. So, we're using Zabbix as a complement on our monitoring process. Zabbix is a way more flexible and has free integrations to a wide range of technologies. It is also more 'user friendly' and easy to manage.