Visual KPI vs. Watershed LRS
Visual KPI vs. Watershed LRS
| Product | Rating | Most Used By | Product Summary | Starting Price |
|---|---|---|---|---|
 Visual KPI | N/A | Visual KPI is a business intelligence software offering from Transpara. | N/A | |
 Watershed LRS | N/A | Watershed LRS is a learning management software solution built to help employers identify skills and competencies. | $400 per month |
| Visual KPI | Watershed LRS | |||||||||||||||
|---|---|---|---|---|---|---|---|---|---|---|---|---|---|---|---|---|
| Editions & Modules | No answers on this topic |
| ||||||||||||||
| Offerings |
| |||||||||||||||
| Entry-level Setup Fee | No setup fee | Optional | ||||||||||||||
| Additional Details | — | — | ||||||||||||||
| More Pricing Information | ||||||||||||||||
| Visual KPI | Watershed LRS | |
|---|---|---|
| Top Pros | ||
| Top Cons |
|
|
| Visual KPI | Watershed LRS | |||||||||||||||||||||
|---|---|---|---|---|---|---|---|---|---|---|---|---|---|---|---|---|---|---|---|---|---|---|
| BI Standard Reporting |
| |||||||||||||||||||||
| Ad-hoc Reporting |
| |||||||||||||||||||||
| Report Output and Scheduling |
| |||||||||||||||||||||
| Data Discovery and Visualization |
| |||||||||||||||||||||
| Access Control and Security |
| |||||||||||||||||||||
| Mobile Capabilities |
| |||||||||||||||||||||
| Application Program Interfaces (APIs) / Embedding |
|
| Visual KPI | Watershed LRS | |
|---|---|---|
| Small Businesses |  BrightGauge Score 8.9 out of 10 | BrightGauge Score 8.9 out of 10 |
| Medium-sized Companies |  Reveal Score 9.9 out of 10 | Reveal Score 9.9 out of 10 |
| Enterprises |  Jaspersoft Community Edition Score 9.7 out of 10 | Jaspersoft Community Edition Score 9.7 out of 10 |
| All Alternatives | View all alternatives | View all alternatives |
| Visual KPI | Watershed LRS | |
|---|---|---|
| Likelihood to Recommend | 8.2 (2 ratings) | 9.0 (1 ratings) |
| Usability | 9.1 (1 ratings) | 9.0 (1 ratings) |
| Support Rating | 9.1 (1 ratings) | 10.0 (1 ratings) |
| Visual KPI | Watershed LRS | |
|---|---|---|
| Likelihood to Recommend | Transpara
| Watershed Systems, Inc
|
| Pros | Transpara
| Watershed Systems, Inc
|
| Cons | Transpara
| Watershed Systems, Inc
|
| Usability | Transpara
| Watershed Systems, Inc
|
| Support Rating | Transpara
| Watershed Systems, Inc
|
| Alternatives Considered | Transpara
| Watershed Systems, Inc No answers on this topic |
| Return on Investment | Transpara
| Watershed Systems, Inc
|
| ScreenShots | Watershed LRS Screenshots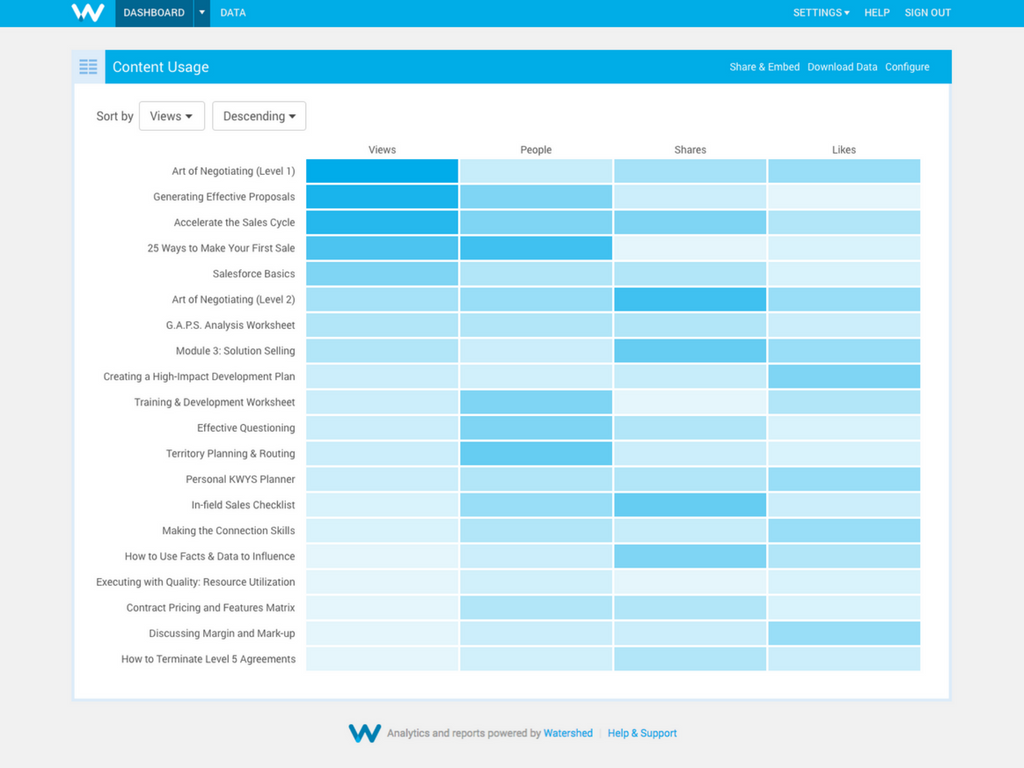   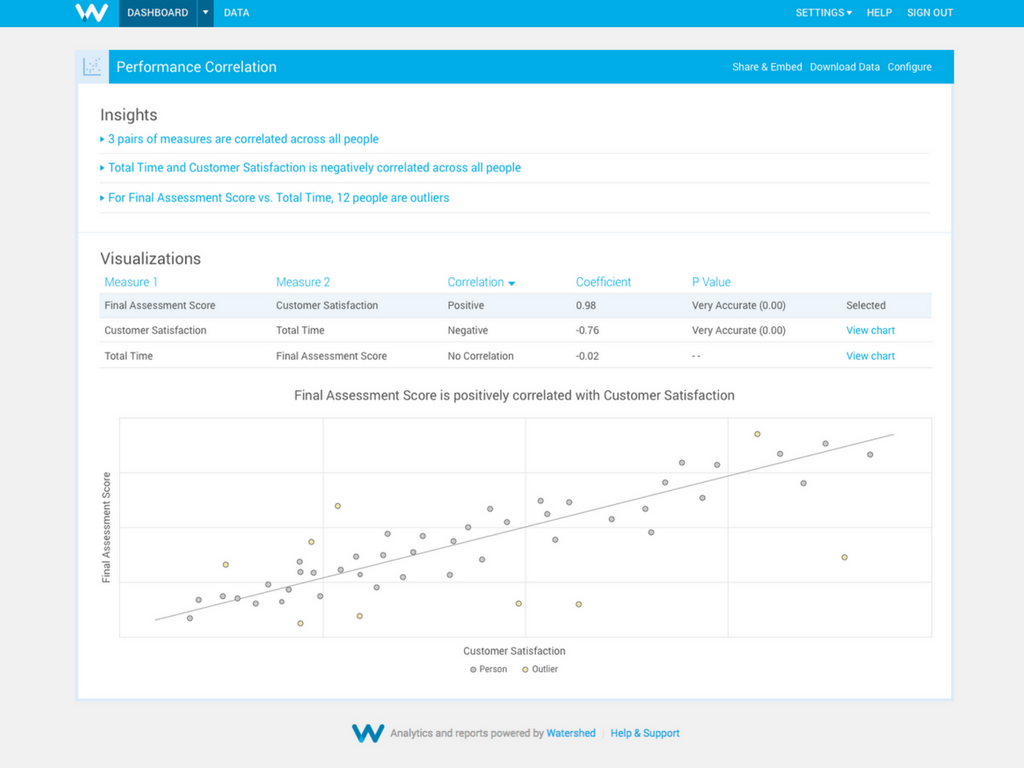  |