
Michael Moffitt
Sr. Managing Director
Chose Acumatica
Better overall value. Faster implementation cycle.
| Product | Rating | Most Used By | Product Summary | Starting Price |
|---|---|---|---|---|
 Acumatica | N/A | Acumatica delivers a set of cloud-based business software applications with dashboards, reporting tools, integrated document management, centralized security, and customization tools. | $1,000 per year | |
 Tableau Cloud | N/A | Tableau Cloud (formerly Tableau Online) is a self-service analytics platform that is fully hosted in the cloud. Tableau Cloud enables users to publish dashboards and invite colleagues to explore hidden opportunities with interactive visualizations and accurate data, from any browser or mobile device. | $15 per month per user | |
 Tableau Desktop | N/A | Tableau Desktop is a data visualization product from Tableau. It connects to a variety of data sources for combining disparate data sources without coding. It provides tools for discovering patterns and insights, data calculations, forecasts, and statistical summaries and visual storytelling. | $75 per month |
| Acumatica | Tableau Cloud | Tableau Desktop | ||||||||||||||||||||||
|---|---|---|---|---|---|---|---|---|---|---|---|---|---|---|---|---|---|---|---|---|---|---|---|---|
| Editions & Modules | No answers on this topic |
|
| |||||||||||||||||||||
| Offerings |
| |||||||||||||||||||||||
| Entry-level Setup Fee | No setup fee | No setup fee | No setup fee | |||||||||||||||||||||
| Additional Details | Pricing is always consumption-based with no five-year lock-ins or termination penalties. The Acumatica ERP pricing structure allows adding casual users, suppliers, and customers without paying for additional licenses. The cost is based on the features and resources utilized, not on the number of users who access the system. An Acumatica partner works with users to understand specific requirements, determine the proper resources and modules for the company, and presents a price for the license. | — | All pricing plans are billed annually. | |||||||||||||||||||||
| More Pricing Information | ||||||||||||||||||||||||
| Acumatica | Tableau Cloud | Tableau Desktop | |
|---|---|---|---|
| Considered Multiple Products | Acumatica Michael Moffitt Sr. Managing Director Chose Acumatica Better overall value. Faster implementation cycle. | Tableau Cloud  Lance Smith Business Intelligence Analyst Chose Tableau Cloud I feel like Tableau is easier to use compared with the SAP Business Objects. Both have a bit of a learning curve but I felt that Tableau Online was still more intuitive and user friendly. Tableau Desktop is a powerhouse. It has a very steep learning curve but once you master …  Keith Boyce Senior Applications Specialist Chose Tableau Cloud Sisense offers a powerful backend database, Elasticube that integrates well with Web Service data sources. Tableau enables better visualization flexibility and functionality without having to write javascript.  Phil Dana, PMOC Business Development Director, Global Government Customer Solutions Chose Tableau Cloud Birst seems very good at getting data aggregated into the tool (ETL), but weaker at the front end visualizations. |  Tableau Desktop  Tohidul Islam Information Technology Team Lead Chose Tableau Desktop With Tableau Desktop, it's easy to create a report in the
context quickly. It allows for the seamless management of the data sources,
which is convenient for the data users. Because it is simple to use, it is  Abanish Mishra Business Intelligence Analyst Chose Tableau Desktop My current work environment uses both Tableau Online, MicroStrategy & SSRS in parallel. Tableau is much closer to the SSRS in terms of visualization tool where as MicroStrategy is an enterprise data modeling and reporting tool. Based on the use case we use different tools. Here …  Tom Bertolino Product Development Chose Tableau Desktop |
| Acumatica | Tableau Cloud | Tableau Desktop | |||||||||||||||||||||||||||||||
|---|---|---|---|---|---|---|---|---|---|---|---|---|---|---|---|---|---|---|---|---|---|---|---|---|---|---|---|---|---|---|---|---|---|
| Payroll Management |
| ||||||||||||||||||||||||||||||||
| Customization |
| ||||||||||||||||||||||||||||||||
| Security |
| ||||||||||||||||||||||||||||||||
| Reporting & Analytics |
| ||||||||||||||||||||||||||||||||
| General Ledger and Configurable Accounting |
| ||||||||||||||||||||||||||||||||
| Inventory Management |
| ||||||||||||||||||||||||||||||||
| Order Management |
| ||||||||||||||||||||||||||||||||
| Subledger and Financial Process |
| ||||||||||||||||||||||||||||||||
| Project Financial Management |
| ||||||||||||||||||||||||||||||||
| Project Execution Management |
| ||||||||||||||||||||||||||||||||
| Grants Management |
| ||||||||||||||||||||||||||||||||
| Procurement |
| ||||||||||||||||||||||||||||||||
| Risk Management |
| ||||||||||||||||||||||||||||||||
| Logistics |
| ||||||||||||||||||||||||||||||||
| Manufacturing |
| ||||||||||||||||||||||||||||||||
| Supply Chain |
| ||||||||||||||||||||||||||||||||
| Product Lifecycle Management |
| ||||||||||||||||||||||||||||||||
| BI Standard Reporting |
| ||||||||||||||||||||||||||||||||
| Ad-hoc Reporting |
| ||||||||||||||||||||||||||||||||
| Report Output and Scheduling |
| ||||||||||||||||||||||||||||||||
| Data Discovery and Visualization |
| ||||||||||||||||||||||||||||||||
| Access Control and Security |
| ||||||||||||||||||||||||||||||||
| Mobile Capabilities |
| ||||||||||||||||||||||||||||||||
| Application Program Interfaces (APIs) / Embedding |
|
| Acumatica | Tableau Cloud | Tableau Desktop | |
|---|---|---|---|
| Small Businesses |  Zoho One Score 9.3 out of 10 |  Yellowfin Score 8.7 out of 10 | Yellowfin Score 8.7 out of 10 |
| Medium-sized Companies |  Infor VISUAL Score 7.4 out of 10 |  Reveal Score 10.0 out of 10 | Reveal Score 10.0 out of 10 |
| Enterprises |  24SevenOffice Score 9.0 out of 10 |  Kyvos Semantic Layer Score 9.5 out of 10 | Kyvos Semantic Layer Score 9.5 out of 10 |
| All Alternatives | View all alternatives | View all alternatives | View all alternatives |
| Acumatica | Tableau Cloud | Tableau Desktop | |
|---|---|---|---|
| Likelihood to Recommend | 8.9 (631 ratings) | 9.3 (75 ratings) | 8.8 (203 ratings) |
| Likelihood to Renew | 9.2 (65 ratings) | - (0 ratings) | 7.5 (41 ratings) |
| Usability | 8.2 (37 ratings) | 8.7 (28 ratings) | 8.3 (73 ratings) |
| Availability | 8.7 (5 ratings) | - (0 ratings) | 10.0 (11 ratings) |
| Performance | 8.2 (4 ratings) | - (0 ratings) | 8.0 (10 ratings) |
| Support Rating | 7.1 (28 ratings) | 8.7 (20 ratings) | 1.0 (57 ratings) |
| In-Person Training | 4.9 (5 ratings) | - (0 ratings) | 9.4 (4 ratings) |
| Online Training | 7.7 (4 ratings) | - (0 ratings) | 8.0 (5 ratings) |
| Implementation Rating | 6.0 (19 ratings) | - (0 ratings) | 8.0 (34 ratings) |
| Configurability | 6.5 (3 ratings) | - (0 ratings) | 7.0 (3 ratings) |
| Contract Terms and Pricing Model | 6.3 (4 ratings) | - (0 ratings) | - (0 ratings) |
| Ease of integration | 5.6 (2 ratings) | - (0 ratings) | 10.0 (1 ratings) |
| Product Scalability | 7.3 (5 ratings) | - (0 ratings) | 9.0 (4 ratings) |
| Professional Services | 9.1 (3 ratings) | - (0 ratings) | - (0 ratings) |
| Vendor post-sale | 4.1 (5 ratings) | - (0 ratings) | 10.0 (1 ratings) |
| Vendor pre-sale | 5.1 (4 ratings) | - (0 ratings) | 10.0 (1 ratings) |
| Acumatica | Tableau Cloud | Tableau Desktop | |
|---|---|---|---|
| Likelihood to Recommend | Acumatica
| Tableau
| Tableau
 Karol Kozłowski Project manager |
| Pros | Acumatica
 Hardik Thacker Financial research analyst | Tableau
 Raman Ahuja Associate Consultant | Tableau
 Afia Tamanna Information Technology Business Consultant |
| Cons | Acumatica
| Tableau
| Tableau
|
| Likelihood to Renew | Acumatica
| Tableau No answers on this topic | Tableau
|
| Usability | Acumatica
| Tableau
| Tableau
 Al Mubassir Muin Software Engineer |
| Reliability and Availability | Acumatica
 DANYEL SULLIVAN-MARRERO, CPA, MBA Controller | Tableau No answers on this topic | Tableau
 Brad Llewellyn Associate Data Analytics Consultant |
| Performance | Acumatica
| Tableau No answers on this topic | Tableau
|
| Support Rating | Acumatica
| Tableau
| Tableau
|
| In-Person Training | Acumatica
| Tableau No answers on this topic | Tableau
 Jon Boeckenstedt Associate Vice President |
| Online Training | Acumatica
 Julie Weber Director of Finance & Accounting | Tableau No answers on this topic | Tableau
|
| Implementation Rating | Acumatica
 Scott Rutkowski, CLP CIO (Chief Information Officer) | Tableau No answers on this topic | Tableau
 David Fickes Decision Sciences - Modeling, Simulation & Analysis |
| Alternatives Considered | Acumatica
| Tableau
| Tableau
|
| Contract Terms and Pricing Model | Acumatica
DANYEL SULLIVAN-MARRERO, CPA, MBA Controller | Tableau No answers on this topic | Tableau No answers on this topic |
| Scalability | Acumatica
DANYEL SULLIVAN-MARRERO, CPA, MBA Controller | Tableau No answers on this topic | Tableau
|
| Professional Services | Acumatica
DANYEL SULLIVAN-MARRERO, CPA, MBA Controller | Tableau No answers on this topic | Tableau No answers on this topic |
| Return on Investment | Acumatica
| Tableau
 Tom Laughlin Senior Customer Success Manager | Tableau
|
| ScreenShots | Acumatica Screenshots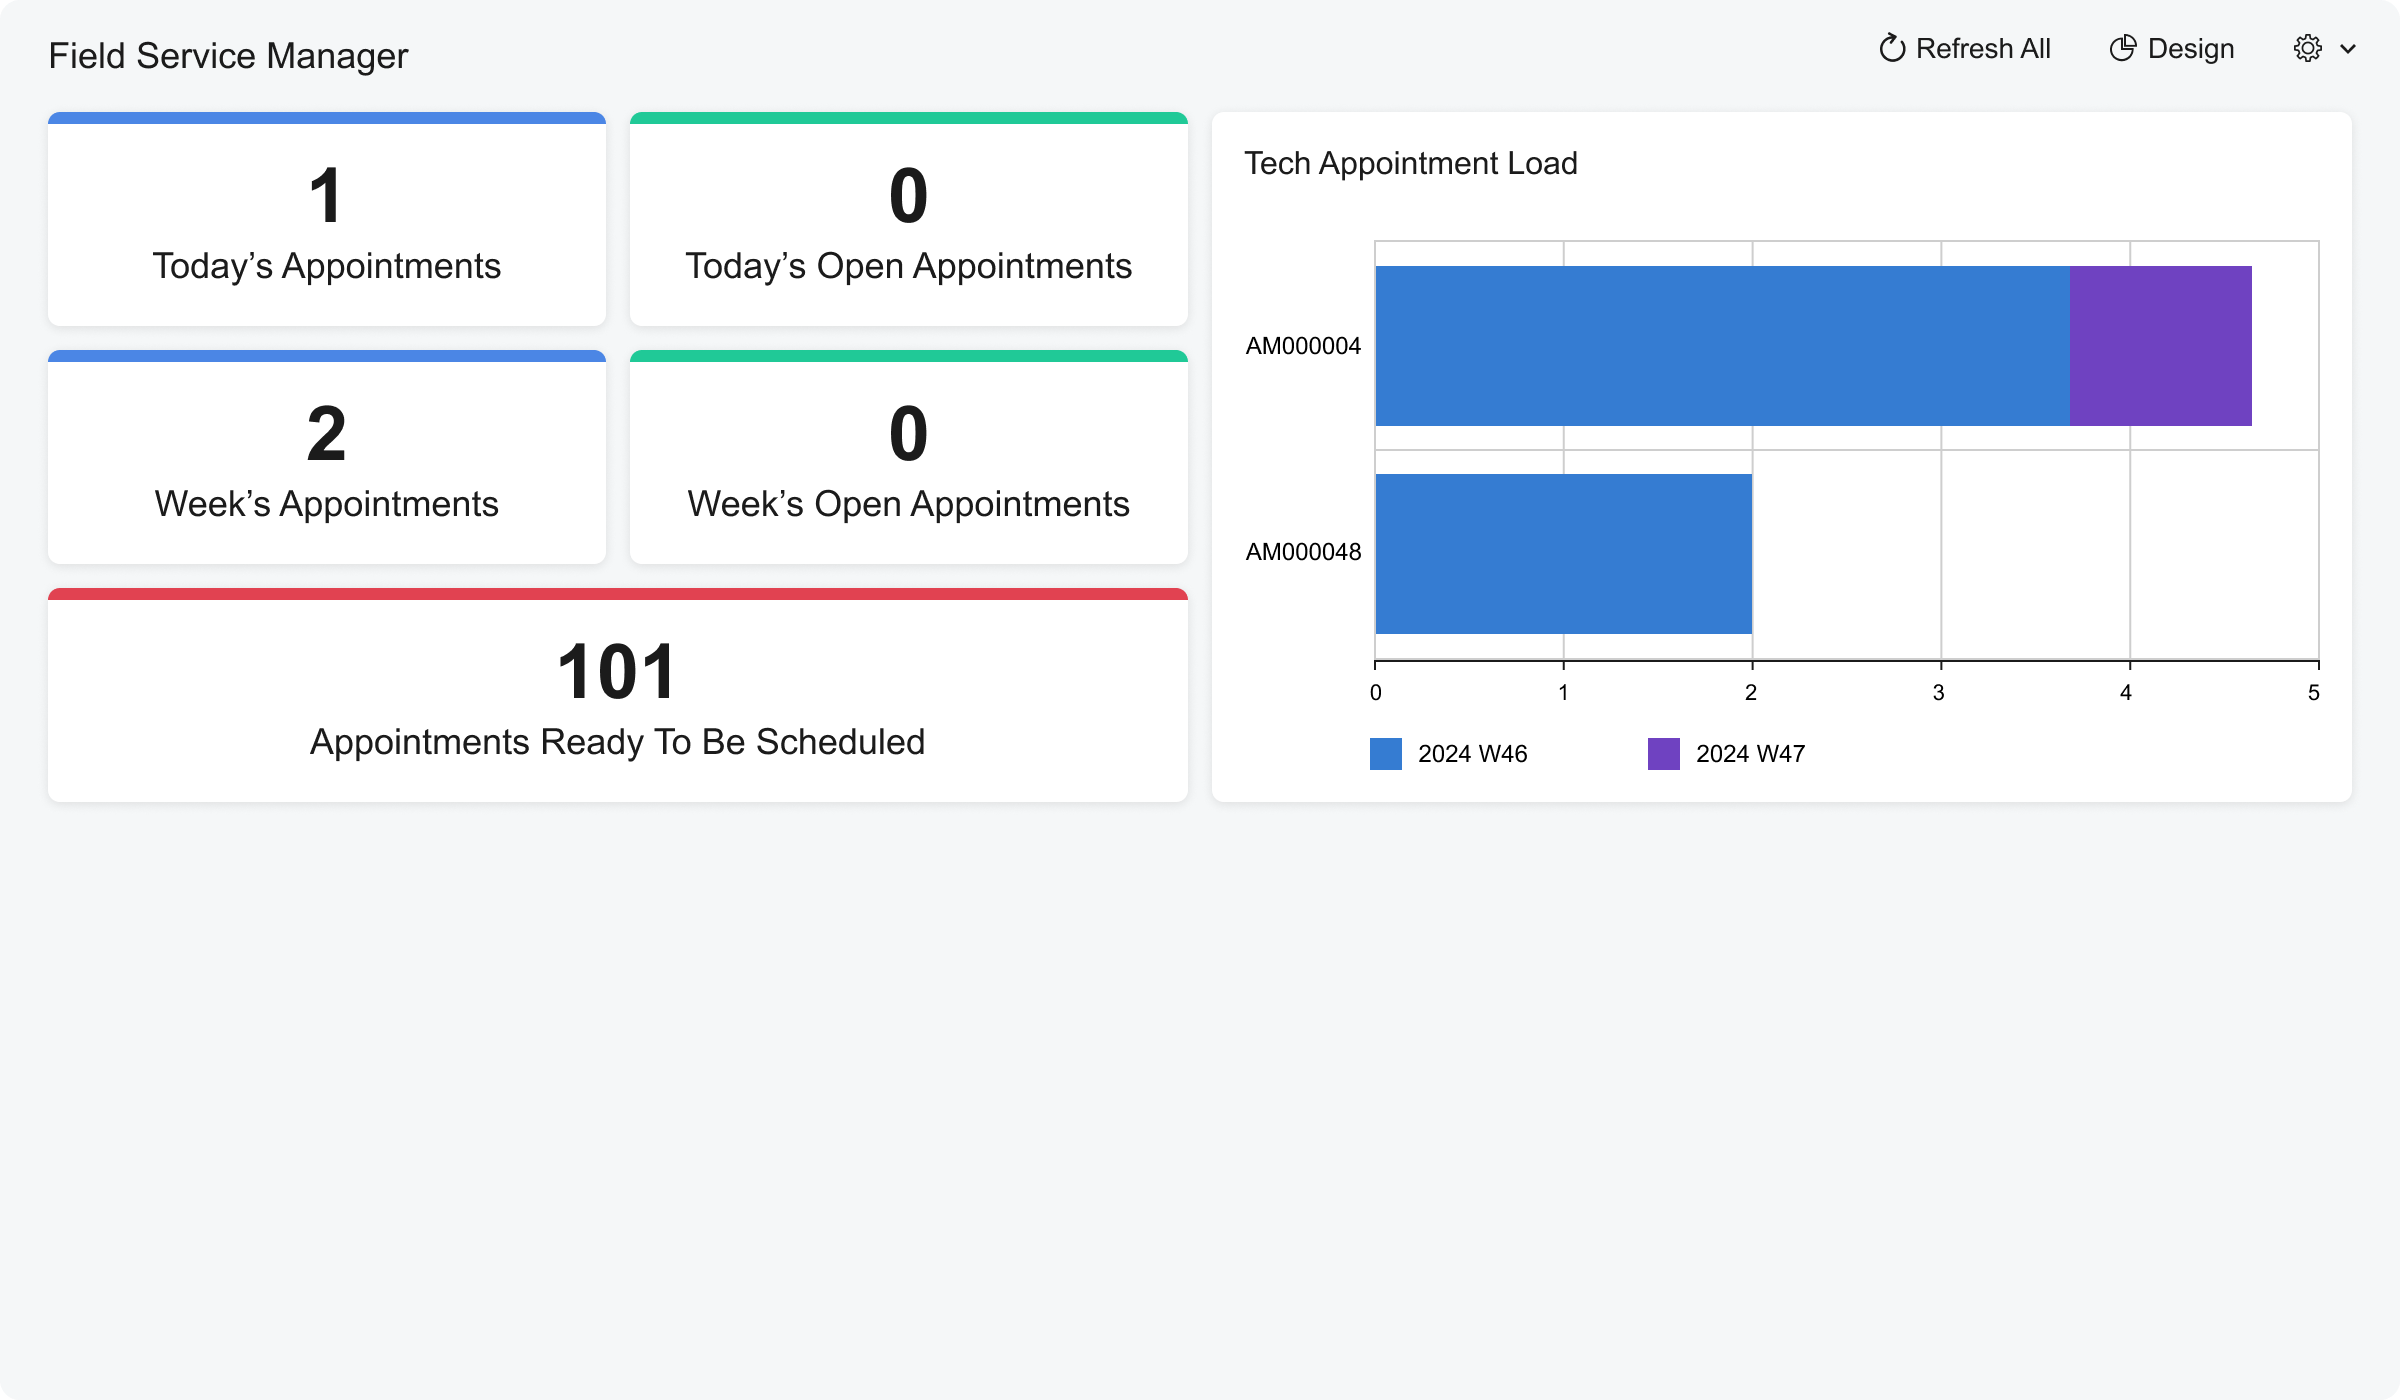 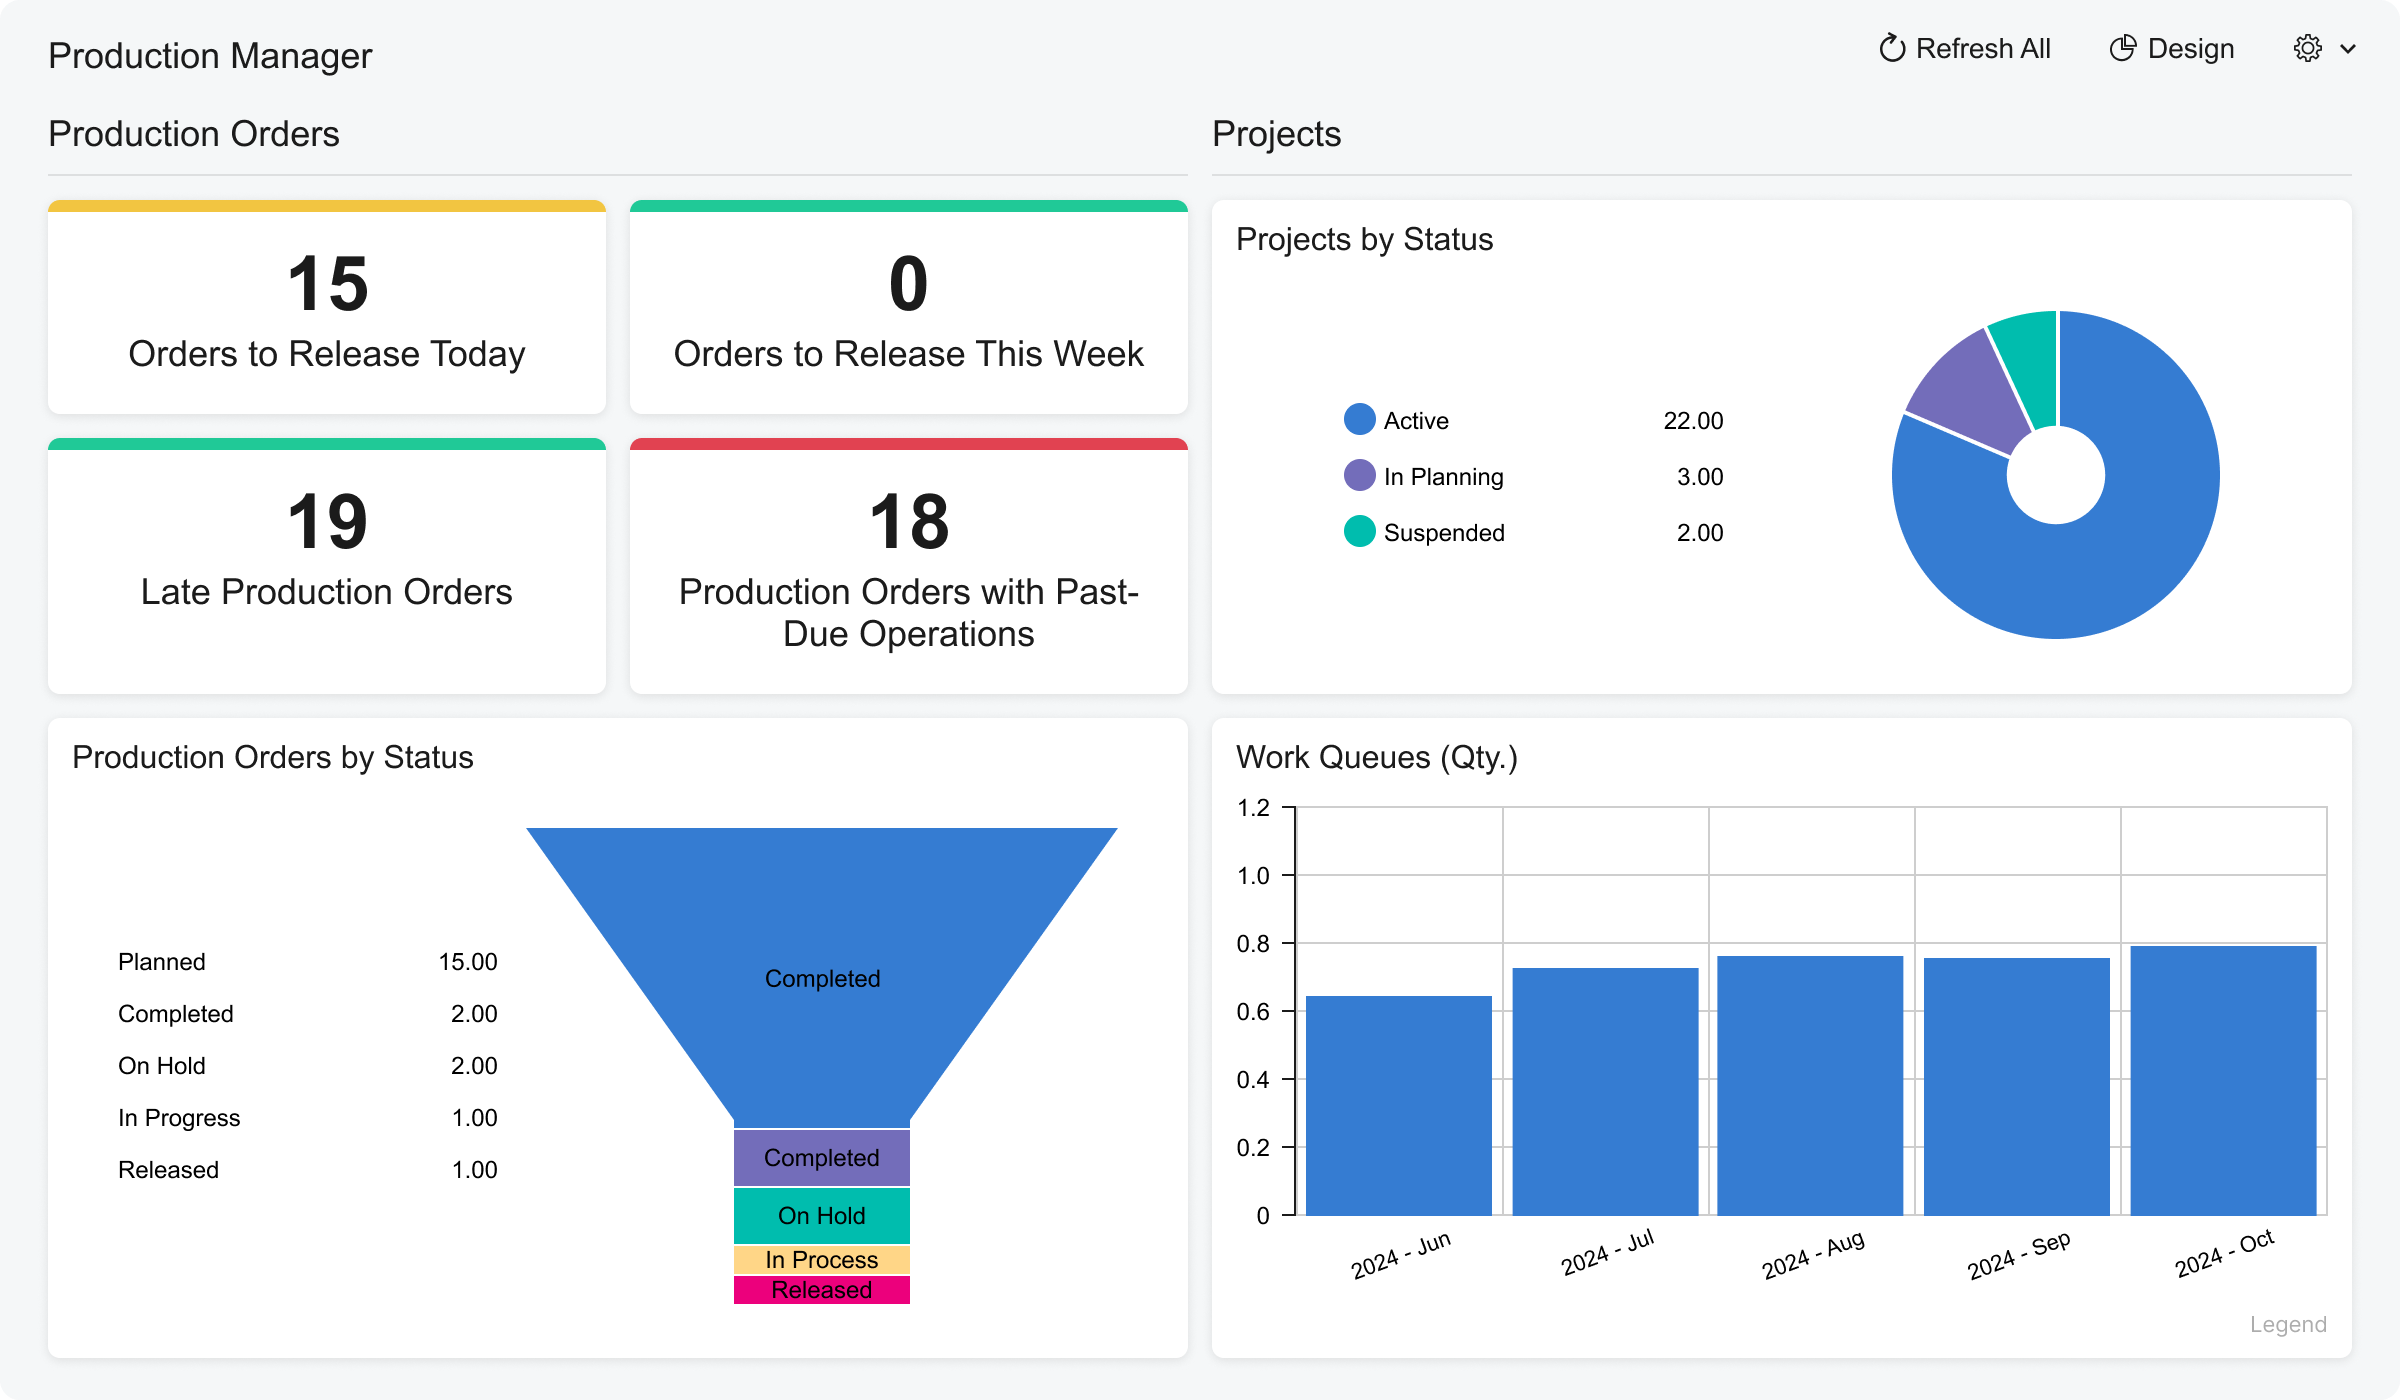 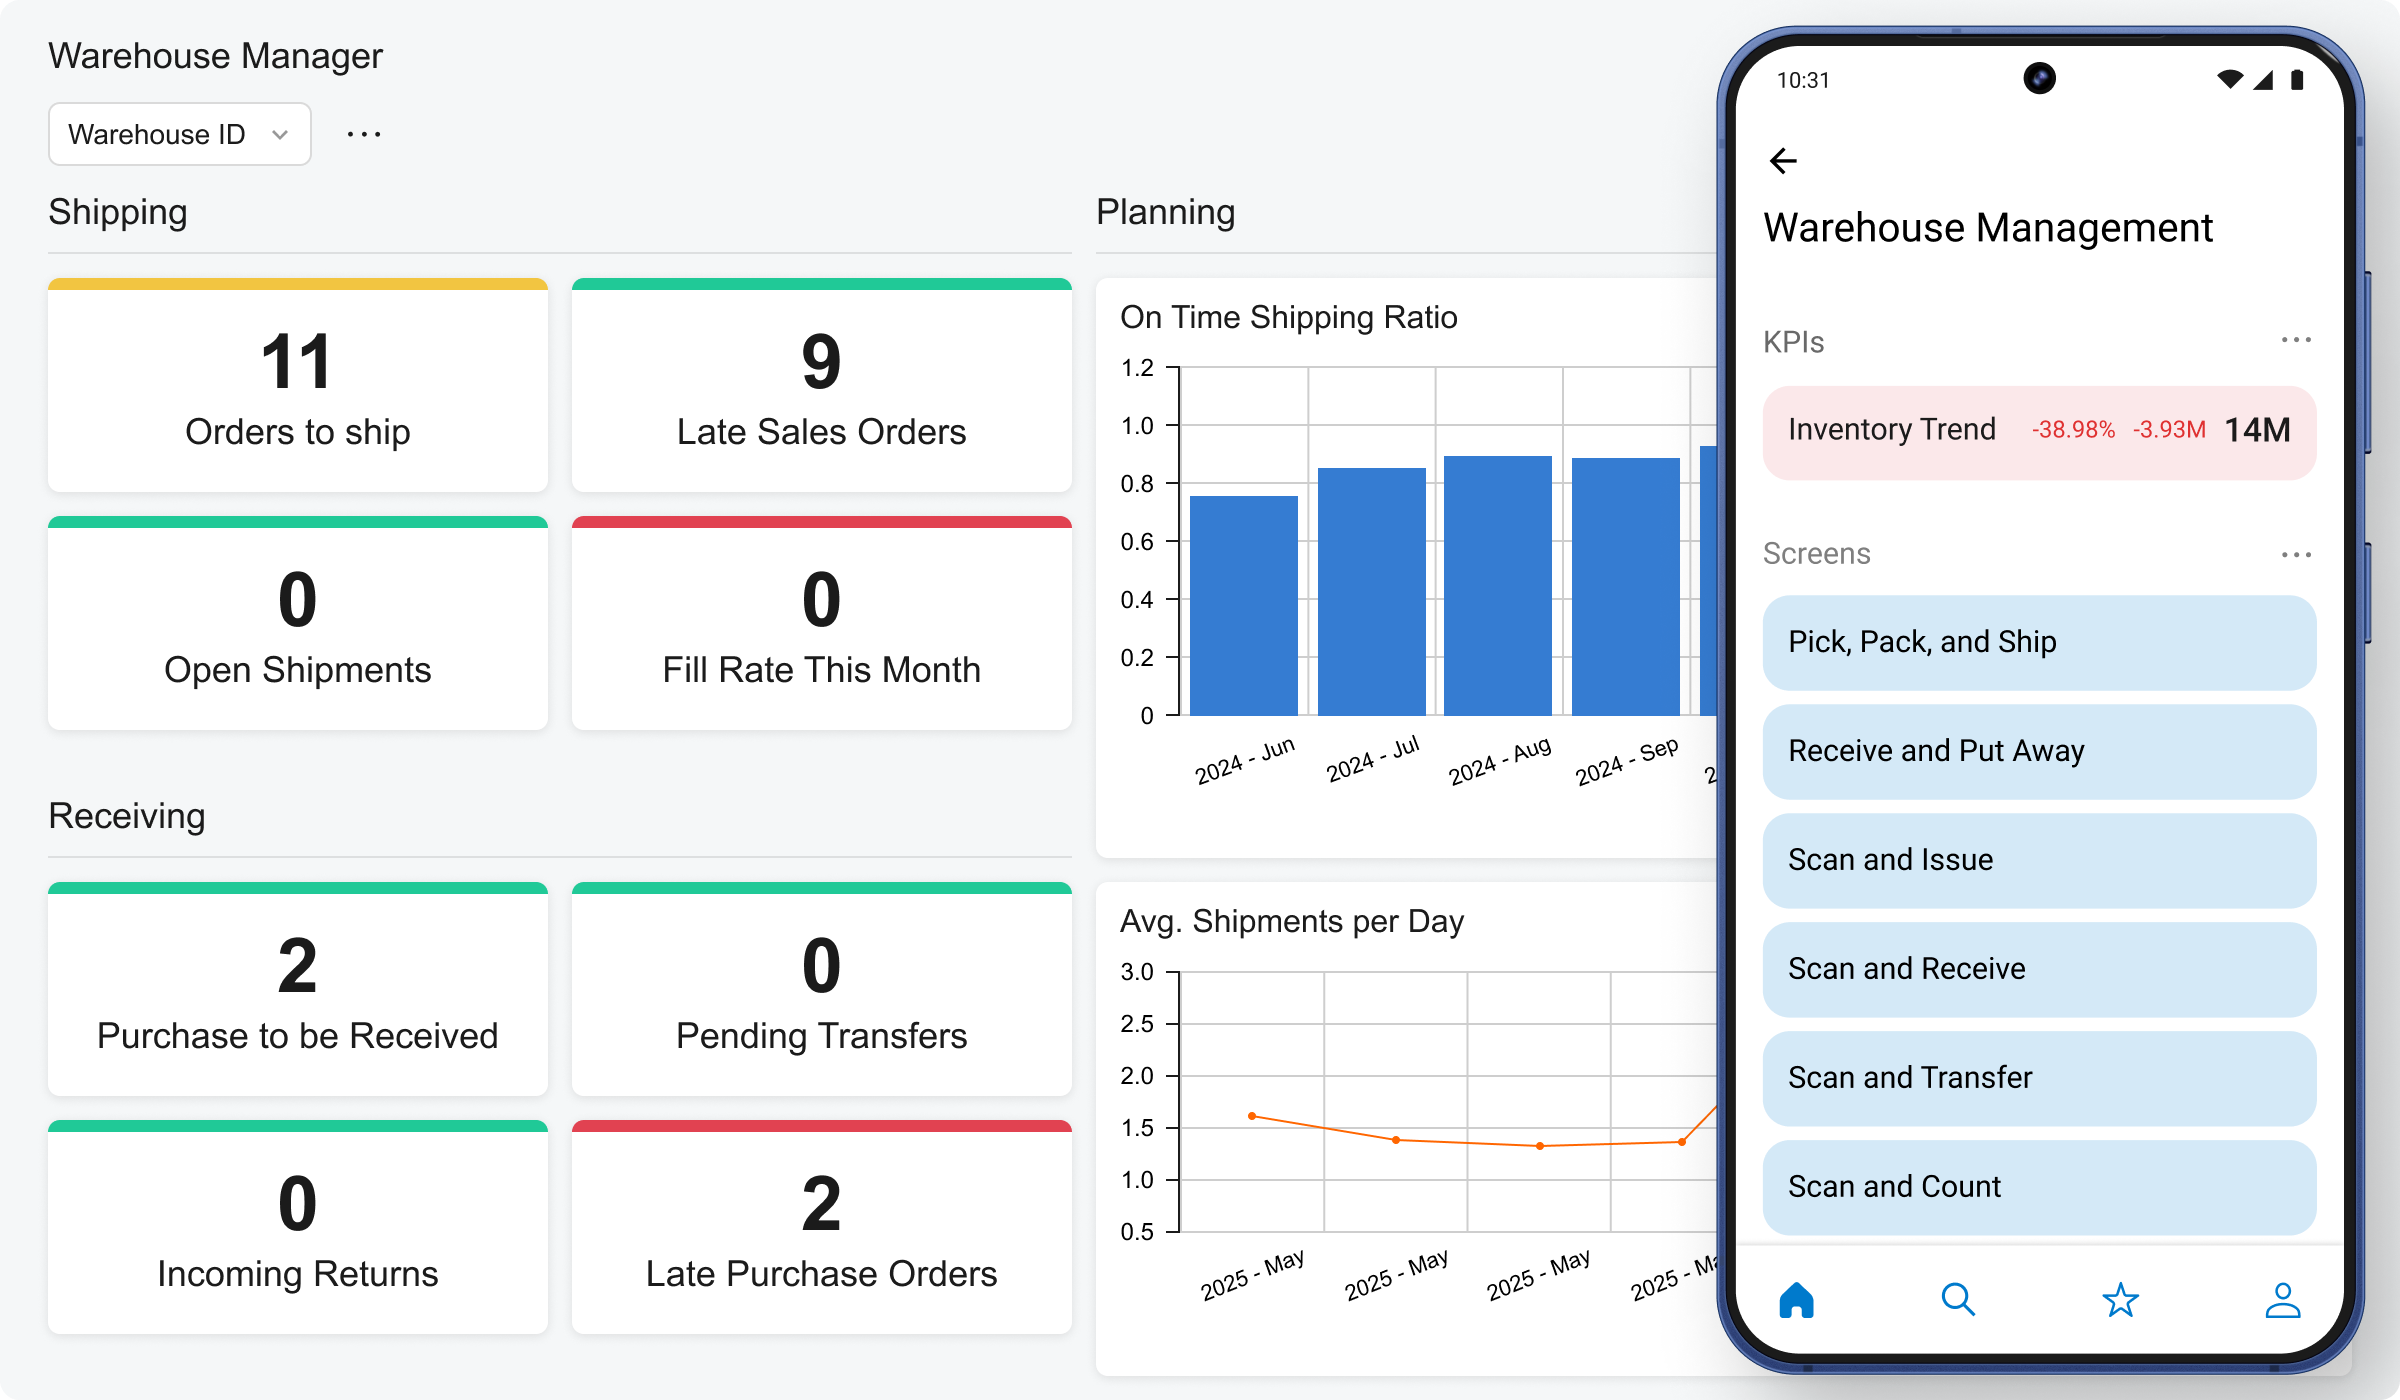 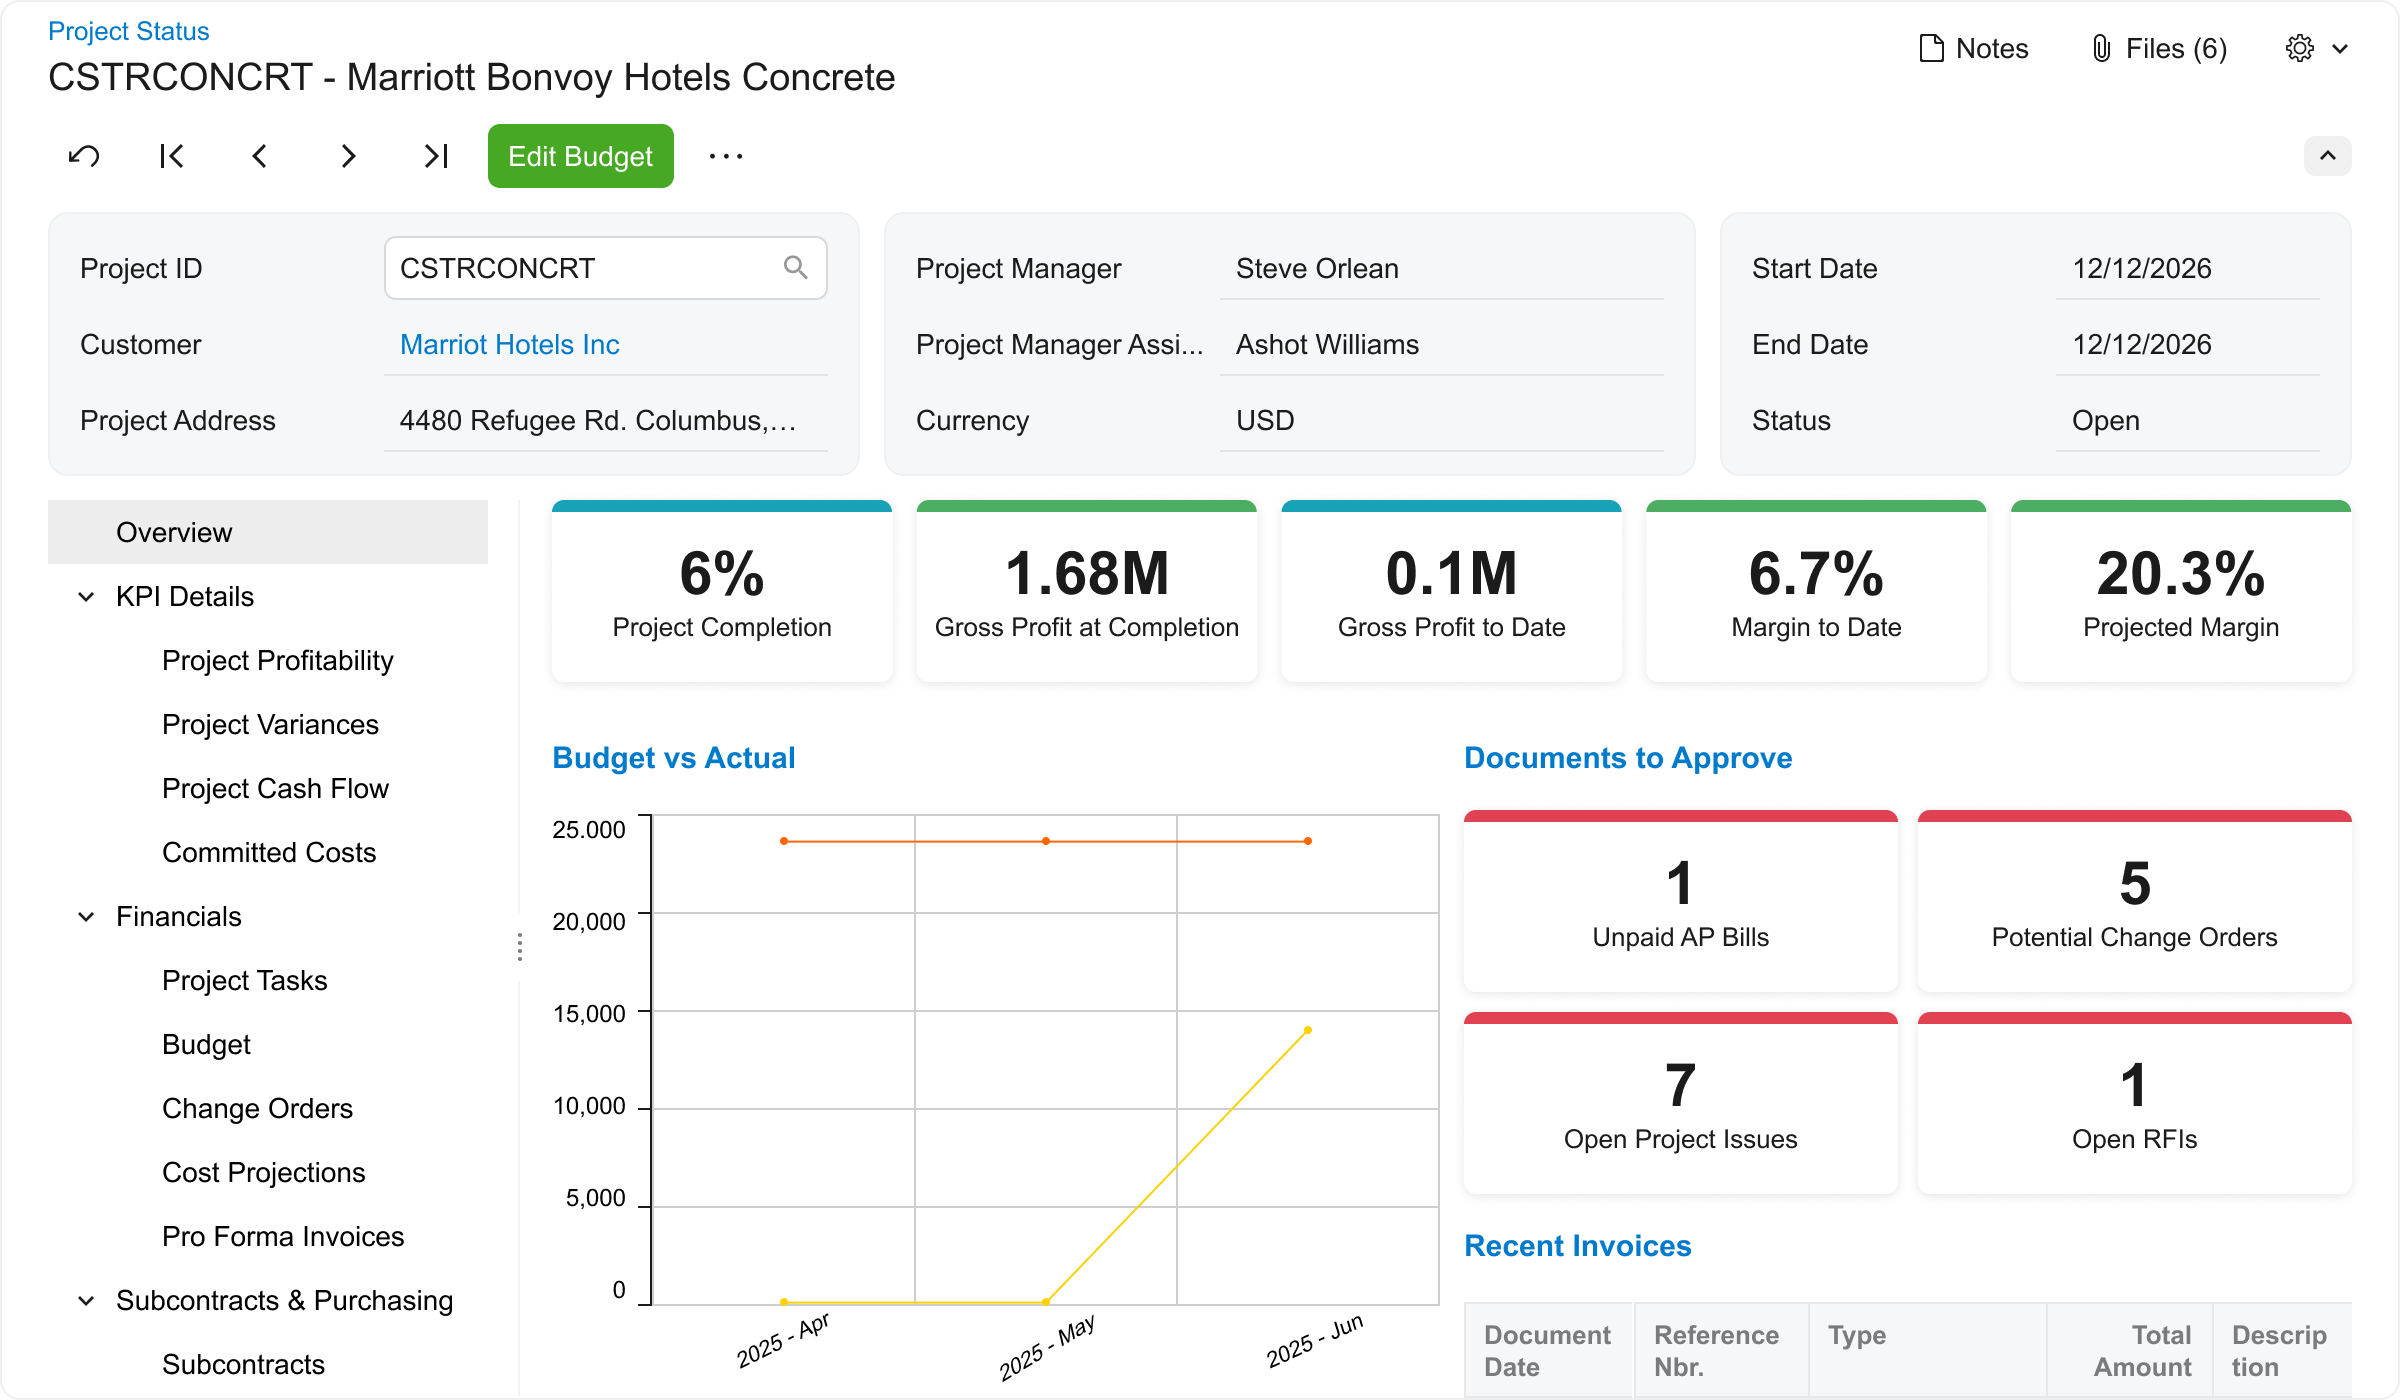 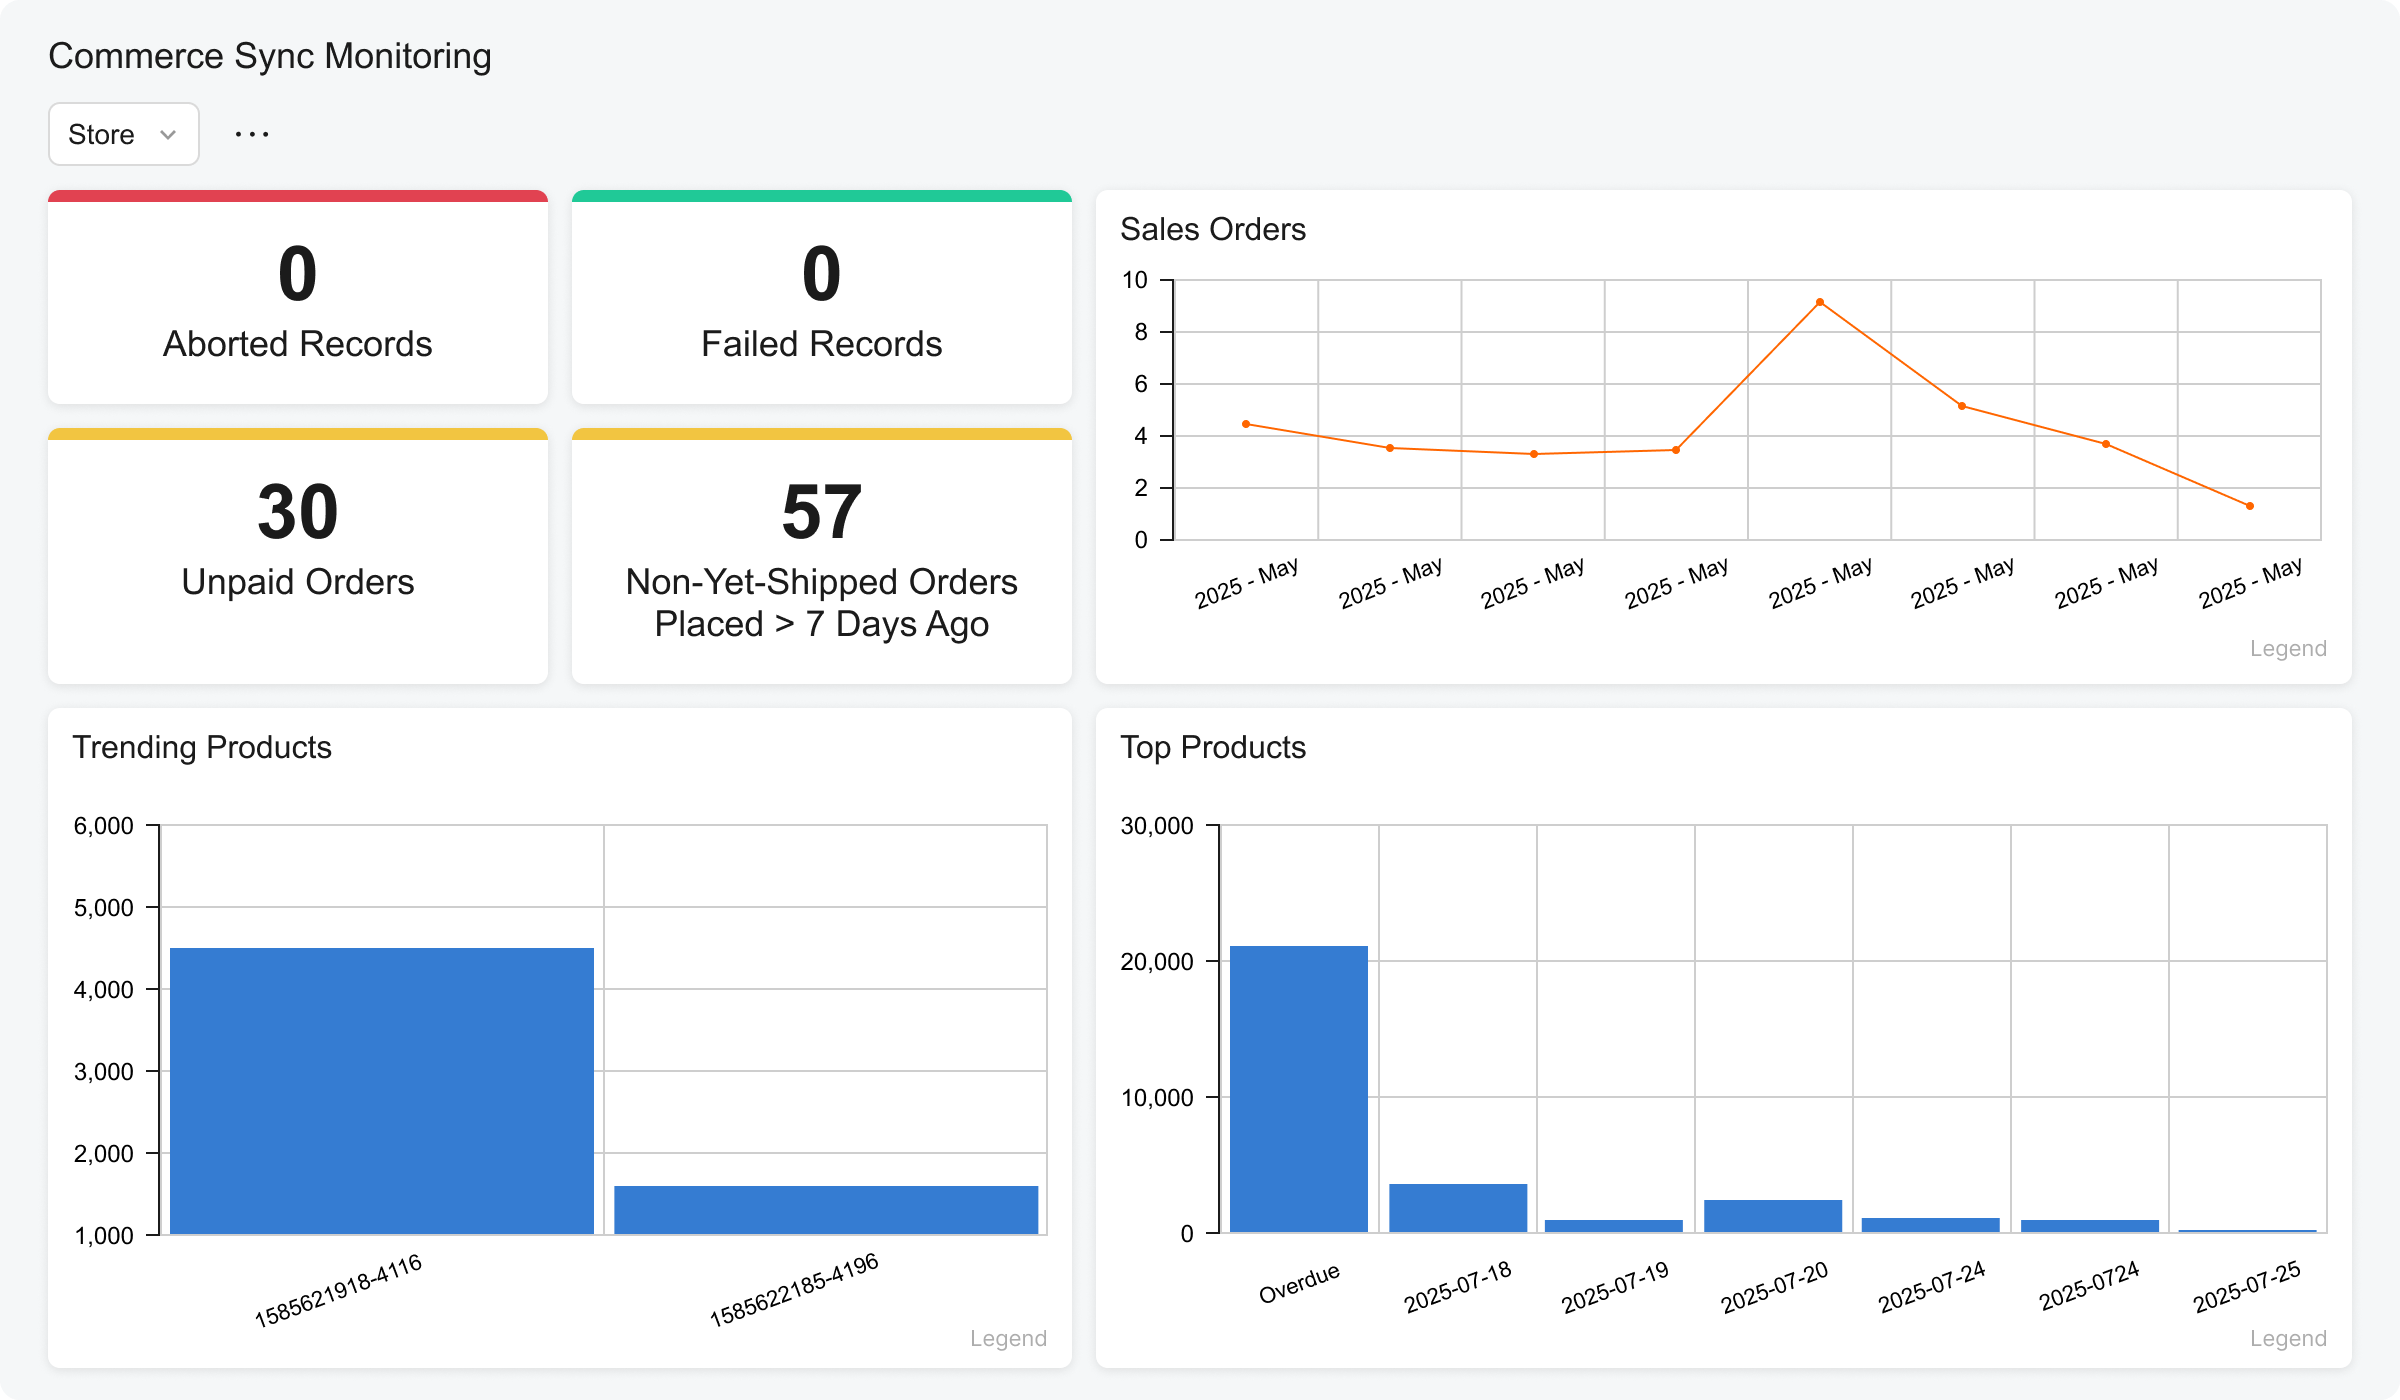 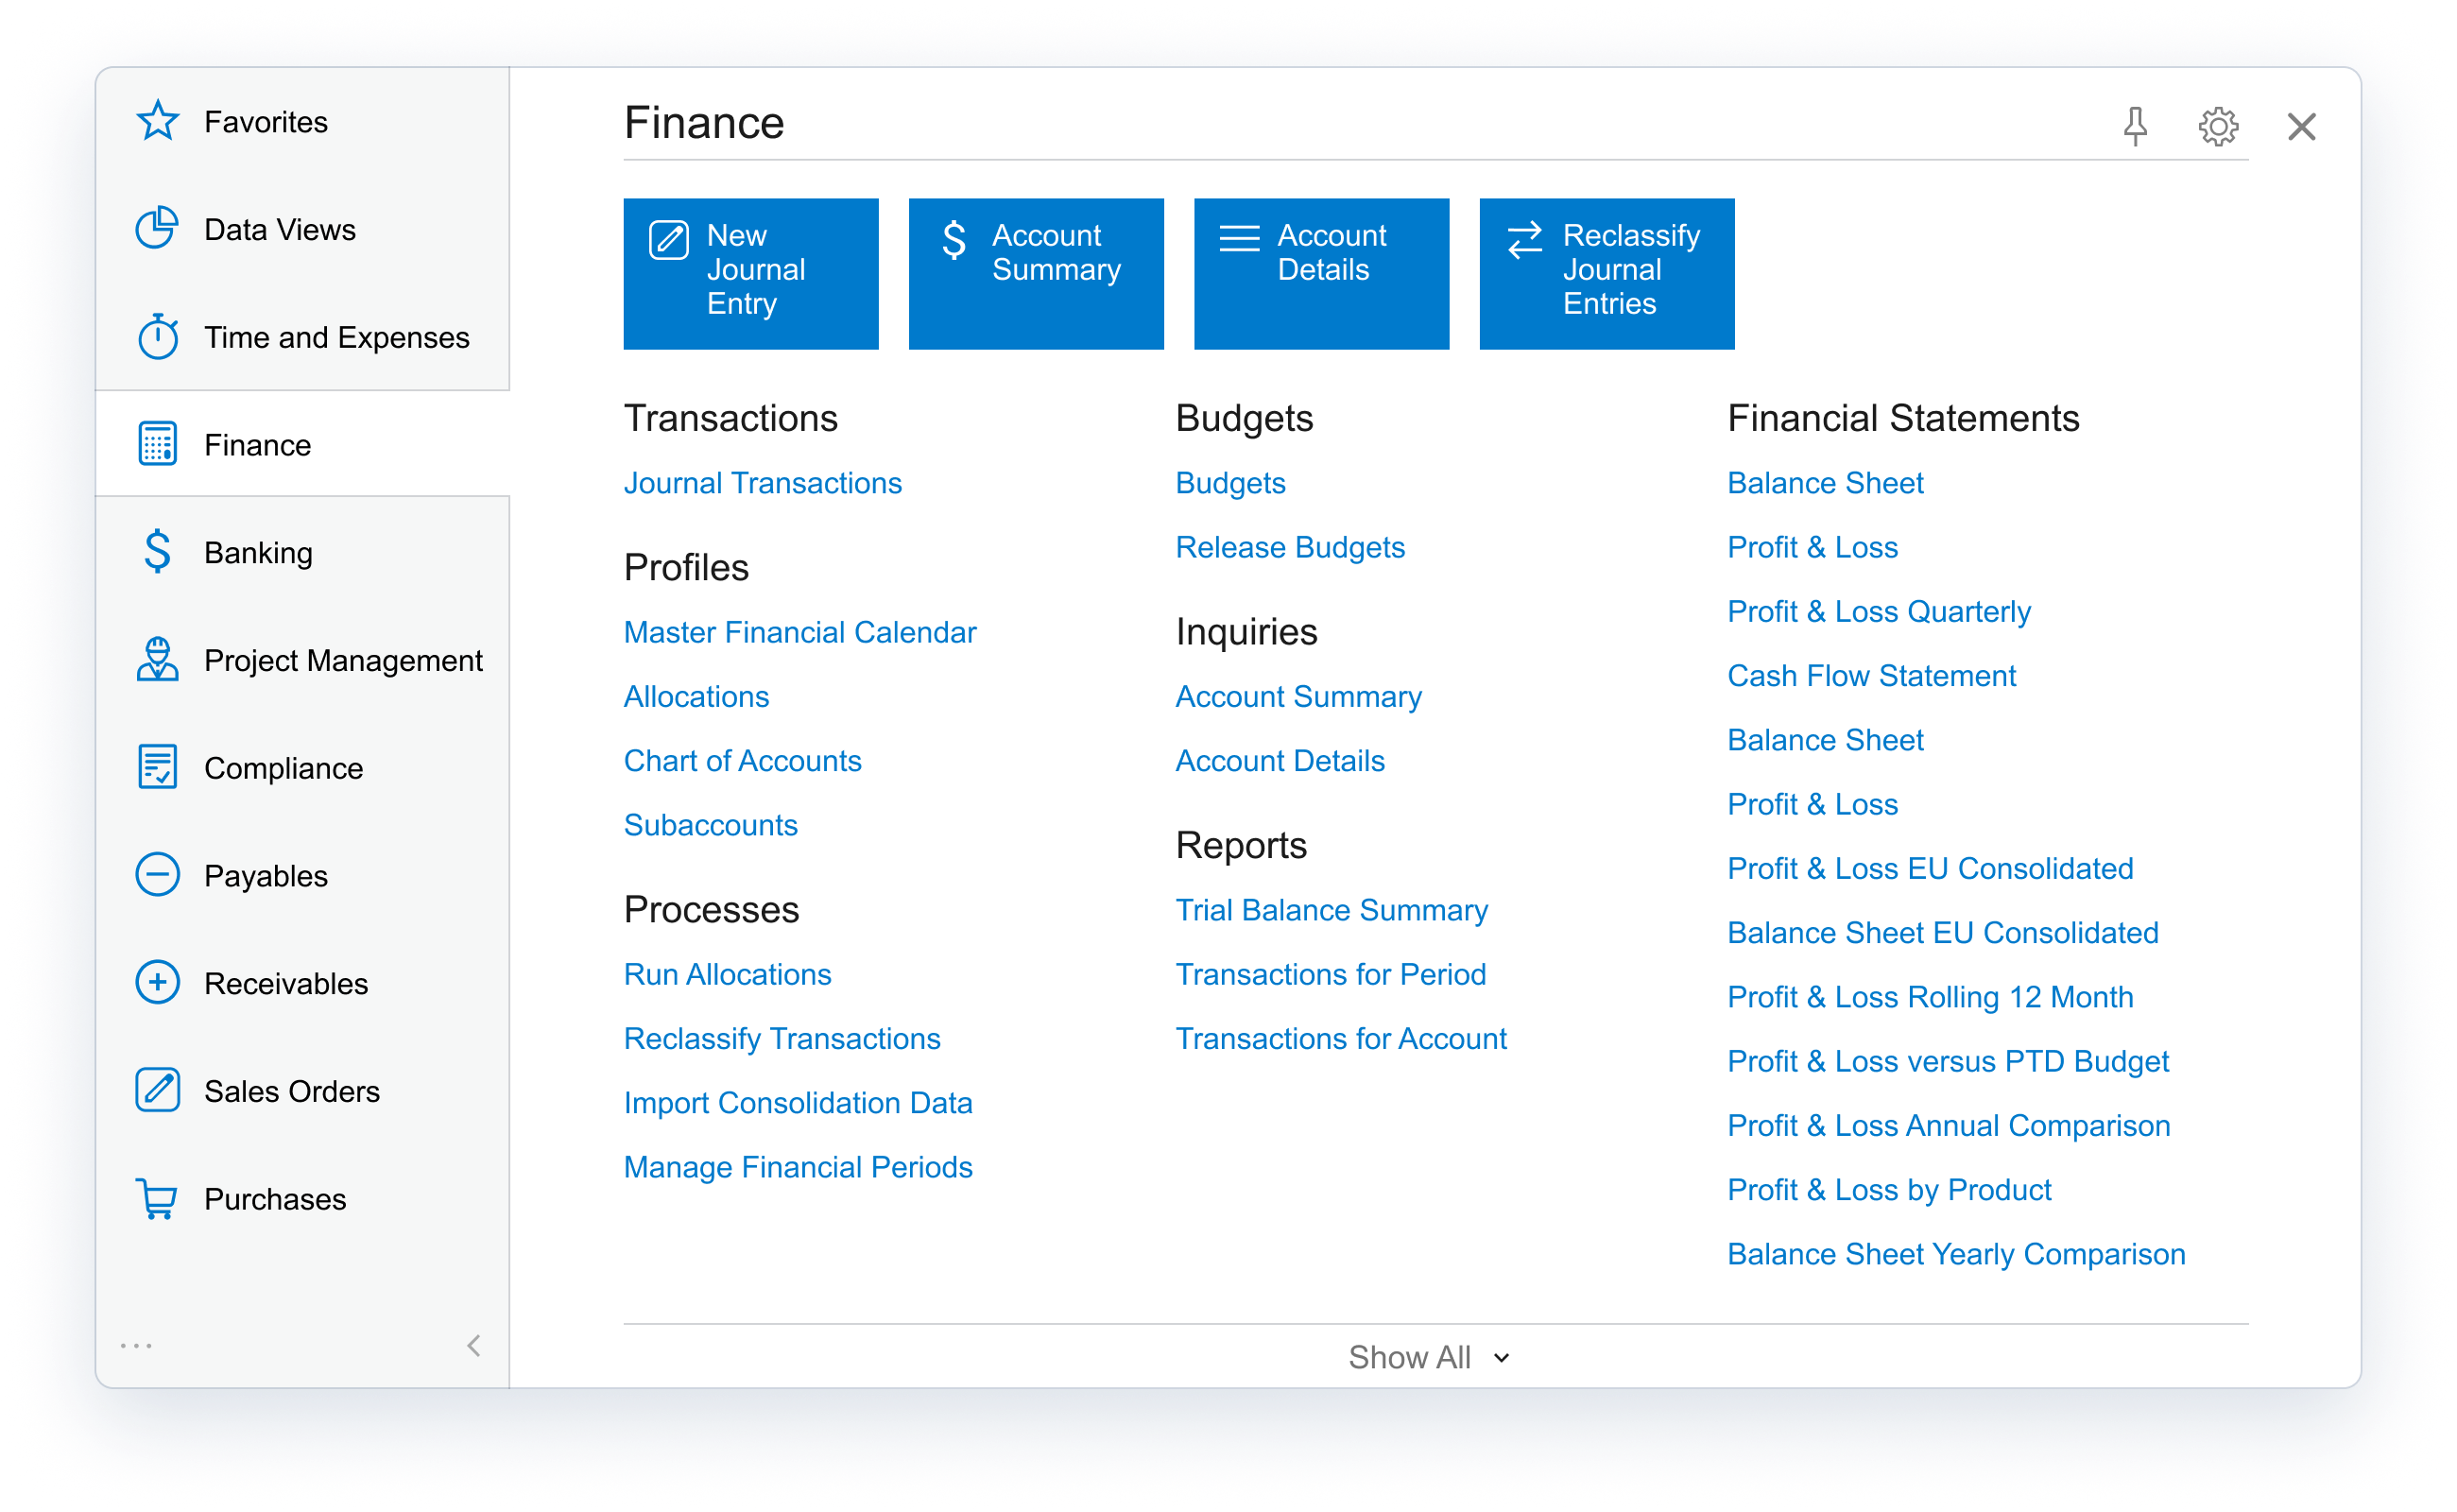 |