Datadog is a monitoring service for IT, Dev and Ops teams who write and run applications at scale, and want to turn the massive amounts of data produced by their apps, tools and services into actionable insight.
$18
per month per host
IBM SevOne
Score 8.2 out of 10
N/A
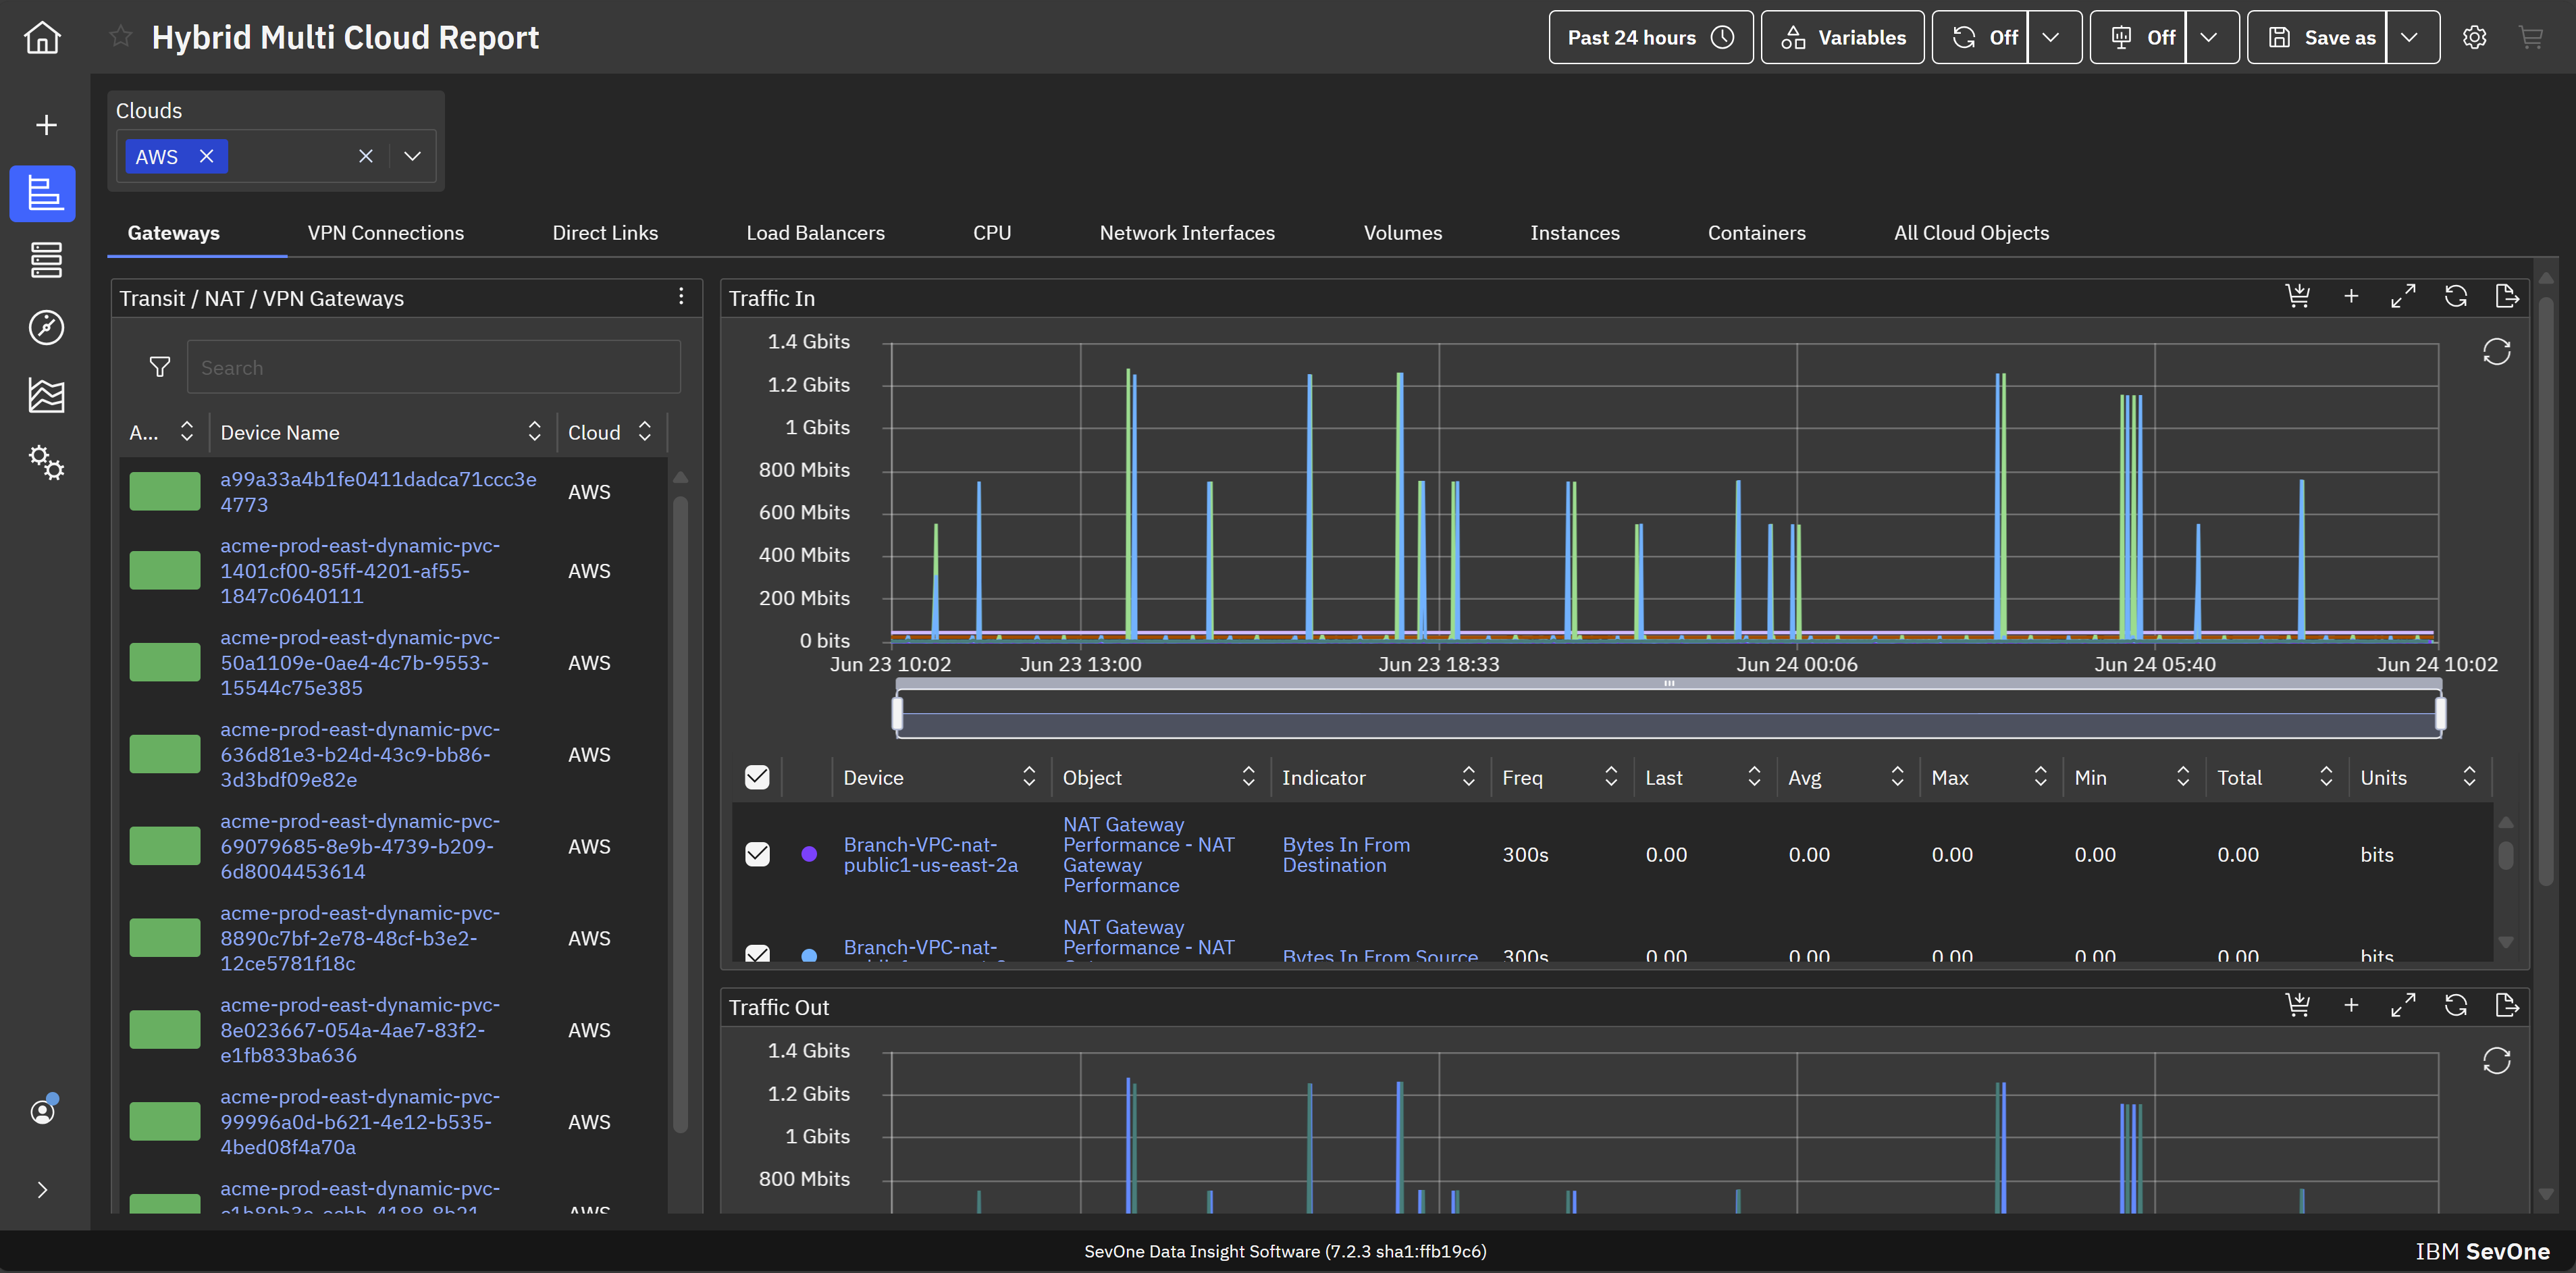
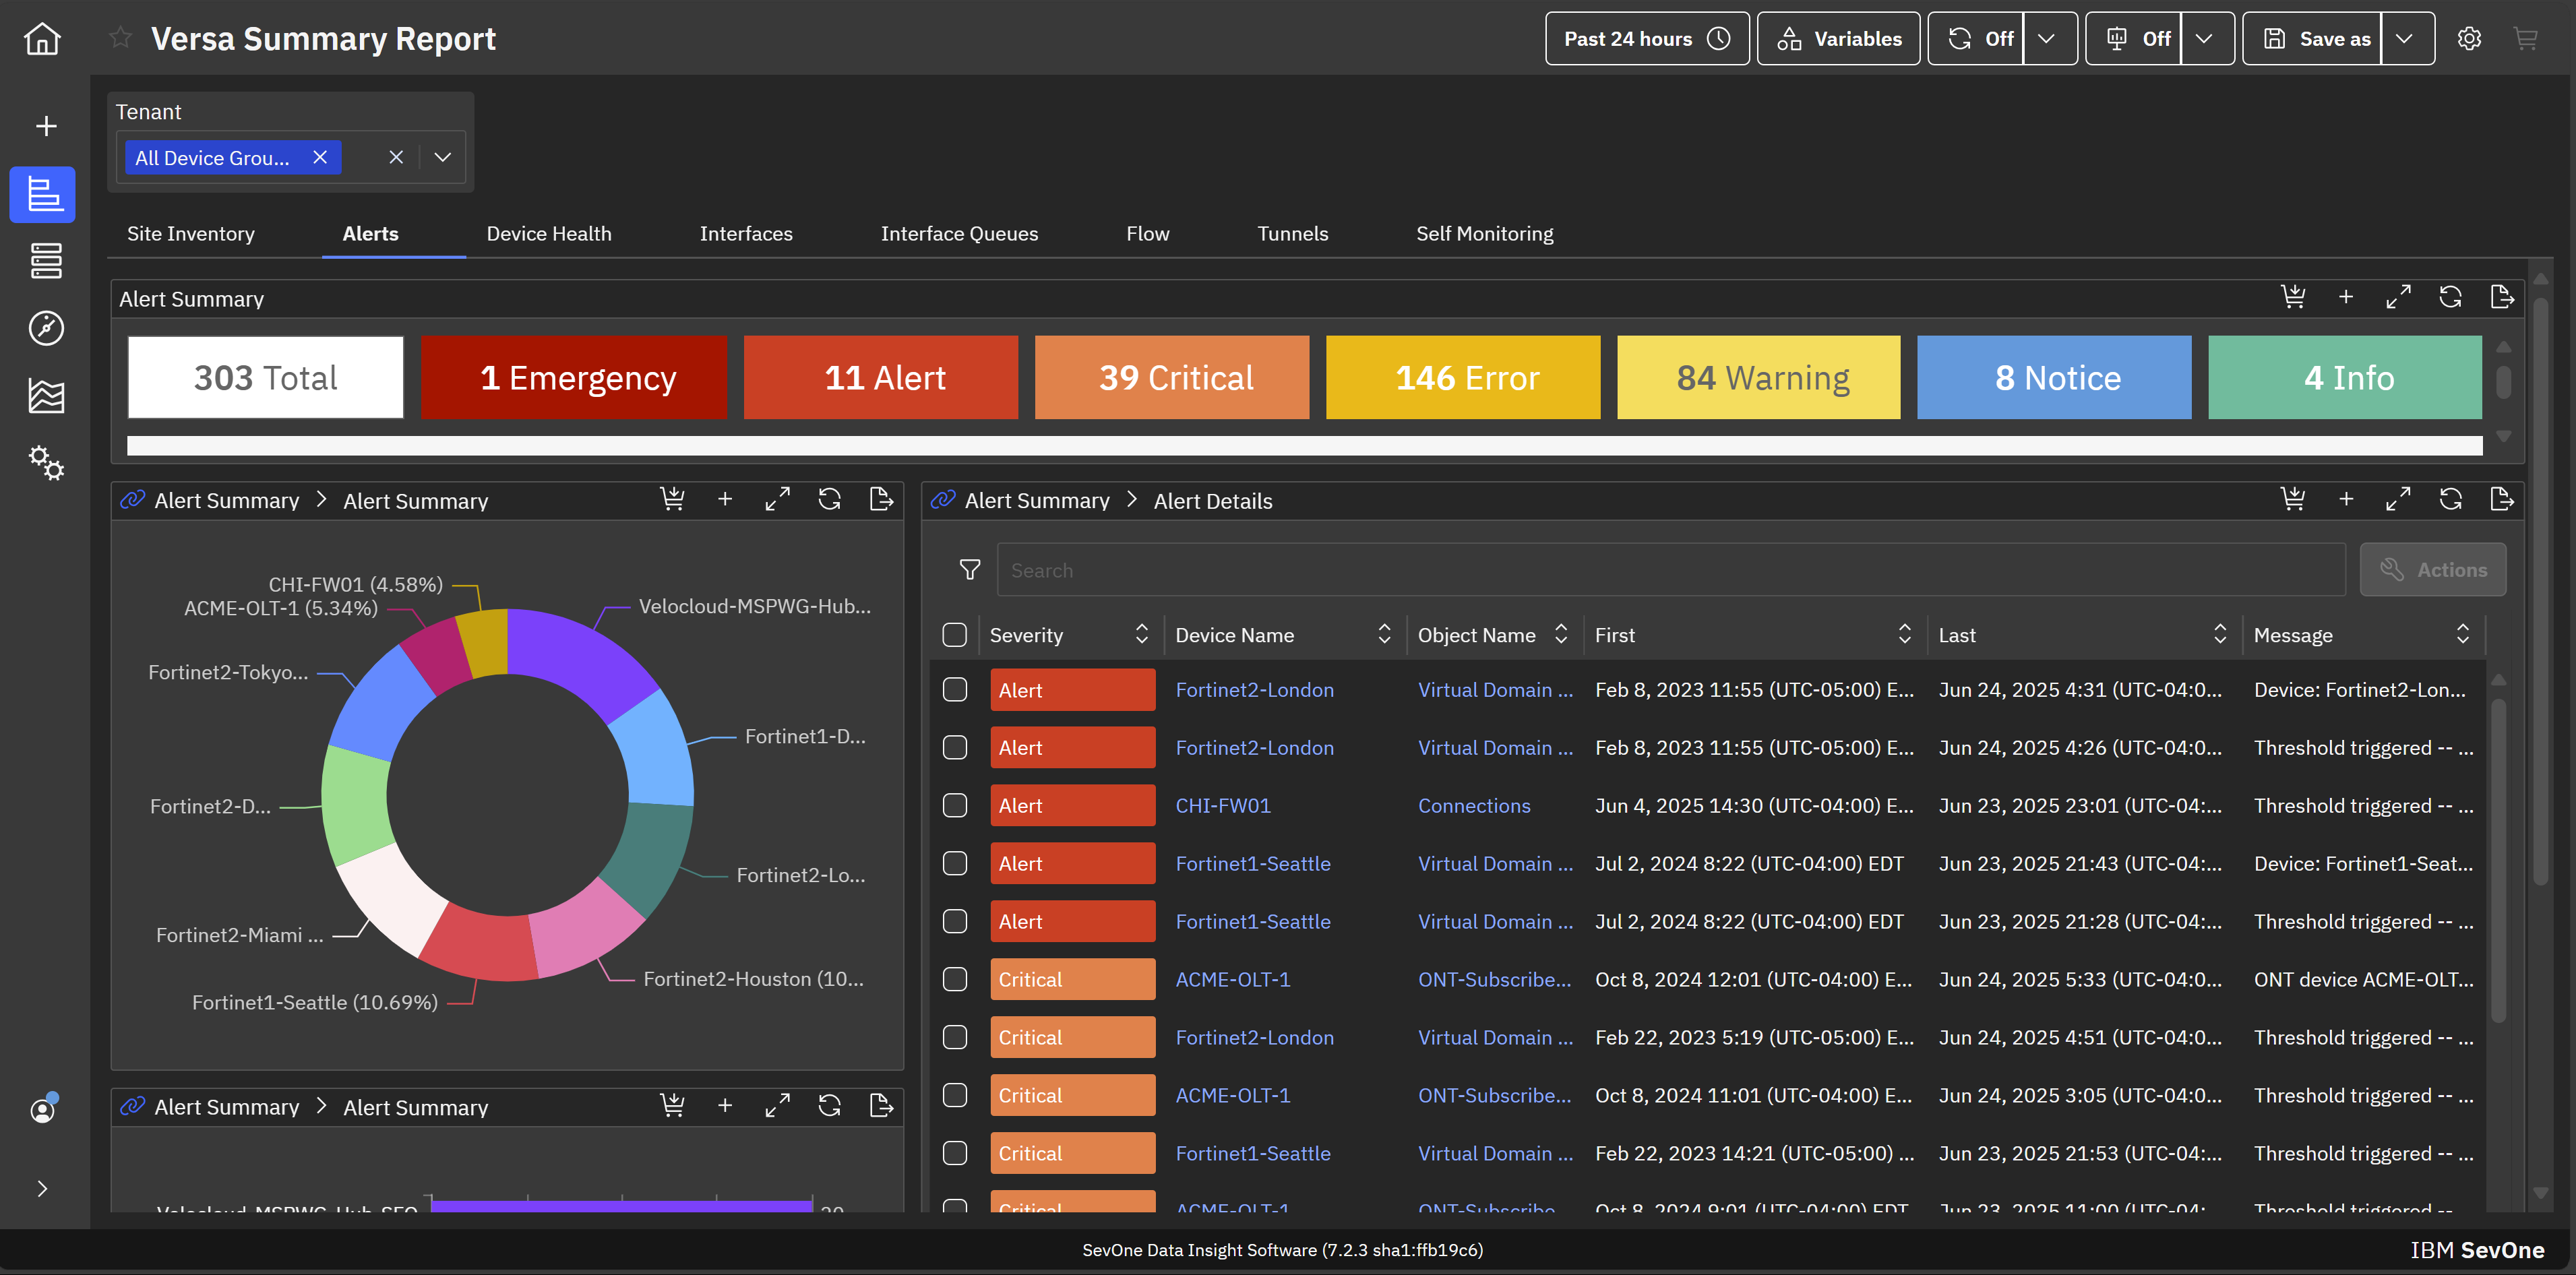
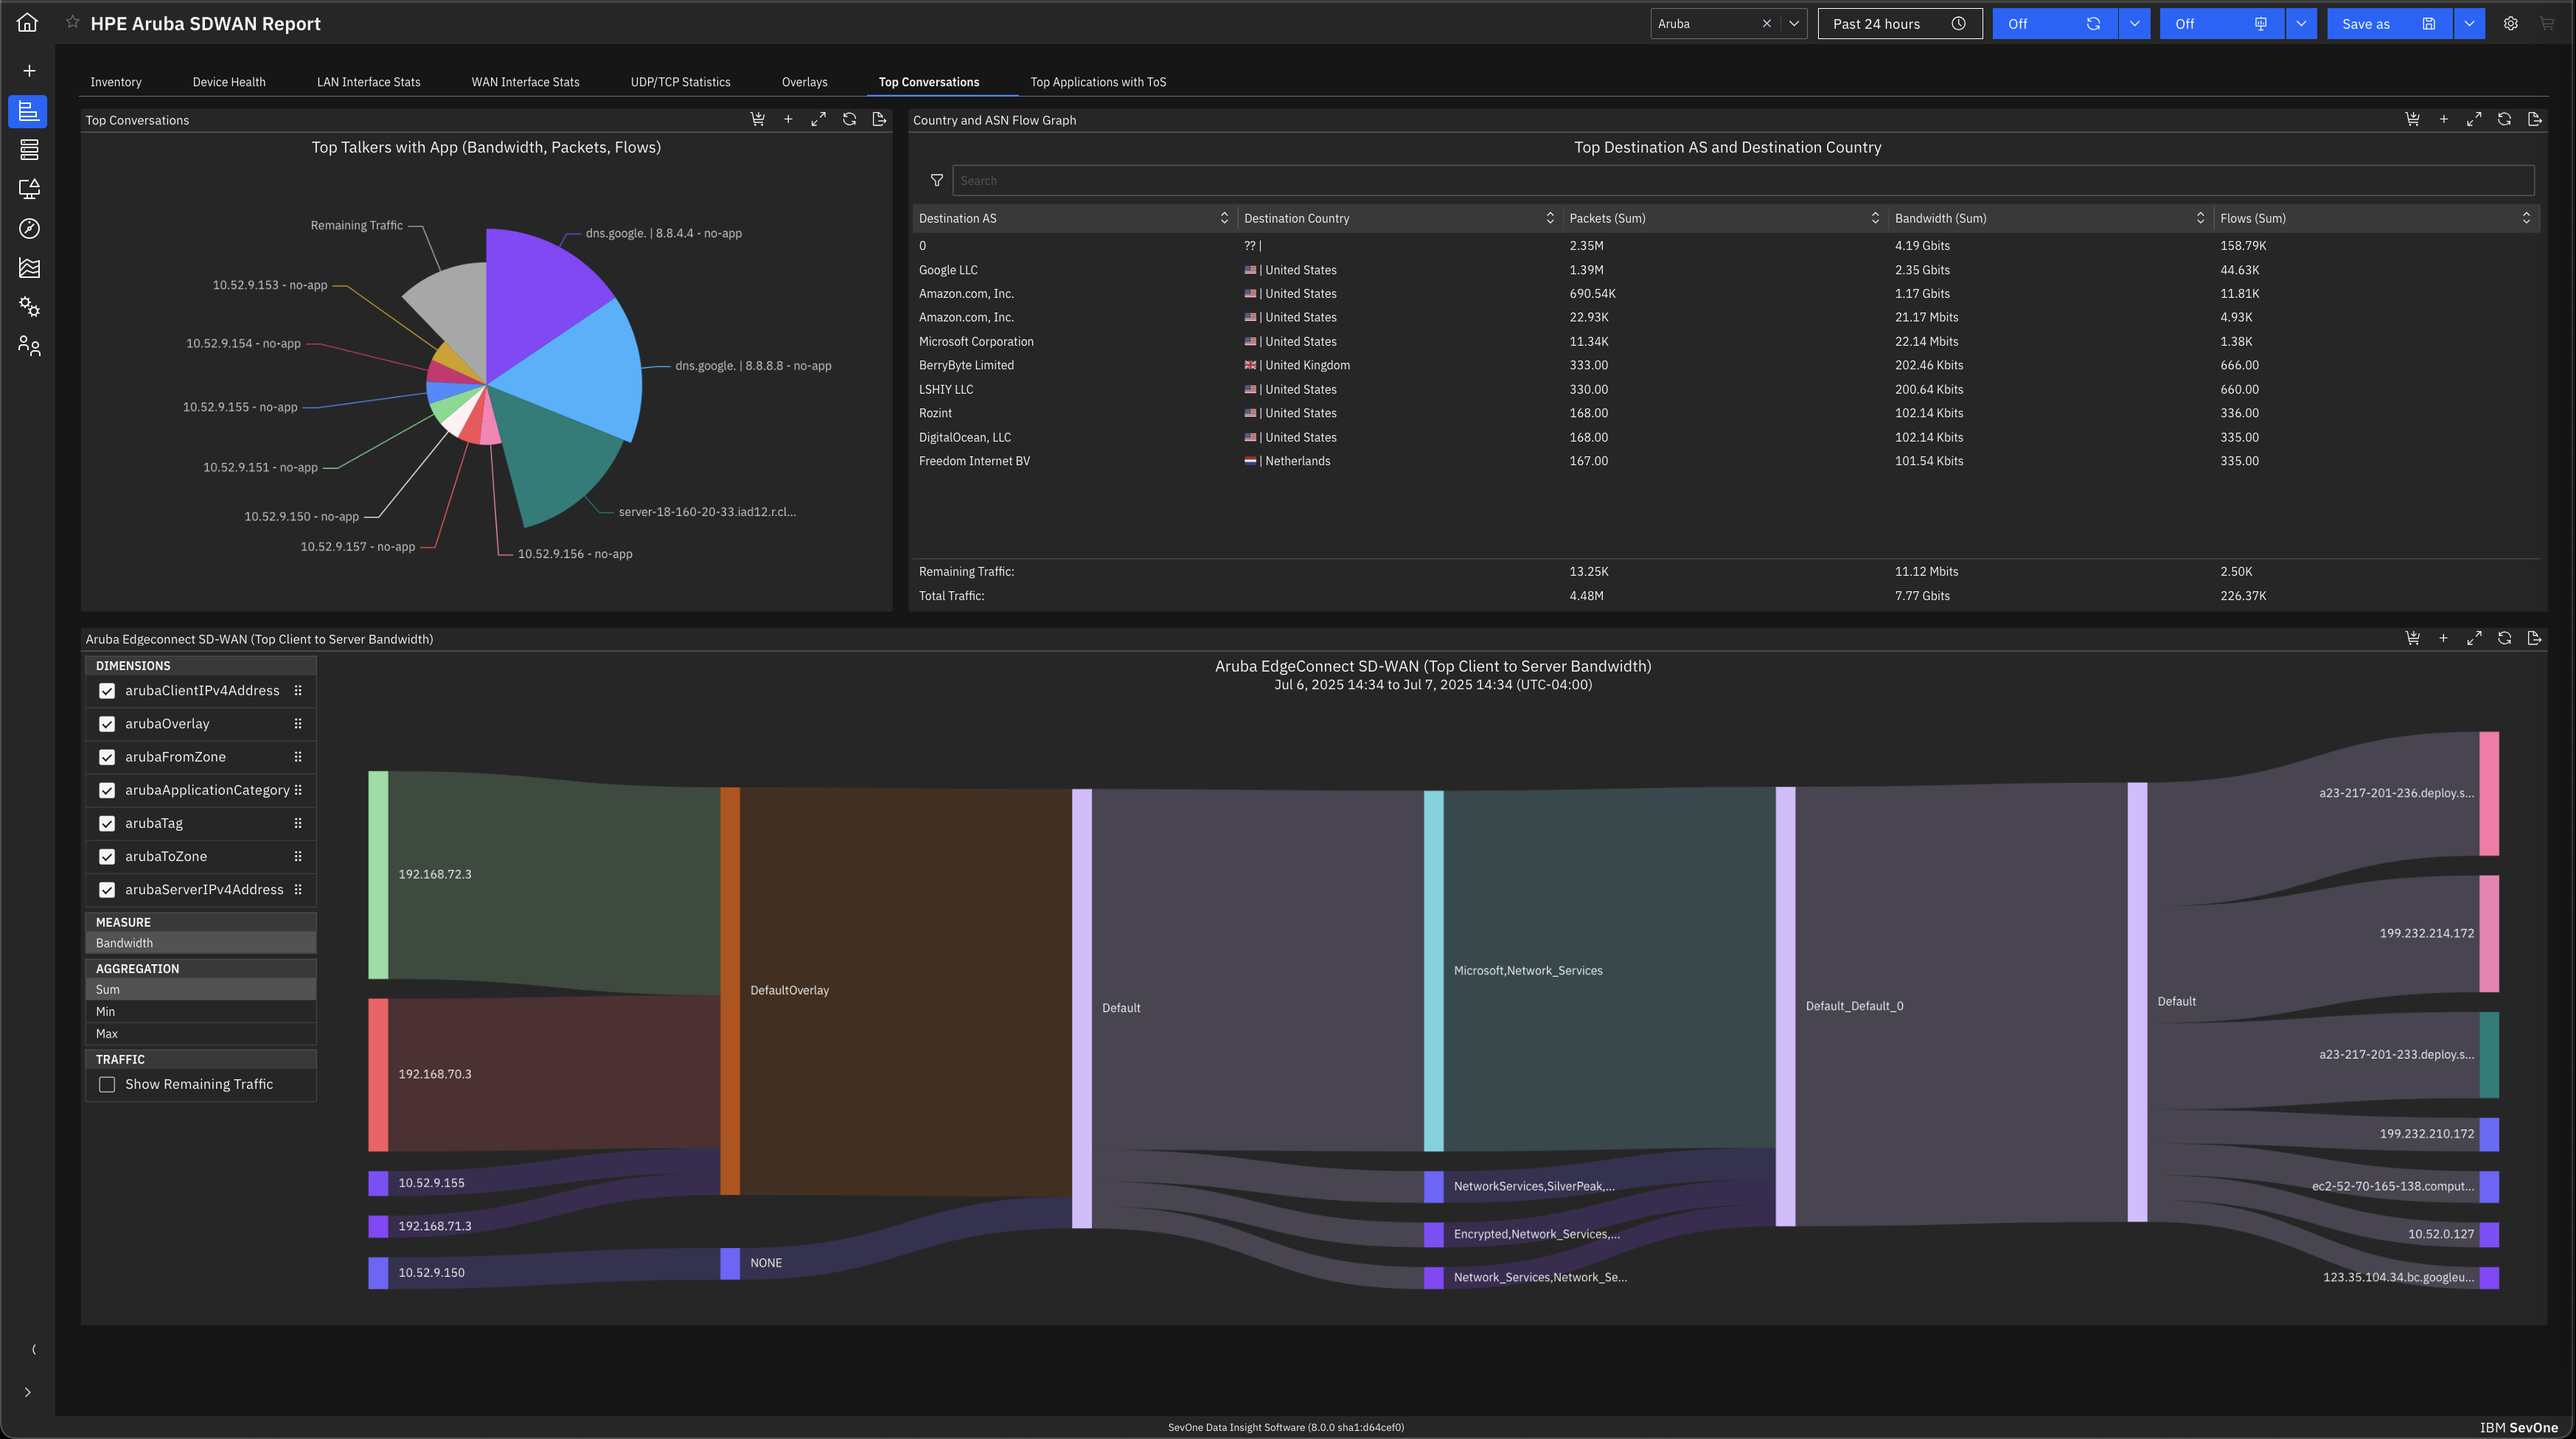
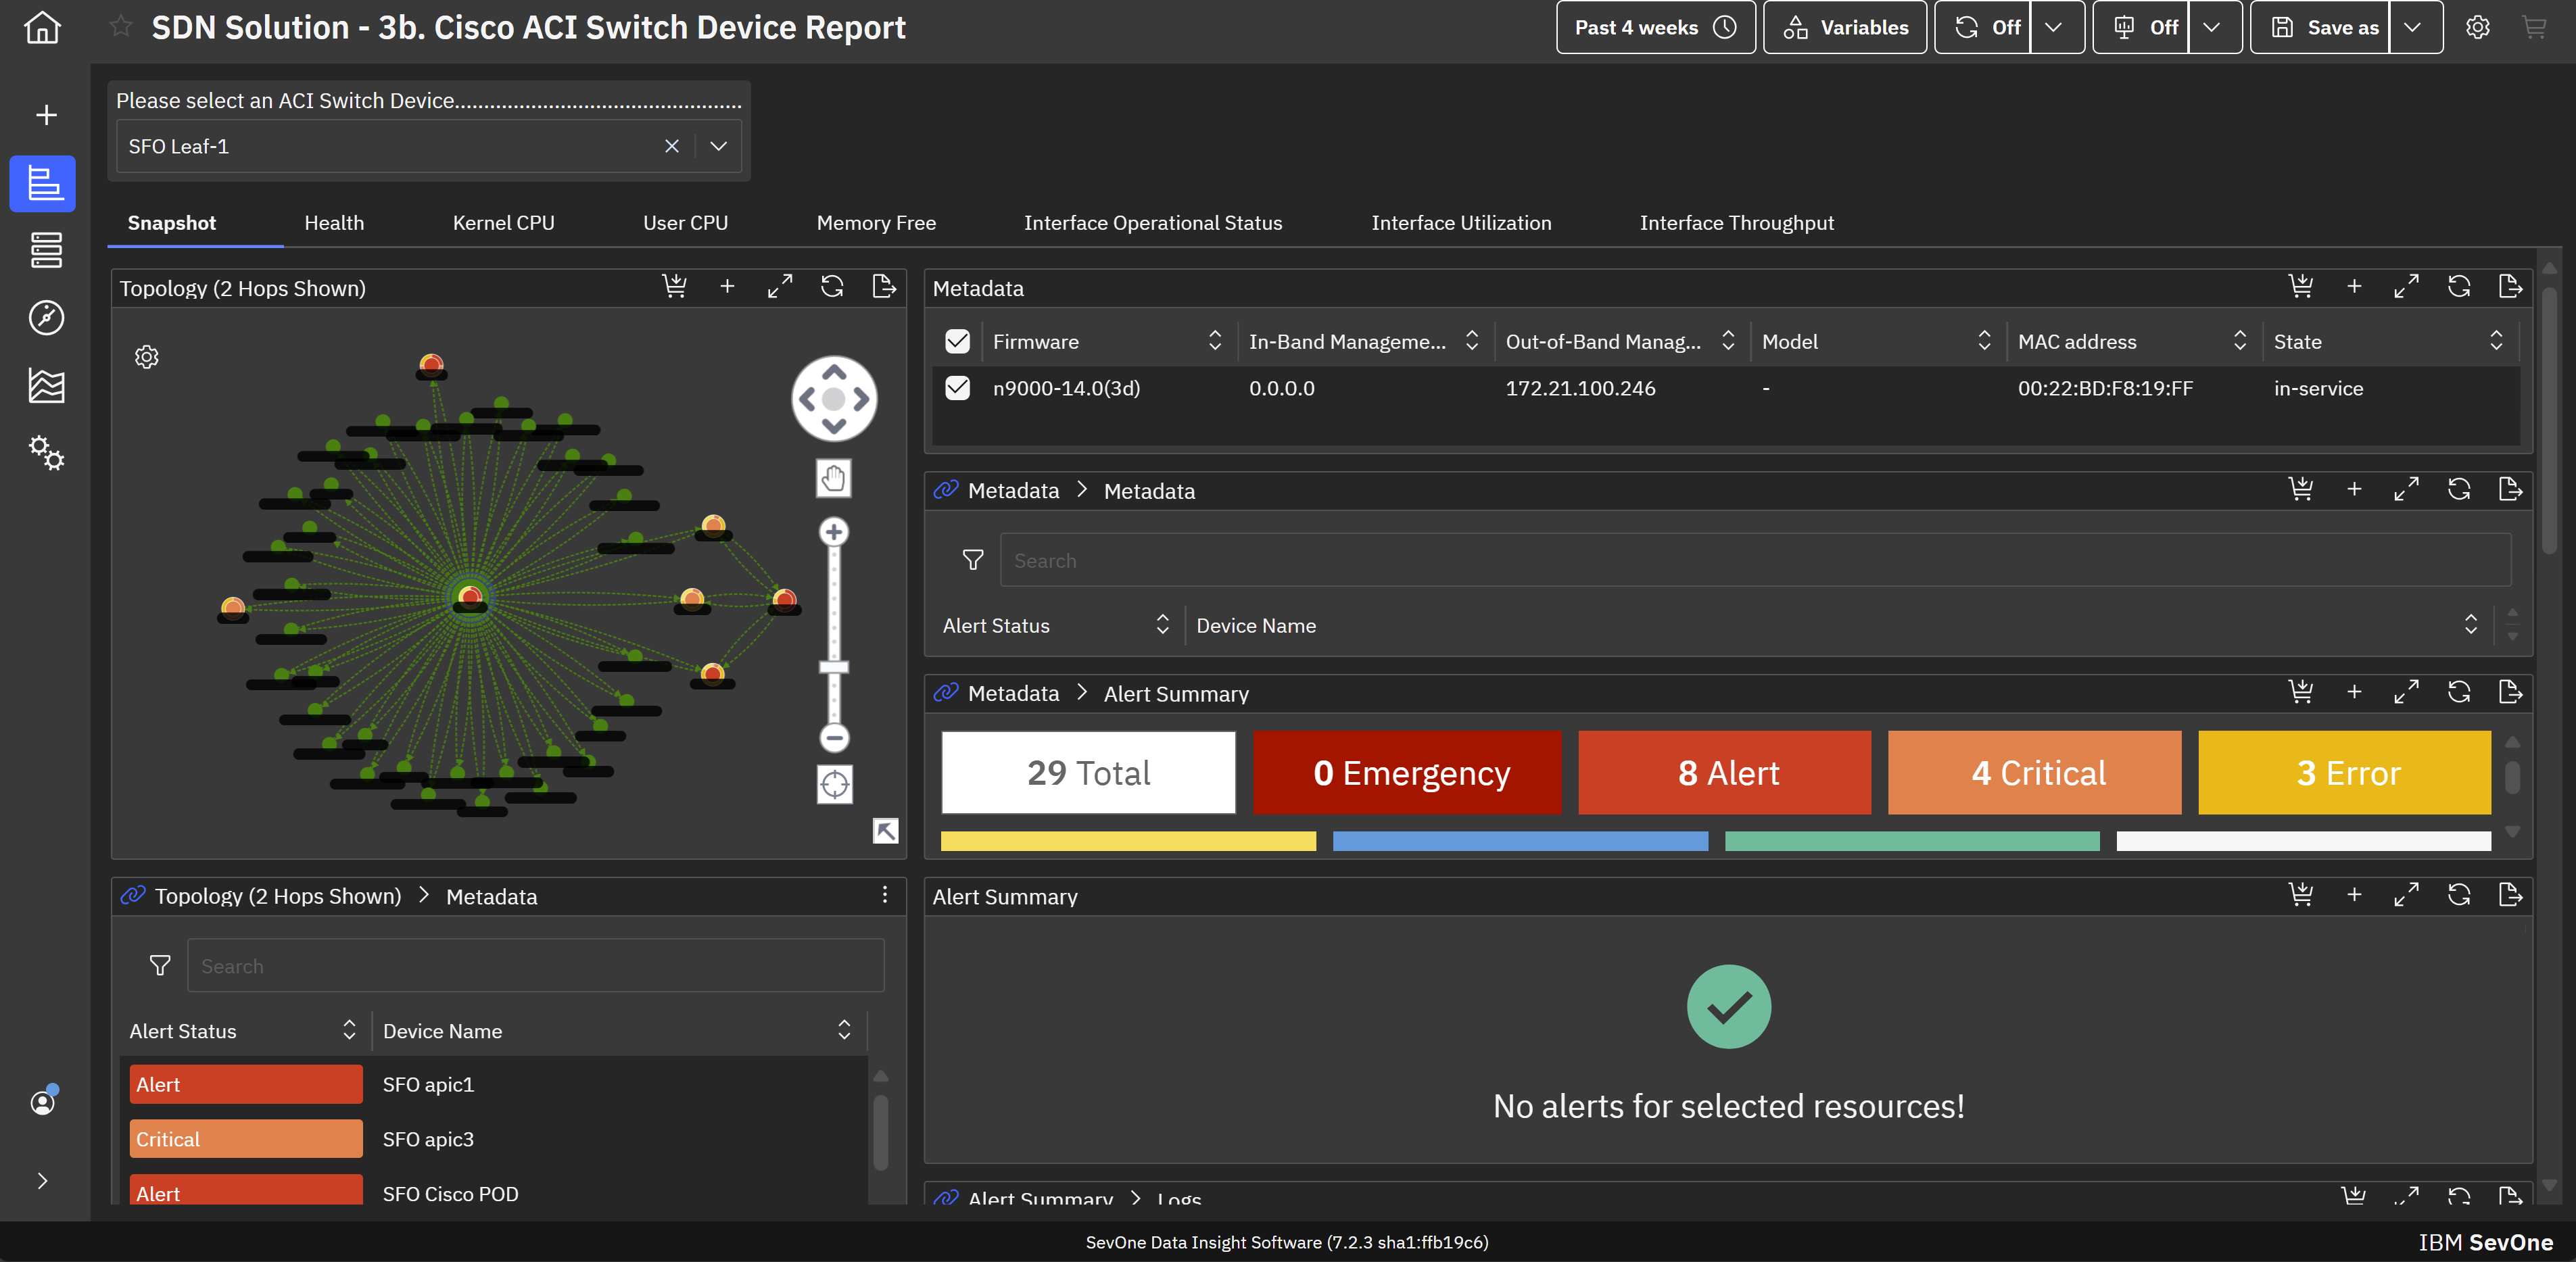
IBM SevOne’s app-centric, hybrid network observability empowers NetOps teams with ML-driven insights, enabling proactive issue prevention and resolution. With a single source of truth for network performance, it delivers visibility to optimize operations and support agility in complex, multi-cloud environments.
N/A
LogicMonitor
Score 9.0 out of 10
Mid-Size Companies (51-1,000 employees)
LogicMonitor’s SaaS-based platform, LM Envision, enables observability across on-prem and multi-cloud environments. It provides IT and business teams operational visibility and predictability across their technologies and applications.
N/A
Pricing
Datadog
IBM SevOne
LogicMonitor
Editions & Modules
Log Management
$1.27
per month (billed annually) per host
Infrastructure
$15.00
per month (billed annually) per host
Standard
$18
per month per host
Enterprise
$27
per month per host
DevSecOps Pro
$27
per month per host
APM
$31.00
per month (billed annually) per host
DevSecOps Enterprise
$41
per month per host
No answers on this topic
Enterprise
Contact sales team
Website Monitoring
Contact sales team
Offerings
Pricing Offerings
Datadog
IBM SevOne
LogicMonitor
Free Trial
Yes
No
Yes
Free/Freemium Version
Yes
No
No
Premium Consulting/Integration Services
No
Yes
Yes
Entry-level Setup Fee
Optional
No setup fee
No setup fee
Additional Details
Discount available for annual pricing. Multi-Year/Volume discounts available (500+ hosts/mo).
IBM® SevOne® uses Managed Device (MD) and Managed Client Device (MCD) as pricing metrics. These can be mapped to managed devices for physical, virtualized and containerized functions in the managed environment.
Our platform is broken down into Pro and Enterprise Pricing. Pro includes monitoring for all of your cloud, hybrid, and on-premises infrastructure. Our Enterprise package includes all of this, plus our AIOps and Machine Learning functionality that provides dynamic thresholds, root cause analysis, anomaly detection and more!
LogicMonitor only charges by the device. What is considered a device? A device is anything with an IP address that you want to monitor, including a physical device or a cloud resource. This means multiple data sources under the same IP address can be monitored for the same price. Unlike some monitoring platforms. we don’t charge per node, interface, or metric.
SevOne is a good alternative to the products such as SolarWinds, MicroFocus, LogicMonitor and many more for network monitoring. It has certain unique features such as Fancy Dashboard and flexibility to visualize the information in terms of widgets and metrics. Out of the …
May lack some of the advanced analytics, big-data scale, depth of historical performance, or baseline anomaly detection that SevOne provides. UI / advanced features are less polished. Datadog is strong in cloud-native, full-stack observability; good dashboards; good …
IBM SevOne was selected instead of Datadog because it is perfect for large insurance networks and also connects trouble-free between the on-premise and cloud environments. Its alerts are in real-time, it offers comprehensive dashboards and it allows to gain a better grip on the …
SevOne from Turbonomic is not as popular in network monitoring space as Solarwinds, MicroFocus, Broadcom etc. However, it is equally effective in monitoring. One unique feature that SevOne has over other software is that its framework is built on the latest technologies which …
Zabbix although opensource and free. The amount of time to setup, configure templates, and manage the individual agents ended up costing more in unrealized internal labor costs compared to LogicMonitor. Datadog was too complex and highly customizable with no real out of the box …
SCOM can do damn near anything, but practically takes an entire team just handling it. LM is super easy to get set up and going, even on a small team such as ours.
Datadog seems like a solid tool, but more oriented towards developers than IT infrastructure.
During the evaluation process we looked a number of other solutions, a detailed technically analysis was carried out to map functionlity, deployment and scalabilty across the solutions.
The primary areas that LogicMonitor succeeded are around the simplicity of deployment, …
Verified User
Manager
Chose LogicMonitor
We replaced N-Central with LogicMonitor, and had an extended bakeoff with Datadog. There were many things we liked (and still like) about Datadog, but its deployment model and less agnostic focus were disqualifying for our specific use case.
We evaluated Datadog, but it was primarily focused on data-related issues. So we decided to use LogicMonitor because it is excellent and offers so many more things than just data protection. It also keeps our systems safe with an advanced alert system, which is more critical …
I was one of the members who were looking for a better application for our system security, and we tried Datadog and New Relic. Those software were very good for normal usage. New Relic was working fine until we started facing problems if any sudden system increase as it was …
Our business used the trial period they provided on one of our systems and conducted sessions with all of this software. Our team tested all of these software options before deciding on LogicMonitor, as our business is expanding daily and we needed a system that could …
This is not an exhaustive list of all products we have previously evaluated. All of these likely have specific use-cases where they would be appropriate choices. In our evaluations, we've felt that LogicMonitor best fit the requirements of our use-case/s than the competition.
Thanks to LogicMonitor, I have hundreds of pre-configured notifications to customize individual entities, groups, or entire organizations. It has a good connection with the ticket system for creating, updating, and closing tickets. Extraordinarily accurate and provide an …
LogicMonitor is the only cloud solution that met all of our requirements for monitoring our on-prem resources. We selected LogicMonitor for truly its ease of use. Honestly, I did not want to dedicate an engineer to be the LogicMonitor admin. Our team manages it.
For being a product that can monitor a wide variety of resource types it is a strong tool. It just breaks down against some of the more in depth database monitoring tools that we need in the DBA team. We need more detail tracking on SPIDs and query level analysis and this is …
I didn't keep my list of all the various products that we had POC'ed or even had demos with. Almost all were too narrow in their view to handle the breadth of environments that we have both in the cloud and in the data centers. Those few that did stack up against LogicMonitor …
Datadog may be better suited for teams that have a more out-of-the-box infrastructure, on the primary platforms Datadog supports. You may also have better results if you have a bigger team dedicated to devops and/or a bigger budget. We found that trying to adapt it to our use case (small team, .NET on AWS Fargate) wasn't feasible. We continually ran into roadblocks that required us to dig through documentation (and at times, having to figure out some documentation was wrong), go back and forth with support, and in my opinion, waste money on excessive and unintended usages due to opaque pricing models and inaccurate usage reports, as well as broken/non-functional rate sampling controls.
The software is handy and really helps us track all the issues that may occur in our network, allowing us to rectify them before any significant problems with our server can arise. It also enhances the overall performance of all our servers and networks, but, as I mentioned earlier, it will take considerable time for a beginner to become familiar with every feature of the software.
The example I will give will explain my rating for it. One employee left our company due to a personal issue, and at that time, our team was working on a highly secure project. He wanted to take revenge on our company, so he began hacking our systems from the outside. Since it appears that someone without authorization is attempting to access our systems, LogicMonitor simultaneously alerted our team to the problem. We stopped that threat with LogicMonitor.
The thing which Datadog does really well, one of them are its broad range of services integrations and features which makes it one step observability solution for all. We can monitor all types of our application, infrastructure, hosts, databases etc with Datadog.
Its custom dashboard feature which helps us to visualize the data in a better way . It supports different types of charts through those charts we can create our dashboard more attractive.
Its AI powered alerting capability though that we can easily identify the root cause and also it has a low noise alerting capability which means it correlated the similar type of issues.
Alert windows cause lag in notifications (e.g. if the alert window is X errors in 1 hour, we won't get alerted until the end of the 1 hour range)
I would appreciate more supportive examples for how to filter and view metrics in the explorer
I would like a more clear interface for metrics that are missing in a time frame, rather than only showing tags/etc. for metrics that were collected within the currently viewed time frame
Documentation for the embedded help pages in NMS and more. In my opinion, these do not provide anything of any depth or maybe anything helpful at all. If anything it just seems to be a guide of what actually exists on the page. It is nicely searchable documentation though.
It is very surprising and disappointing for us to learn that it isn't until the latest version of IBM SevOne that bulk editing was introduced. I think this is such a basic and foundational feature that should have been a part of the original rollout. My team is still trying to configure the REST API.
It was disappointing for the webinar to start with a speaker who had a thick accent and simply read from slides. To me, it felt hopeless until the second speaker, who was engaging and easy to understand. It's as if this fact wasn't considered. I'm sure the first speaker lost a lot of viewers who didn't stick around to discover the 2nd speaker.
I asked three different questions during the webinar and none were answered.
This product has met virtually all of our needs. It was easy to implement and has been simple to support. Customization has been intuitive with many options available. They keep adding features and expanding available options. The future of LogicMonitor looks even better than it is today which is very promising. The management and support teams at LogicMonitor are always helpful
There are so many features that it can be hard to figure out where you need to go for your own use case. For example, RUM monitoring us buried in a "Digital Experience" sidebar setting when this is one of our key use cases that I sometimes struggle to find in the application. It appears that ECS + Fargate monitoring was recently released which is great because we had to build a lambda reporting solution for ephemeral task monitoring. But this new feature was never on my radar until I starting clicking around the application.
Set up is super easy. Just stand up a small Linux or Windows server to act as a collector. There are no agents to install on monitored devices and all you need is SNMP or WMI access. When creating dashboards, all you have to do is find the widget on the device you want to show up and choose the menu option to add it.
The support team usually gets it right. We did have a rather complicate issue setting up monitoring on a domain controller. However, they are usually responsive and helpful over chat. The downside would be I don’t think they have any phone support. If that is important to you this might not be a good fit.
The sales team support we received was top notch. They worked hand in hand to make sure the product met all expectations. So far we have not really had to work with support that much; we have worked with setup team after purchase to deploy product fully. No issues so far and we are four weeks in.
I did not truly dedicate myself to implementing LogicMonitor. However, I overheard the IT team members explain that "LogicMonitor is perfect for us as it has made most of the work automated, and implementation and training sessions were perfect for us." Thus, I can state that everything went smoothly with our implementation.
Our logs are very important, and Datadog manages them exceptionally well. We frequently use Datadog services for our investigations. Use case: Monitor your apps, infrastructure, APIs, and user experience.
Key features:
Logs, metrics, and APM (Application Performance Monitoring)
Real-time alerting and dashboards
Supports Kubernetes, AWS, GCP, and other integrations
RUM (Real User Monitoring) and Synthetics
✅ Best for backend, server, and distributed systems monitoring.
IBM SevOne was selected instead of Datadog because it is perfect for large insurance networks and also connects trouble-free between the on-premise and cloud environments. Its alerts are in real-time, it offers comprehensive dashboards and it allows to gain a better grip on the network issues, thus helping to keep the downtime small and the operations well managed thanks to the good communication.
Basically, we did not have any idea about it and how to choose, but we asked one of our former bosses, as they were very experienced with it, so they helped us by clarifying a few things between New Relic and LogicMonitor, as they told us that if you are looking for an automated option, then there is no better option than LogicMonitor.
Pricing seems to be getting more and more aggressive, I worry that it's going to turn into ServiceNow or SAP and everything minor feature will be an extreme cost that prices out us and our customers
Haven't really used it but our initial onboarding PS was disappointing. Felt like we were being told what we needed to cover as opposed to what we wanted to cover. In addition, we were pushed into using the PS in tight time frames and we were not ready to do so.