Spotfire® is a data visualization platform that utilizes predictive analytics. In addition to data viz, it includes data wrangling capabilities, predictive analytics, location analytics, and real-time streaming analytics. Spotfire® is a business unit of Cloud Software Group, formerly known as TIBCO Spotfire.
$0.99
Per Hour (Starting)
Yurbi
Score 8.0 out of 10
N/A
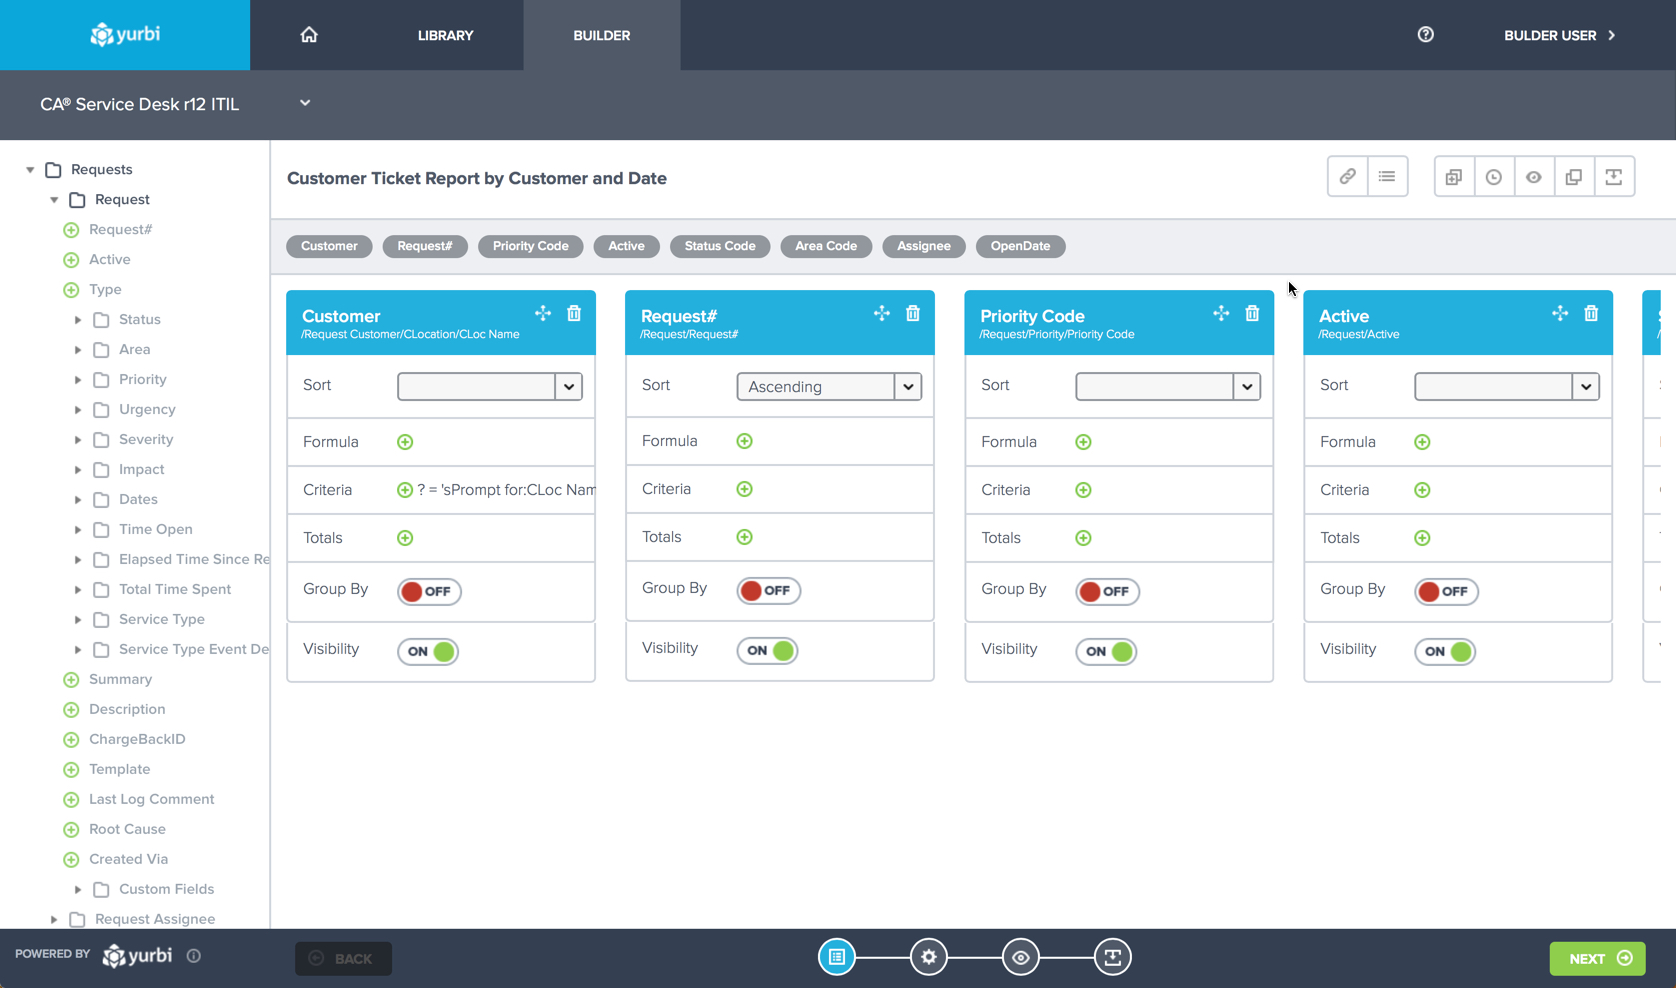
Yurbi is a business intelligence solution that is designed to bridge the gap between business users and intelligent data. It provides the business user with the ability to connect, secure, and collaborate with data to make better business decisions. According to the vendor, Yurbi brings the powerful reporting and analytical capabilities of traditional BI, but takes out the coding jargon – so that people can actually use it themselves.
As a 100% HTML5 application, Yurbi gives users and…
$24,000
per year
Pricing
Spotfire
Yurbi
Editions & Modules
Spotfire for Amazon Web Services
$0.99
Per Hour (Starting)
Spotfire Cloud - Consumer
$250/yr
per seat
Spotfire Cloud - Business Author
$650/yr
per seat
Spotfire Cloud - Analyst
$1250/yr
per seat
Spotfire Platform
Please contact Spotfire sales
Spotfire Cloud Enterprise
Please contact Spotfire sales
Yurbi
24,000
per year
Offerings
Pricing Offerings
Spotfire
Yurbi
Free Trial
Yes
Yes
Free/Freemium Version
Yes
No
Premium Consulting/Integration Services
Yes
Yes
Entry-level Setup Fee
No setup fee
No setup fee
Additional Details
For Enterprise engagements, please contact TIBCO directly for a custom price quote.
Yurbi's pricing model is simple and predictable. User licenses start at just $495 per year and that includes all the powerful features of our platform. We offer named users, concurrent users, and public view or anonymous report licensing options. We also offer custom/hybrid pricing for vendors looking to OEM Yurbi.
A high level of data integration is available here it supports various data sources and so on. Collaborating features allow users to give access to the dashboard and merge data analytics with other team members. It can meet the demands of both small and large size business enterprises. A customized dashboard and reports are provided to meet the specific needs and get support of extensibility through APIs and customized scripts.
The Yurbi Poduct is extremely well suited for organizations looking for a mature Business Intelligence and ad-hoc reporting tool. The strength of Yurbi is that it is highly customizable and can work in various environments.
Yurbi allows us to build customized Dashboards for specific users. Once the initial Dashboard is created, the user themselves have permissions to customize the Dashboard to suit their needs. The flexibility is there for a wide set of users.
Yurbi product is highly customizable. We looked for a Business Intelligence product for quite some time that could be customized to work with different types of data sets. When we started considering Yurbi, it was evident from the beginning that the product could be customized very quickly to work within our environment and our specific data types.
The Yurbi product stays a step ahead with the changing market being focused more for the tablet and smart phone user population. As our customers first started to use iPADs and iPhones, it was great to see that an upgraded Yurbi product was readily available for use for the iPAD/iPhone set of users.
The donut chart is I guess a powerful illustrations but I hope it should be done quite simple in Spotfire. But in Spotfire there are lots of steps involve just to build a simple donut chart.
Table calculation (like Row or Column Differences) should be made simple or there should be drag and drop function for Table Calculation. No need for scripting.
Information Link should be changed. If new columns are added to the table just refreshing the data should be able to capture the new column. No need extra step to add column
While the Yurbi Developer tool is highly mature, there have been cases where building specific complex reports within Yurbi required extensive support directly from the vendor (and even some Yurbi product customizations). It would be great if the Yurbi Developer tool could be slightly refreshed to make it easier for more non-technical users to build more complex reports within Yurbi.
Over years of usage of the Yurbi product with growing set of available reports to run for users, it's easy to get unorganized in terms of being able to find the correct report to run. It's highly adviseable if future releases of Yurbi began offering features to organize all reports a little better within the product (including an audit trail of reports that users typically run to make it easier for them to go back to the right reports).
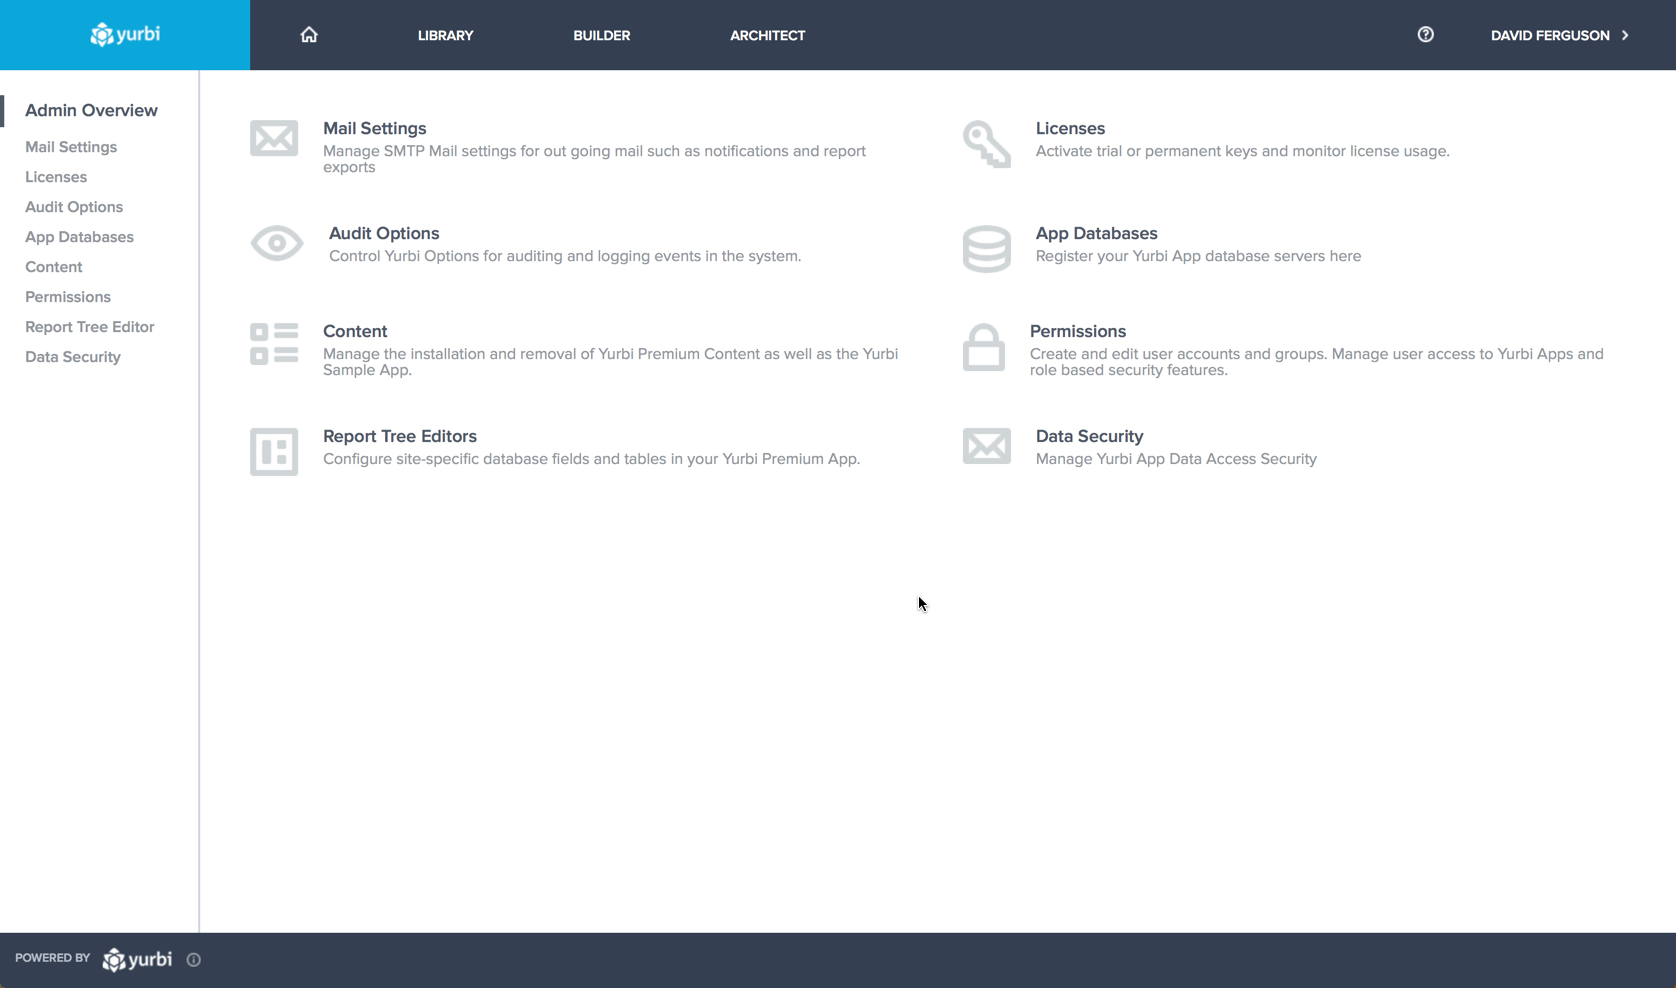
We heavily use the SMTP configuration within Yurbi to set up auto-email notifications to specific set of users with requested reports. At times, the SMTP service becomes unavailable and Yurbi product is unable to send these emails to the users. Besides not receiving the email, it's easily evident that the SMTP service connection failed. It would be great if future versions of the Yurbi product would alert the user of the failed SMTP connection on initial Yurbi login so the administrator becomes aware of the issue and can take action to resolve the problem.
-Easy to distribute information throughout the enterprise using the webplayer. -Ad hoc analysis is possible throughout the enterprise using business author in the webplayer or the thick client. -Low level of support needed by IT team. Access interfaces with LDAP and numerous other authentication methods. -Possible to continually extend the platform with JavaScript, R scripts, HTML, and custom extensions. -Ability to standardize data logic through pre-built queries in the Information Designer. Everyone in the enterprise is using the same logic -Tagging and bookmarking data allows for quick sharing of insights. -Integration with numerous data sources... flat files, data bases, big data, images, etc. -Much improved mapping capability. Also includes the ability to apply data points over any image.
The Yurbi product has been perceived very well by our customers. They have continued to use it for years and the user population has only expanded. Customers love the flexibility and large set of Dashboards and reports that can be made available within the product quickly and efficiently.
Basic tasks like generating meaningful information from large sets of raw data are very easy. The next step of linking to multiple live data sources and linking those tables and performing on the fly analysis of the imported data is understandably more difficult.
The Yurbi product is incredibly easy to use and very intuitive for the user. The environment is highly customizable to the user's own preferences which is the best part.
Even though, it's a rather stable and predictable tool that's also fast, it does have some bugs and inconsistencies that shut down the system. Depending on the details, it could happen as often as 2-3 times a week, especially during the development period.
Generally, the Spotfire client runs with very good performance. There are factors that could affect performance, but normally has to do with loading large analysis files from the library if the database is located some distance away and your global network is not optimal. Once you have your data table(s) loaded in the client application, usually the application is quite good performance-wise.
Support has been helpful with issues. Support seems to know their product and its capabilities. It would also seem that they have a good sense of the context of the problem; where we are going with this issue and what we want the end outcome to be.
The instructor was very in depth and provided relevant training to business users on how to create visualizations. They showed us how to alter settings and filter views, and provided resources for future questions. However, the instructor failed to cover data sources, connecting to data, etc. While it was helpful to see how users can use the data to create reports, they failed to properly instruct us on how to get the dataset in to begin with. We are still trying to figure out connections to certain databases (we have multiple different types).
The online training is good, provides a good base of knowledge. The video demonstrations were well-done and easy to follow along. Provided exercises are good as well, but I think there could be more challenging exercises. The training has also gone up in price significantly in the last 3 years (in USD, which hurts us even more in Canada), and I'm not sure it is worth the money it now costs (it is worth how much it cost 3 years ago, but not double that.)
The original architecture I created for our implementation had only a particular set of internal business units in mind. Over the years, Spotfire gained in popularity in our company and was being utilized across many more business units. Soon, its usage went beyond what the original architectural implementation could provide. We've since learned about how the product is used by the different teams and are currently in the middle of rolling out a new architecture. I suggest:
Have clearly defined service level agreements with all the teams that will use Spotfire. Your business intelligence group might only need availability during normal working hours, but your production support group might need 24/7 availability. If these groups share one Spotfire server, maintenance of that server might be a problem.
Know the different types of data you will be working with. One group might be working with "public" data while another group might work with sensitive data. Design your Library accordingly and with the proper permissions.
Know the roles of the users of Spotfire. Will there only be a small set of report writers or does everyone have write access to the Library?
ALWAYS add a timestamp prompt to your reports. You don't want multiple users opening a report that will try and pull down millions of rows of data to their local workstations. Another option, of course, is to just hard code a time range in the backing database view (i.e. where activity_date >= sysdate - 90, etc.), but I'd rather educate/train the user base if possible.
This probably goes without saying, but if possible, point to a separate reporting database or a logical standby database. You don't want the company pounding on your primaries and take down your order system.
Spotfire is significantly ahead of both products from an ETL and data ingestion capability. Spotfire also has substantially better visualizations than Power BI, and although the native visualizations aren't as flexible in Tableau, Spotfire enables users to create completely custom javascript visaualizations, which neither Tableau or Power BI has. Tableau and Power BI are likely only superior to Spotfire with respect to embedded analysis on a website.
In an enterprise architecture, if Spotfire Advanced Data services(Composite Studio),data marts can be managed optimally and scalability in a data perspective is great. As the web player/consumer is directly proportional to RAM, if the enterprise can handle RAM requirement accomodating fail over mechanisms appropraitely, it is definitely scalable,