

PingPlotter - New user review
Great tool to fix latency issues. The UI is simple and very easy to use. It does not require deep technical knowledge to operate and …
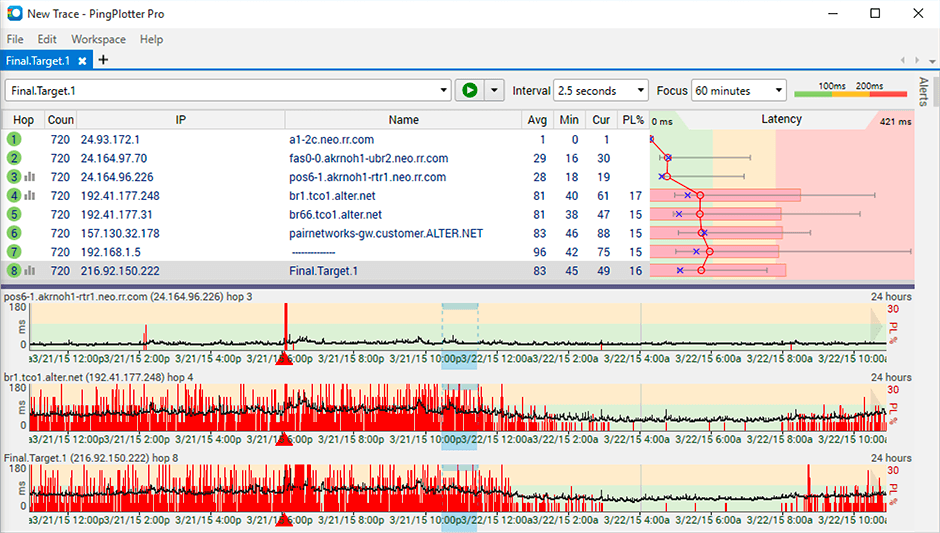
PingPlotter is a graphical traceroute and ping tool that visualizes network performance in a way that makes identifying the source of problems quicker and easier for everyone from online gamers and video streamers to VoIP admins and IT pros. Features…


| Deployment Types | On-premise, Software as a Service (SaaS), Cloud, or Web-Based |
|---|---|
| Operating Systems | Windows, Mac |
| Mobile Application | Apple iOS |
| Supported Languages | English |
PingPlotter has become an essential tool for network administrators and IT professionals, enabling them to effectively monitor network traffic, detect and diagnose network issues, and significantly reduce troubleshooting time. Users have configured PingPlotter to monitor multiple connections and IP addresses over extended periods, allowing them to identify when slowdowns occur and promptly resolve them. By providing valuable metrics such as network availability, packet loss, latency, and response time, PingPlotter visually displays what is happening on the network. This capability has proven invaluable in diagnosing the cause of network problems as it presents users with graphs and historical data to troubleshoot past issues and determine current latency.
IT departments and networking teams widely utilize PingPlotter to monitor remote devices, demonstrate zero downtime operations, and troubleshoot network connectivity issues. Through its usage, users have successfully identified faulty communication links, accurately pinpointed the source of intermittent timeouts, and monitored network performance during infrastructure shifts. The intuitive interface and visual charts offered by PingPlotter have received praise for their ability to provide a clear view of pings and results. This clarity facilitates effective communication with stakeholders while also saving time and resources for network engineers.
Furthermore, PingPlotter has proven instrumental in helping technicians definitively identify problem areas and provide proof to Internet Service Providers or other involved parties. By relying on PingPlotter's diagnostics capabilities, users have been able to reduce troubleshooting time significantly. They have successfully diagnosed frequent network issues, held ISPs accountable for their service quality, and subsequently minimized network downtimes. As a result of these improvements in efficiency, productivity has experienced noteworthy enhancements.
Overall, PingPlotter stands as a dependable network troubleshooting and diagnostic tool that aids users in comprehending network problems, tracking device issues, and presenting graphical evidence to ISPs for efficient troubleshooting. Its broad range of applications across various industries showcases its reliability in addressing complex networking challenges.
Users have made the following recommendations based on their experience with the software:
Try before purchasing: Several users have suggested trying the software before making a purchase. This recommendation emphasizes the importance of exploring the software's features and usability to determine if it meets individual needs and expectations.
Utilize for network monitoring: Users recommend using the software for monitoring network connections. This feature proves useful in keeping track of network performance and detecting any issues that may arise.
Explore all features during trial period: It is recommended to thoroughly explore all features of the software during the trial period. By doing so, users can fully understand the capabilities of the software and make an informed decision about its suitability for their specific requirements.
Additionally, some users have also recommended using the software for troubleshooting remote locations over the internet.