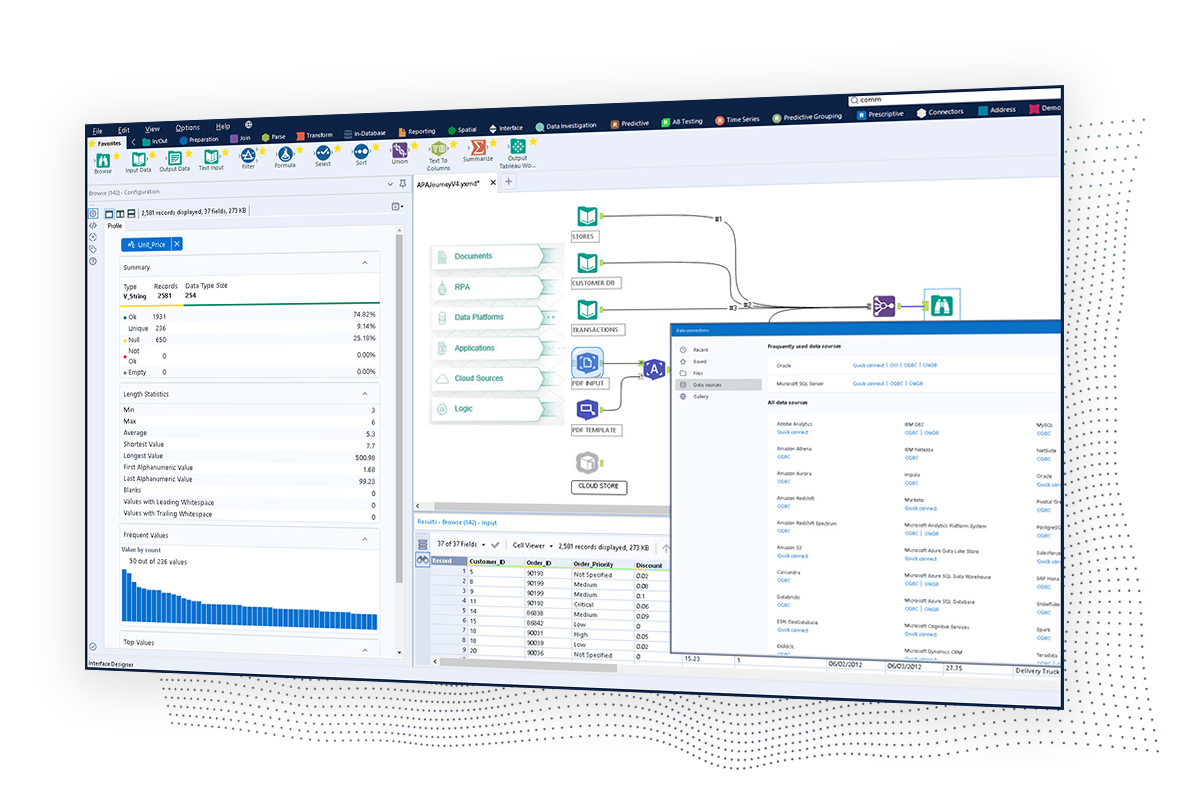
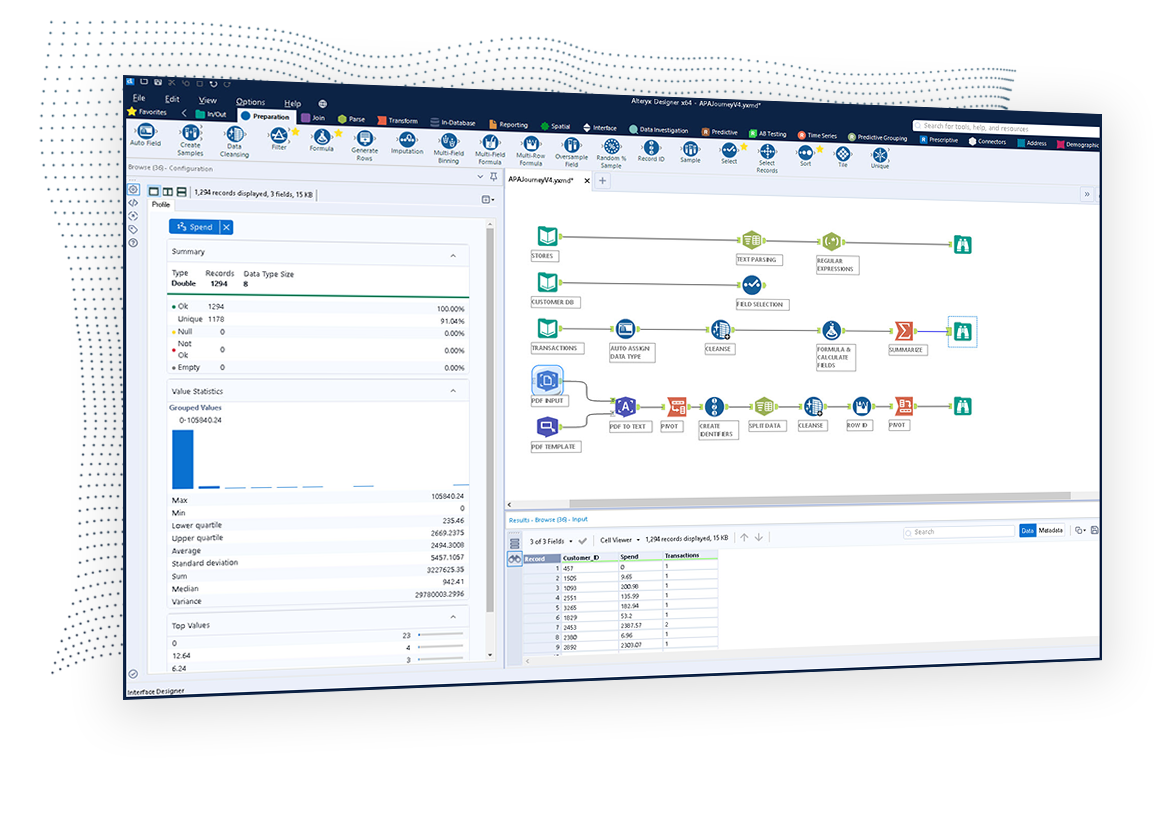
The Alteryx AI Platform gives organization automated data preparation, AI-powered analytics, and machine learning with embedded governance and security. Its self-service functionality, with self-service data prep, machine learning, and AI-generated insights, gives enterprise teams with a simplified user experience allowing everyone to create analytic solutions that improve productivity, efficiency, and the bottom line. Alteryx Designer can be used to automate every analytics step…
$14,850
per year 3 users (minimum), cloud edition
Tableau Desktop
Score 8.4 out of 10
N/A
Tableau Desktop is a data visualization product from Tableau. It connects to a variety of data sources for combining disparate data sources without coding. It provides tools for discovering patterns and insights, data calculations, forecasts, and statistical summaries and visual storytelling.
$1,380
per year (purchased via a Creator license)
Tableau Server
Score 7.6 out of 10
N/A
Tableau Server allows Tableau Desktop users to publish dashboards to a central server to be shared across their organizations. The product is designed to facilitate collaboration across the organization. It can be deployed on a server in the data center, or it can be deployed on a public cloud.
$12
Per User Per Month
Pricing
Alteryx Platform
Tableau Desktop
Tableau Server
Editions & Modules
Designer Desktop
starting at $5,195
per year per user
Designer Cloud Professional Edition
Starting at $4,950
per year per user (minimum of 3 users)
Tableau Creator License
$115
per month (billed annually) per user
Viewer
$12.00
Per User Per Month
Explorer
$35.00
Per User Per Month
Creator
$70.00
Per User Per Month
Offerings
Pricing Offerings
Alteryx Platform
Tableau Desktop
Tableau Server
Free Trial
Yes
No
Yes
Free/Freemium Version
No
Yes
No
Premium Consulting/Integration Services
Yes
Yes
Yes
Entry-level Setup Fee
No setup fee
No setup fee
No setup fee
Additional Details
—
All pricing plans are billed annually. A Creator license includes Tableau Desktop, Tableau Prep Builder, and Tableau Pulse. Discounts sometimes available for volume.
Alteryx serves as a complementary product, performing all the data wrangling for the likes of Tableau Desktop and Microsoft PowerBI for visualization. Microsoft Excel serves as an easier means of automation for tasks that previously would have involved a lot of manual …
Use both and they integrate pretty well. This is mainly because they do different things well. Alteryx allows the user to organize and cleanse the data, while Tableau is much more intuitive in the visualization category. Each has tried to replicate the others strengths, but …
Alteryx beats Tableau fair and square. Tableau is good for vizzy but nothing is comparable to Alteryx's data analysis and big data power. KNIME as well is nothing compared to the R&D Alteryx has. Alteryx having a cost compared to KNIME is a factor but the ROI is definitely …
I prefer Alteryx Platform to all the above products. In my opinion, the Microsoft products (Excel, Power BI) are inferior, cheaper alternatives to Alteryx Platform.
Alteryx is by far the most powerful tool to carry out complex and customized calculations with ease and highly reproducible while the other tools often face memory issues and 10x more time to carry ou similar calculations
Alteryx is more efficient than competitors we've tested and used. Alteryx Designer can handle data wrangling and analysis that we once needed to do in multiple software.
Verified User
Analyst
Chose Alteryx Platform
IMHO KNIME is not user friendly as much as Alteryx. Learning curve is long. Regardless is Open Source, the GUI is awful. To do same job in Alteryx you need to add many components and the configuration is very complex. Although the application is free, the server side is not. I …
Verified User
Manager
Chose Alteryx Platform
Alteryx weighs over Informatica in terms of ease of use and upscaling.
Alteryx stacks up against its competitors in the marketplace because from day one its goal was to simplify and democratize data processes. Its visual nature and transparent tool set, combined with its highly addictive joy to use make it stand out from the crowd.
Alteryx has interactive visualization capabilities which RapidMiner lacks. Alteryx is more intuitive and suited for enterprises vs. RapidMiner which is more suited for individuals and beginners (since it focuses on the building blocks). Also, Alteryx has a very strong learning …
Alteryx low-code/no-code workflow development, and the ability to view my data at every step, immediately improved my development time by at least 60%. Highbond (formerly Galvanize / ACL) relies on a proprietary ACL script coding language, which can be time-consuming to …
Previous to Alteryx aquiring Trifacta, we looked at it as a possible compliment/replacement. WIth the aquistion, we are looking to the roadmap on full integration and are very excited. Trifacta brings a cloud native solution but currently lacks many of the features/functions …
Tableau Prep and Data Guru (Coupa product) are mainly useful in the data prep and blend space. This is useful, but Alteryx provides much more robust analytics potential beyond this in the macro/app space, ML, computer vision, NLP, intelligence suite, prescriptive & predictive …
Alteryx is easier to use and has a lot more advanced analytics capabilities.
Verified User
Employee
Chose Alteryx Platform
Alteryx is way better than Microsoft Excel. It visually lets you do things to the data, one tool at a time. And, you can just delete the tool if it did not do what you were wanting it to do. Excel is a nice app, but Alteryx expands the capability so much more, especially …
Alteryx connects to other data sources easily. It allows you to email from the tool and you can use the predictive analytic features.
Verified User
Team Lead
Chose Alteryx Platform
Alteryx is 100x easier to use for every business user compared to KNIME. KNIME is a great tool for data scientists and programmers, but our business users had a hard time adapting to it. The ease of use of Alteryx is just superior and even my boss is able to build and read …
When we first looked at getting a visualization software for analytics we looked into two options Microsoft Power BI and Tableau Desktop, and even though Power BI is more cost-effective we decided to go with Tableau Desktop as it had more options that we are looking for such as …
Tableau Desktop is older and just better overall. It has more capabilities and is more useful to have. I don't think you could have Alteryx as a standalone product like you can with Tableau Desktop. You'd want another bi tool.
Tableau Desktop is clearly one of the best in the business. It has incredible capabilities, and many features are extremely useful. The intuitiveness of the dashboards and the graphical nature of the visualizations are widely used features and super helpful. One of the other …
Verified User
Manager
Chose Tableau Desktop
- Tableau Desktop is already proven in the market. - Tableau has a very strong user community. - Tableau report is very easy to automate so we can save time for reporting.
I have used Qlik and Microsoft Power BI. Qlik is much less intuitive than Tableau, as it requires more back-end scriptwriting to fully utilize the tool's capabilities. There are few features with Qlik, and less "pop" to the dashboards is creates. Power BI is very lightweight …
Microsoft PowerBI could potentially be a better fit for organizations on Office365, it's a close call though. Google Data Studio has potential but is still far behind Tableau on the "user-friendly" factor. Tableau still seems to dominate for the "recommended" analytics tool, …
Tableau supports more data sources that both Amazon QuickSight and Microsoft Power BI. It also created a much more sophisticated dashboard which is important for leadership and others who use it. However, we use other products like Toad Data Point and Alteryx and tools that …
Tableau is a lot easier to visualize data and the dashboards are more robust. We didn’t use WebFOCUS to its greatest extent but getting up to speed on Tableau was easy. Training is also better in Tableau and the user community is very knowledgeable. We selected it as our …
Tableau is next generation tool where other two are old traditional BI tools Other tools are very slow and difficult to use, and required lot of technical expertise to use them. Tableau's look and feel is much nicer than those two.
Against the usual incumbents within the pharmaceutical industry, Tableau has much better and faster access to database data especially stored in the Oracle database, without needing any interim transformations or data universe needing to be created. Also it has comparatively …
Tableau is a very, very powerful analytics tool that is very flexible with that said there are always some programs that will do specific tasks much better, I would highly suggest Tableau as I use it for marketing analysis, sales reporting and even for analysis on e-commerce …
If any changes had to be made to existing visualizations when we used QlikView, a lot of security constraints existed and I had to run to the IT team for every change I had to implement.
Tableau gives easy security change rights to the developer environment.
I feel like Tableau is easier to use and offers a greater selection of visualizations. I feel that the dashboards are easier to put together and offer a great amount of flexibility for the end-user. Tableau has an excellent user support group. I find the community to be …
My current work environment uses both Tableau Online, MicroStrategy & SSRS in parallel. Tableau is much closer to the SSRS in terms of visualization tool where as MicroStrategy is an enterprise data modeling and reporting tool.
Based on the use case we use different tools. Here …
I have used SSRS, Crystal Reports, Microsoft Excel, and Business Objects. Tableau offers more functionality than the rest and is pretty intuitive. I think SSRS is the easiest to use. Query speed is excellent with SSRS (at least when you are connected to SQL Server). Microsoft …
In comparison to Tableau, the other dashboarding/BI tools I've used feel clunky, are very slow to develop in, and seem to lack features of a more modernized tool like Tableau. In Pentaho Analyzer, for instance, trying to include multiple worksheets or reports in a single …
As far as I know, we do not currently use Domo, however I've seen some demos of their product. Domo is very good with cloud-based software and it also incorporates social media data. Domo is also good at using cloud-based excel file building vs. building spreadsheets on my …
Renowned digital analytics consultant, innovator, speaker, thought leader
Chose Tableau Desktop
I haven't used other tools for a number of years - when I made the selection my criteria were ease of use (including, slicing & dicing data at will), connectivity to various data sources (especially REST API - which Tableau doesn't support natively but now has a way to use …
Cass evaluated Domo, QlikView and Birst prior to selecting Tableau. It came down to cost (and by a significant margin); the others have relatively high implementation, hosting and other costs. Additionally, based on a recent Gartner "Magic Quadrant", Tableau exceeds all others …
I had the trial version of Tableau Desktop downloaded, installed, configured and was creating meaningful dashboards in almost 15 minutes. While other software we used had great features, none of them were able to compare with this trial experience. Tableau's user forums were …
Verified User
Engineer
Chose Tableau Desktop
Python is programming tools, while Tableau is an easy to use drag and drop data visualization tool. This may not be an apple to apple comparison. Compared to Excel, Tableua is way over the top when it comes to data visualization.
Tableau is by far the superior product when it comes to analysis, ease of use, and end user experience. People are usually more familiar with Excel so it can be difficult to break them out of their comfort zone. Lastly, when it comes to subscriptions, SSRS is the tool I prefer. …
Tableau Server is extremely well suited for a company with a few dedicated analysts creating dashboards and reports for a few stakeholders. It is also great at handling a large number of report viewers, but it is more expensive because you have to pay for each user. We have …
The choice to use Tableau Server is really made for you if you already have adopted Tableau Desktop. If you're focused on an on-premise solution, Tableau is probably the way that you'll have to go. Looker and Mode are cloud-based (so is Tableau Online) and offer a true …
There were a lot of reasons why we chose Tableau and the least is the cost but also the way Tableau stores data in the columnar fashion instead of in Cubes. We went through a painstaking selection process and at the end, came down to a couple of vendors and we ended up with the …
We still use Microsoft Excel for much of the lighter, day-to-day pivot tables or calculations. We see Tableau as the future however and are slowly tying more and more of our standard work with Tableau. Smartsheet isn't a 1:1 example, but it was considered for importing …
Tableau is a stable and time tested product which can handle hundreds and thousands of users and a huge amount of content, plus tableau has also introduced a web authoring tool which you can [use to] edit dashboards using your browser.
I did not choose Tableau for my organization, but did choose my organization in part because they use Tableau! Fantastic flexibility combined with relative ease of visualization.
A comprehensive proof of concept study done. We evaluated different vendors and also consider strategic reports (like Gartner) to make a decision. Tableau was the winner. The developers especially liked it, because integrating it to the existing system was very easy.
Sisense was another tool I came across, but I chose Tableau over Sisense as an end-to-end tool for data visualisation and BI. Tableau is the complete data visualisation tool, which is what I was looking for. So, I chose Tableau. Plus, it's easy to use and there are no complex …
Tableau is better than Splunk in analyzing the unstructured data and displaying all relevant information to the user. I have used Splunk but it does not provide the information of every component of a system, it just drills down to log analytics. Tableau is beyond Splunk, as …
QlikView, Tibco Spotfire, SAS, and SAP. At the time, all cost more than Tableau for our (small) needs, SAS and SAP were in some ways overqualified in terms of breadth, and none of them had the ease of use of Tableau.
Tableau Server has many competitors, two primary ones would be SAP Business Objects and Microsoft PowerView through Tabular Analysis Services. I have worked with all three products. First and foremost, in terms of data visualization Tableau is the best by far. However there are …
This search turned up a number of candidates. I think the main alternative considered was SiSense. Tableau Server with Tableau Desktop was the most expensive solution but I was convinced it actually represented the best value.
Tableau by far has the most intuitive interface and best out of the box looks for presentation. The speed of development and ease of development is unbeatable.
QlikView can't connect to live data (in general) Licensing Costs of QlikView and Cognos are expensive. Cognos doesn't have excellent Graphics embedded within the tool
I've personally have used a vast majority of the Business Intelligence products on the marketplace. I've used all of the Oracle products over the past few years. I've used all of the products in the Microsoft stack, along with Cognos, Qlikview, etc. Each are effective if your …
Sr. Data Analyst and Tableau SME for North America
Chose Tableau Server
We also looked at Spotfire and Qilkview
Verified User
Administrator
Chose Tableau Server
Three "self service" BI tools were looked at: Tableau, Spotfire & Qlikview. To put it very simply, Spotfire had a lot of overlap with a tool that was already present at the bank, SAS. QlikView's biggest negative was that everything was brought in via RAM, and there are gigantic …
I would 100% recommend Alteryx to a friend, for me its friendly interface is the best, it has all the tools I need without the headache that programming is. It can be used for simple or complex analysis, so honestly, I don’t see a scenario where it wouldn’t suit. I’ve used Alteryx to make simple things I could do in Excel, for example, but it was less complex and faster to do in Alteryx, so why not? Its a very versatile tool.
The best scenario is definitely to collect data from several sources and create dedicated dashboards for specific recipients. However, I miss the possibility of explaining these reports in more detail. Sometimes, we order a report, and after half a year, we don't remember the meaning of some data (I know it's our fault as an organization, but the tool could force better practices).
Whole funnel and specific channel performance from upper to lower funnel metrics. The ability to view full channel performance for some time, such as weekly, monthly, or quarterly, has truly been monumental in how my team optimizes specific channels and campaigns. Daily performance tracking is a bit overwhelming, with load times and having to refresh specific live views over time. It can be challenging to do so at times, as extensive dashboards take much longer to load.
Pulling data from multiple disparate data sources.
Allows users to see the data at every step of the workflow to be able to cleanse, analyze, and optimize the data.
Provides an analytics platform that is easy for users of all levels to thrive in whether they are just starting out in their analytics journey or they have a master's degree in Data Science.
An excellent tool for data visualization, it presents information in an appealing visual format—an exceptional platform for storing and analyzing data in any size organization.
Through interactive parameters, it enables real-time interaction with the user and is easy to learn and get support from the community.
It's good at doing what it is designed for: accessing visualizations without having to download and open a workbook in Tableau Desktop. The latter would be a very inefficient method for sharing our metrics, so I am glad that we have Tableau Server to serve this function.
Publishing to Tableau Server is quick and easy. Just a few clicks from Tableau Desktop and a few seconds of publishing through an average speed network, and the new visualizations are live!
Seeing details on who has viewed the visualization and when. This is something particularly useful to me for trying to drive adoption of some new pages, so I really appreciate the granularity provided in Tableau Server
Steeper Learning Curve: Alteryx can have a steep learning curve for users who are new to the platform or have limited experience with data analytics. Enhancements to the user interface and user onboarding resources could help make the learning process more intuitive and accessible to a wider range of users.
Enhanced Data Visualization Capabilities: Alteryx offers basic data visualization capabilities, but there is room for improvement in terms of advanced visualizations and interactive dashboarding features. Adding more sophisticated chart types, interactive widgets, and customization options would enhance the data visualization capabilities within the platform.
Improved Error Handling and Debugging: Alteryx provides error handling mechanisms, but enhancing the error reporting and debugging capabilities would be beneficial. Improved error messages, better visibility into data flow, and debugging tools could help users troubleshoot and resolve issues more efficiently.
Tableau Server has had some issue handling some of our larger data sets. Our extract refreshes fail intermittently with no obvious error that we can fix
Tableau Server has been hard to work with before they launched their new Rest API, which is also a little tricky to work with
We've developed a working partnership with Alteryx. As an enablement suite, we're continuing to innovate and deliver great products with use of Alteryx in our solutions. Alteryx use expands to our global product development teams and is in use in multiple parts of our organization. Alteryx also delivers Experian demographic content to other clients in their product offering. We're highly likely to renew, but that decision is way above my pay grade.
Our use of Tableau Desktop is still fairly low, and will continue over time. The only real concern is around cost of the licenses, and I have mentioned this to Tableau and fully expect the development of more sensible models for our industry. This will remove any impediment to expansion of our use.
It simply is used all the time by more and more people. Migrating to something else would involve lots of work and lots of training. The renewal fee being fair, it simply isn't worth migrating to a different tool for now.
I've found that while some things might take a little longer to create, the flexibility of Alteryx allows you to perform any function needed. I haven't found a use that was not available in Alteryx yet. APIs and XMLs can be created to perform certain functions. In addition, CMD line commands can be sent using Alteryx to perform certain functions as well.
Tableau Desktop has proven to be a lifesaver in many situations. Once we've completed the initial setup, it's simple to use. It has all of the features we need to quickly and efficiently synthesize our data. Tableau Desktop has advanced capabilities to improve our company's data structure and enable self-service for our employees.
Tableau Server takes training and experience in order to unlock the application's full potential. This is best handled by a qualified data scientist or data analytics manager. Tableau user interface layout, nomenclature, and command structure take time and training to become proficient with. Integration and connectivity require proper IT developer support.
I use many programs and compared to others, Alteryx virtually never goes down, freezes up or gives an application error. Over a 4 year time period that I have used this program, any of these may have happened 3 times. It is an incredibly stable program that I feel completely confident in.
When used as a stand-alone tool, Tableau Desktop has unlimited uptime, which is always nice. When used in conjunction with Tableau Server, this tool has as much uptime as your server admins are willing to give it. All in all, I've never had an issue with Tableau's availability.
Our instance of Tableau Server was hosted on premises (I believe all instances are) so if there were any outages it was normally due to scheduled maintenance on our end. If the Tableau server ever went down, a quick restart solved most issues
I already gave the example of journal entries created in less than a second. What else can I tell you about.... I can tell you those 2 journal entries have historically had to be split into separate accounting systems so the outputs had to be very different (D365 vs Intacct) such that they are exactly ready for uploading. I can tell you I used to have some tire and battery queries hitting a line item detail table and they took hours to run UNTIL I asked IT for a view in SQL and now they're ready in about 5 minutes total. I guess I'd say if anything does take a long time - do some research with others and figure out what would speed them up
Tableau Desktop's performance is solid. You can really dig into a large dataset in the form of a spreadsheet, and it exhibits similarly good performance when accessing a moderately sized Oracle database. I noticed that with Tableau Desktop 9.3, the performance using a spreadsheet started to slow around 75K rows by about 60 columns. This was easily remedied by creating an extract and pushing it to Tableau Server, where performance went to lightning fast
While there are definitely cases where a user can do things that will make a particular worksheet or dashboard run slowly, overall the performance is extremely fast. The user experience of exploratory analysis particularly shines, there's nothing out there with the polish of Tableau.
Stellar, bar-none. Some of the best support folks of any vendor. The Alteryx Community is the most responsive and supportive. On the rare occasion of a release issue or bug, we've been able to get quick help to solve the core problem. Alteryx does not play the blame game. They genuinely help the users solve their issues or respond to questions
Tableau support has been extremely responsive and willing to help with all of our requests. They have assisted with creating advanced analysis and many different types of custom icons, data formatting, formulas, and actions embedded into graphs. Tableau offers a weekly presentation of features and assists with internal company projects.
We have consistently had highly satisfactory results every time we've reached out for help. Our contractor, used for Tableau server maintenance and dashboard development is very technically skilled. When he hits a roadblock on how to do something with Tableau, the support staff have provided timely and useful guidance. He frequently compares it to Cognos and says that while Cognos has capabilities Tableau doesn't, the bottom line value for us is a no-brainer
1st level of trainings which I've attended in Paris was easy and I was already knowing %90, that learning could have been an e-learning instead of in-person
It is admittedly hard to train a group of people with disparate levels of ability coming in, but the software is so easy to use that this is not a huge problem; anyone who can follow simple instructions can catch up pretty quickly.
In our case, they hired a private third party consultant to train our dept. It was extremely boring and felt like it dragged on. Everything I learned was self taught so I was not really paying attention. But I do think that you can easily spend a week on the tool and go over every nook and cranny. We only had the consultant in for a day or two.
Very good, detailed online trainings which you can take at your own pace, and strong certifications exists, certifications are extremely detailed and hard...
I think the training was good overall, but it was maybe stating the obvious things that a tech savvy young engineer would be able to pick up themselves too. However, the example work books were good and Tableau web community has helped me with many problems
The Tableau website is full of videos that you can follow at your own pace. As a very small company with a Tableau install, access to these free resources was incredibly useful to allowing me to implement Tableau to its potential in a reasonable and proportionate manner.
There is really not much to it (the installation, that is). Once you get it installed, along with any of the add-ons (demographics, R, etc.), you are up and running almost immediately. There is really no additional setup. You can immediately begin blending data, running demographics, performing spatial queries, running predictive analysis, etc. And for many of these functions, the learning curve is quite easy.
Again, training is the key and the company provides a lot of example videos that will help users discover use cases that will greatly assist their creation of original visualizations. As with any new software tool, productivity will decline for a period. In the case of Tableau, the decline period is short and the later gains are well worth it.
Implementation was over the phone with the vendor, and did not go particularly well. Again, think this was our fault as our integration and IT oversight was poor, and we made errors. Would they have happened had a vendor been onsite? Not sure, probably not, but we probably wouldn't have paid for that either
Alteryx is MUCH more user friendly. both provide the ability to code within them, but Alteryx has much nicer interface. The formula tools have a more simple language that is easier to learn than formulae in SSIS. Alteryx is easy to read with multi colored tools identifying what each one does. It also allows for macros. You can build your own tool to process records of data or batch records together.
I have used Power BI as well, the pricing is better, and also training costs or certifications are not that high. Since there is python integration in Power BI where I can use data cleaning and visualizing libraries and also some machine learning models. I can import my python scripts and create a visualization on processed data.
Today, if my shop is largely Microsoft-centric, I would be hard pressed to choose a product other than Power BI. Tableau was the visualization leader for years, but Microsoft has caught up with them in many areas, and surpassed them in some. Its ability to source, transform, and model data is superior to Tableau. Tableau still has the lead in some visualizations, but Power BI's rise is evidenced by its ever-increasing position in the leadership section of the Gartner Magic Quadrant.
Individual analysts can quickly generate results using their own copy of Alteryx Designer. But using the Server and developing macros for more complex needs can be time consuming.
Tableau Desktop's scaleability is really limited to the scale of your back-end data systems. If you want to pull down an extract and work quickly in-memory, in my application it scaled to a few tens of millions of rows using the in-memory engine. But it's really only limited by your back-end data store if you have or are willing to invest in an optimized SQL store or purpose-built query engine like Veritca or Netezza or something similar.
Error handling - allows controls to be built into workflows easily and allows them to be isolated and spat into control reports that can be easily reviewed and audited, thanks to the ability to create multiple outputs in one go.
Time-saving - saved huge amounts of time, especially when moving Excel processes into Alteryx.
Product development - allowed my firm to create products that we have been able to market and sell to clients.
Tableau was acquired years ago, and has provided good value with the content created.
Ongoing maintenance costs for the platform, both to maintain desktop and server licensing has made the continuing value questionable when compared to other offerings in the marketplace.
Users have largely been satisfied with the content, but not with the overall performance. This is due to a combination of factors including the performance of the Tableau engines as well as development deficiencies.
Tableau does take dedicated FTE to create and analyze the data. It's too complex (and powerful) a product not to have someone dedicated to developing with it.
There are some significant setup for the server product.
Once sever setup is complete, it's largely "fire and forget" until an update is necessary. The server update process is cumbersome.