AppNeta provides performance monitoring solutions for distributed, cloud-connected, digital enterprises. AppNeta’s SaaS-based solutions give IT teams application and network performance data, allowing them to constantly monitor user experience across any application, network, data center or cloud.
N/A
Catchpoint
Score 8.8 out of 10
N/A
Catchpoint is an Internet Resilience solution offering services for retailers, Global2000, CDNs, cloud service providers, and xSPs that help increase their resilience by catching any issues in the Intenet Stack before they impact their business.
$10,000
per year
New Relic
Score 7.9 out of 10
N/A
New Relic is a SaaS-based web and mobile application performance management provider for the cloud and the datacenter. They provide code-level diagnostics for dedicated infrastructures, the cloud, or hybrid environments and real time monitoring.
$0
No credit card required; 100 GB free ingest per month, 1 free full user + unlimited basic users, 8 days retention, 100 Synthetics Checks
Pricing
AppNeta
Catchpoint
New Relic
Editions & Modules
No answers on this topic
No answers on this topic
Free (Forever)
$0
No credit card required; 100 GB free ingest per month, 1 free full user + unlimited basic users, 8 days retention, 100 Synthetics Checks
Telemetry Data Platform
$0.25
per month per extra GB data ingest (after first free 100GB per month)
Incident Intelligence
$0.50
per month per event (after first 1000 free events per month)
Standard
$99
per month per full user (after first free full user - unlimited free basic users)
Pro
Contact sales team
Enterprise
Contact sales team
Offerings
Pricing Offerings
AppNeta
Catchpoint
New Relic
Free Trial
No
No
No
Free/Freemium Version
No
No
Yes
Premium Consulting/Integration Services
No
No
No
Entry-level Setup Fee
No setup fee
No setup fee
No setup fee
Additional Details
—
- White glove migration services
- Annual subscription
- Professional Services
- Competitive Benchmarking
Catchpoint is much easier to create/maintain monitors than in Business Process Monitors. Catchpoint is also easier to administer and report on monitors than Business Process monitors. We migrated from Keynote to Catchpoint because of the significant deficiencies in Keynote …
Datadog is good, but more expensive. New Relic is good but does not provide the same features as Catchpoint does. Checkly is good, but Catchpoint offers different frameworks to create synthetic tests, which is preferable to my engineering team.
Catchpoint stood out for its synthetic monitoring depth, real user insights, and internet/network performance monitoring, making it ideal for businesses reliant on global digital services.
Compare Catchpoint with the side score, Catchpoint gives us some more feasibility regarding monetary as point provides both agent based and agent less monitoring, but side to provide us some agent with monetary, so that’s the major difference between both these tools. Also …
Catchpoint is great for Synthetic monitoring, alerting, general internet reporting, and fully understanding all types of data around edge services. They don't do a lot of internal tracing or application monitoring right now, but we have leveraged their Enterprise servers within …
Catchpoint is the trusted solution for monitoring our application. It provides an intuitive UI create monitoring screens for all of our rest endpoints and web UI. The email alerts send out by Catchpoint are so detailed and visually clear. We were able to figure out the time of …
Catchpoint has many more testing nodes around the world at all levels of the internet. Their analysis of the test results is much more extensive and provides value to the operations staff supporting the site all the way to the developer who will want the specific detailed …
With Catchpoint, synthetic capabilities seem to be superior and the results are easier to understand.
New Relic
Verified User
Engineer
Chose New Relic
Even though Catchpoint is an excellent tool when it comes to synthetics and end-user monitoring, also Amazon CloudWatch is a very good tool for monitoring cloud infrastructure, New Relic gives a complete solution of full-stack monitoring along with the features provided by …
I tried AppNetta, Capterra, and a few similar commercial tools when evaluating APM solutions, but NewRelic is so well integrated with so many services and pieces of software that it would have taken a lot more time to implement and support another solution. New Relic worked out …
Tracelytics was a great product, but data retention was lacking as was enterprise level features. The ability to pay per trace instead of per server was a great help in financing, but in the end the data wasn't available long enough to perform historical analysis and therefore …
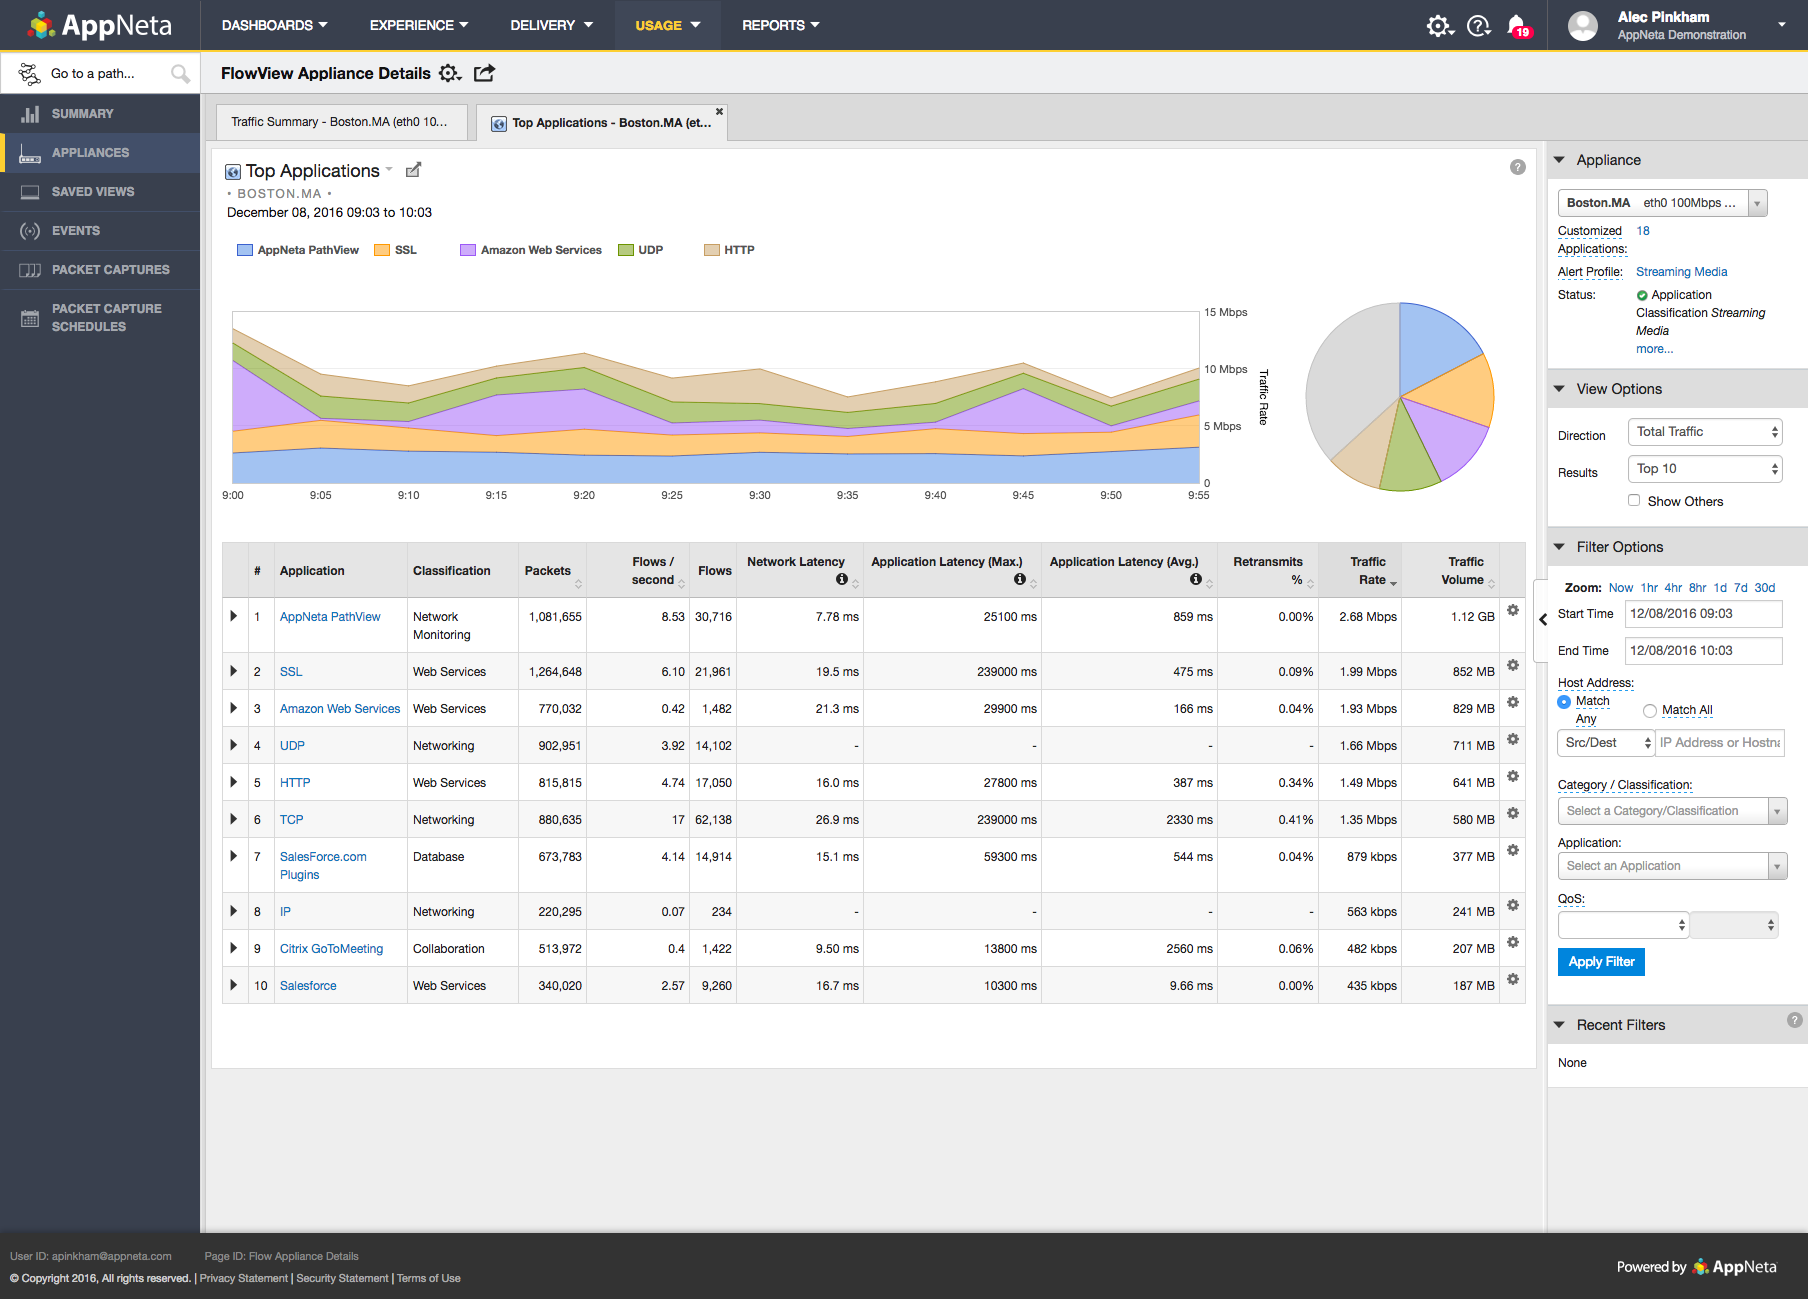
AppNeta is awesome for getting site-to-site statistics or trying to find out why at 3 am every night, this server loses connectivity to another server in a different data center. But we have found the multiple bugs in the hardware hard to deal with when the devices are a 4-hour plane ride away and require someone to console into the device.
I like the synthetic test feature it has from the edge which mimics the real user - that for me is one of the best features. The certificate expiration, the API monitoring, the slowness breakdown to show where the slowdown happens, and more.
New Relic its an excellent tool for monitoring services used on the SAAS universe, like web servers, relational and nosql dbms, reverse proxies, text databases, etc. Its also a powerful tool to monitor resource usage on said servers. However, its not well fitted to monitor custom services - if you need to generate alerts based on logs or database information, for example
Our standard operating material documents Catchpoint’s breadth on HTTP/Browser, API, Streaming, DNS, FTP, TCP, SMTP, Ping, Traceroute, SSH with content validation and custom widgets/dashboards. This gives SREs and L0/L1 a single place to validate both page flows and the underlying network/application protocols.
Product runbooks use Catchpoint to validate critical steps (for ex, login, overview dashboard, unit dashboards) and to detect DNS issues that break those journeys. so we catch experience regressions even when the backend looks healthy.
We’ve standardized Catchpoint alert categories/templates with ITSM so L0 includes the right analysis in handoffs. This tightened “first message, best message” during incidents.
Our operating procedures use Catchpoint for alwayson availability checks with email notifications and multi‑location verification when a site is down. This is useful for unambiguous “is it up/where is it failing” signals.
Missing Functionality: For our organisation, we use multiple observability tools and what we miss in Catchpoint is its ability to display a list of muted monitors in the dashboard. This was a business requirement for our company where the business wanted to know at any given point of time, a list of monitors that were muted during an outage or a scheduled maintenance. This feature was unavailable in Catchpoint, however, we hope to see some enhancements in the future.
And while powerful, building tailored dashboards with organ-specific metrics (such as energy load variance across regions) can be difficult to navigate. The UI isn't as drag-and-drop easy, and query-based widgets typically involve some trial and error for non-devs.
Alerts may be hypersensitive or over general. I We often get a spam of non-critical alerts while doing load testing, all overhauling to me alone and making it difficult to identify actual issues especially in energy systems where spikes are very common.
With our expanding fleet of Iot devices, the per-host pricing model is becoming expensive, quickly. More detailed billing based on microservices, or that works at sensor level, would make it more adaptable for energy platforms.
The Catchpoint tool has now become an integral part of our DevOps toolkit due to its extensive range of capabilities, including application performance monitoring, network health tracking, DNS visibility, and edge performance analysis. Its seamless integration with our existing monitoring infrastructure has significantly enhanced our ability to detect potential issues proactively, analyze root causes in real time, and resolve incidents much faster, ultimately improving overall system reliability and user experience.
The only issue that we have had with New Relic is that the price might be a little expensive for smaller companies. The amount of data you store in New Relic impacts the cost, and can get away from you if you don't work closely with the vendor. Overall though the application is top notch.
It's hard to find the functionalities that I am looking for in the application. Even if I did something in the past, after a time I have to re-learn again where the functionalities are. This is a powerful tool, but not user-friendly. Texts in the buttons and menus are not always meaningful or easily comprehensible.
I have given this much rating as I am used New Relic in different sectors and for different use cases like its K8s monitoring, infra monitoring, full stack monitoring as compare to other tools New Relic gives data in a formatted and connected way, and also it is giving us value for money. It also launches new features day by day which helps users to track the issue very quickly. It also supports OTel integrations which is the latest trend of observability tools. thats why I had given this much rating to New Relic.
The customer support is fantastic as they keep you updated and follow up even though we may not even follow up. Make sure they send a communication so that we remain updated. They value engineers who will get on a call with you to understand any requirement we have on any test, and they bring in the best developers on call.
The support team has been really helpful and resolved most of the issues on time. However, for a couple of issues, several follow-ups were needed to elicit a reasonable response. The issue was deeply technical and could have been investigated only by their Architects, and bringing them into the ticket took longer than needed
It's better to start by implementing New Relic in one project and test everything. Try to follow best recommended practices and read all the official documentation. Everything seems well tested. Then, start by installing agents to the rest of your projects and keep a close look to all logs and metrics New Relic gives you.
Smart Bear Foglight Dynatrace CEM Catchpoint: I have used many synthetic monitoring products. Honestly, there are no big differences in features among all the products listed above or that I have used before. Probably, price and support might play big roles in selecting the products. I do not know the prices of these products.
Data Dog has solutions that look more attractive, but not at their price point. We have also tried to build a solution straight from the Cloud, where our business is built, but some things are too hard to replicate. This shows that New Relic is useful and helps our efficiency.
Catchpoint is not the only monitoring tool we use for our web properties. The test alerts raised by Catchpoint serves as a confirmation of possible outages/problems with an application. This has helped to reduce false-positive alerts thus improving the response of the operations team; they don't have spend time chasing ghosts
The unlimited scheduled tests we can run on the enterprise nodes has been a very cost effective solution compared to similar web monitoring tools
The ability to quickly dive into the test result details help to get to the root cause of a test failure quickly