BIME Analytics (discontinued) vs. Looker

Overview
ProductRatingMost Used ByProduct SummaryStarting Price
BIME Analytics (discontinued)
Score 7.0 out of 10
Mid-Size Companies (51-1,000 employees)
BIME, which was acquired by Zendesk, was a customer analytics platform that helped businesses measure and understand the customer experience from customer data. The product has been discontinued.
$490
Per Month (Billed Annually)
Looker
Score 8.2 out of 10
N/A
Looker is a BI application with an analytics-oriented application server that sits on top of relational data stores. It includes an end-user interface for exploring data, a reusable development paradigm for data discovery, and an API for supporting data in other systems.N/A
Pricing
BIME Analytics (discontinued)Looker
Editions & Modules
Base Plan
$490
Per Month (Billed Annually)
Big Data
$690
Per Month (Billed Annually)
No answers on this topic
Offerings
Pricing Offerings
BIME Analytics (discontinued)Looker
Free Trial
YesYes
Free/Freemium Version
NoNo
Premium Consulting/Integration Services
YesYes
Entry-level Setup FeeNo setup feeRequired
Additional DetailsMust contact sales team for pricing.
More Pricing Information
Community Pulse
BIME Analytics (discontinued)Looker
Considered Both Products
BIME Analytics (discontinued)

No answer on this topic

Looker
Chose Looker
  • Birst: very opaque for teams accustomed to DevOps (i.e., programmable infrastructure)
  • Tableau: no cloud strategy. Does not scale horizontally
  • GoodData: flexible, but cumbersome. Requires Java
Top Pros
Top Cons
Features
BIME Analytics (discontinued)Looker
BI Standard Reporting
Comparison of BI Standard Reporting features of Product A and Product B
BIME Analytics (discontinued)
10.0
1 Ratings
20% above category average
Looker
8.1
95 Ratings
1% below category average
Customizable dashboards10.01 Ratings8.894 Ratings
Report Formatting Templates10.01 Ratings7.980 Ratings
Pixel Perfect reports00 Ratings7.679 Ratings
Ad-hoc Reporting
Comparison of Ad-hoc Reporting features of Product A and Product B
BIME Analytics (discontinued)
9.3
1 Ratings
14% above category average
Looker
8.1
95 Ratings
0% below category average
Drill-down analysis8.01 Ratings8.292 Ratings
Formatting capabilities10.01 Ratings7.493 Ratings
Report sharing and collaboration10.01 Ratings8.695 Ratings
Integration with R or other statistical packages00 Ratings8.038 Ratings
Report Output and Scheduling
Comparison of Report Output and Scheduling features of Product A and Product B
BIME Analytics (discontinued)
10.0
1 Ratings
18% above category average
Looker
8.6
91 Ratings
3% above category average
Publish to Web10.01 Ratings8.575 Ratings
Publish to PDF10.01 Ratings8.781 Ratings
Report Delivery Scheduling10.01 Ratings8.981 Ratings
Report Versioning00 Ratings8.261 Ratings
Data Discovery and Visualization
Comparison of Data Discovery and Visualization features of Product A and Product B
BIME Analytics (discontinued)
10.0
1 Ratings
21% above category average
Looker
6.8
92 Ratings
17% below category average
Pre-built visualization formats (heatmaps, scatter plots etc.)10.01 Ratings8.190 Ratings
Location Analytics / Geographic Visualization10.01 Ratings7.579 Ratings
Predictive Analytics00 Ratings4.66 Ratings
Access Control and Security
Comparison of Access Control and Security features of Product A and Product B
BIME Analytics (discontinued)
10.0
1 Ratings
15% above category average
Looker
8.5
91 Ratings
1% below category average
Multi-User Support (named login)10.01 Ratings8.986 Ratings
Role-Based Security Model10.01 Ratings8.379 Ratings
Multiple Access Permission Levels (Create, Read, Delete)00 Ratings8.686 Ratings
Report-Level Access Control00 Ratings8.427 Ratings
Mobile Capabilities
Comparison of Mobile Capabilities features of Product A and Product B
BIME Analytics (discontinued)
10.0
1 Ratings
23% above category average
Looker
5.8
67 Ratings
31% below category average
Responsive Design for Web Access10.01 Ratings6.764 Ratings
Dashboard / Report / Visualization Interactivity on Mobile10.01 Ratings6.559 Ratings
Mobile Application00 Ratings5.01 Ratings
Best Alternatives
BIME Analytics (discontinued)Looker
Small Businesses
BrightGauge
BrightGauge
Score 8.9 out of 10
BrightGauge
BrightGauge
Score 8.9 out of 10
Medium-sized Companies
Reveal
Reveal
Score 9.9 out of 10
Reveal
Reveal
Score 9.9 out of 10
Enterprises
Jaspersoft Community Edition
Score 9.7 out of 10
Jaspersoft Community Edition
Score 9.7 out of 10
All AlternativesView all alternativesView all alternatives
User Ratings
BIME Analytics (discontinued)Looker
Likelihood to Recommend
7.0
(1 ratings)
8.4
(96 ratings)
Likelihood to Renew
-
(0 ratings)
9.0
(4 ratings)
Usability
-
(0 ratings)
8.8
(12 ratings)
Support Rating
-
(0 ratings)
8.8
(14 ratings)
User Testimonials
BIME Analytics (discontinued)Looker
Likelihood to Recommend
Discontinued Products
Well suited if you need to create multiple reports and send them out easily to multiple clients. It is not well suited if you need a lot of data sources. It slows the product way down and makes reports take forever to load.
Read full review
Google
Quick dashboards from Google Sheets - Easier to do the graphs than in Google Sheets - Operational dashboards to be used in the day-to-day work - It is good both for retrospective data and to do a pulse check of the current status - Better for not giant amounts of data and not multiple data sources. - If you need a lot of graphs to be displayed on the same page, it can be a bit glitchy during configuration (then the use works fine).
Read full review
Pros
Discontinued Products
  • Easy to create reports
  • Easy to edit
  • Easy to customize
Read full review
Google
  • Filtering - you can filter across different dimensions and metrics to get a more specific "cut" of data
  • Refreshing - data automatically ingests into Looker which allows reports to be updated and backfilled in real time
  • Conditional Reporting - you can leverage Looker's reporting features to flag when a given metric or KPI falls below or above a specified threshold. For example, if you had a daily sales benchmark in a SAAS organization, you could use Looker to flag whenever daily sales falls above or below the benchmark
Read full review
Cons
Discontinued Products
  • It was SLOW!
  • Some of the graphs can be confusing
  • Not really set up for a single vertical company.
Read full review
Google
  • Looker is less graphical or pictorial which makes it less attractive
  • Consumes a lot of memory when there are multiple rows and columns, impacts performance too
  • At times when we download huge chunks of raw data from Looker dashbords, the time taken to prepare the file is enormous - The user fails to understand if Looker has frozen or if the data is getting prepared in the background for downloading. In turn, user ends up triggering multiple downloads
Read full review
Likelihood to Renew
Discontinued Products
No answers on this topic
Google
We've been very happy with Looker so far, and all teams in the organization are starting to see its value, and use it on a frequent basis. It has quickly become our accessible "source of truth" for all data/metrics.
Read full review
Usability
Discontinued Products
No answers on this topic
Google
Looker is relatively easy to use, even as it is set up. The customers for the front-end only have issues with the initial setup for looker ml creations. Other "looks" are relatively easy to set up, depending on the ETL and the data which is coming into Looker on a regular basis.
Read full review
Support Rating
Discontinued Products
No answers on this topic
Google
Never had to work with support for issues. Any questions we had, they would respond promptly and clearly. The one-time setup was easy, by reading documentation. If the feature is not supported, they will add a feature request. In this case, LDAP support was requested over OKTA. They are looking into it.
Read full review
Alternatives Considered
Discontinued Products
BIME was more accurate with sending out reports than RavenTools, and had a lot more customizable options. GDS has suited us well though, because it integrates with a lot of different platforms and allows us to deliver our reporting for no additional cost.
Read full review
Google
Looker is an off-the-shelf, free tool for Google business users. Other than the internal cost of time to build, we had no costs to set up what we needed to do. Knowledge sharing internally and using templates greatly reduced this cost, making the overall cost very low.
Read full review
Return on Investment
Discontinued Products
No answers on this topic
Google
  • Allowing others to self-serve their own analytics and connect it to Looker simply and easily has helped unblock the central data team so they can instead focus on validated dashboards whilst stakeholders manage their day-to-day analysis themselves. Countless engineering hours have been freed up by not having to manage every user permission for each BI tool; we have a BYOBI approach; Bring Your Own BI
  • Creation and management of a semantic layer (LookML =Looker Modeling Language ) allows peoples sandboxes and production databases to become clutter free. Minor adjustments, conditional fields, and even some modelling can all be done in LookML which doesn't need oversight or governance from the central data team.
  • LookML, specifying drilldown fields and their sub-queries, as well as generally creating dynamic parameters with Liquid are all great features, but can have a steep learning curve. it may take some time to understand how to create this middle layer correctly, or even pose a risk of inheriting complex code from another source which can be unmaintainable if it becomes too big. Some level of governance is recommended if Looker is used by a large number of editors.
Read full review
ScreenShots

BIME Analytics (discontinued) Screenshots
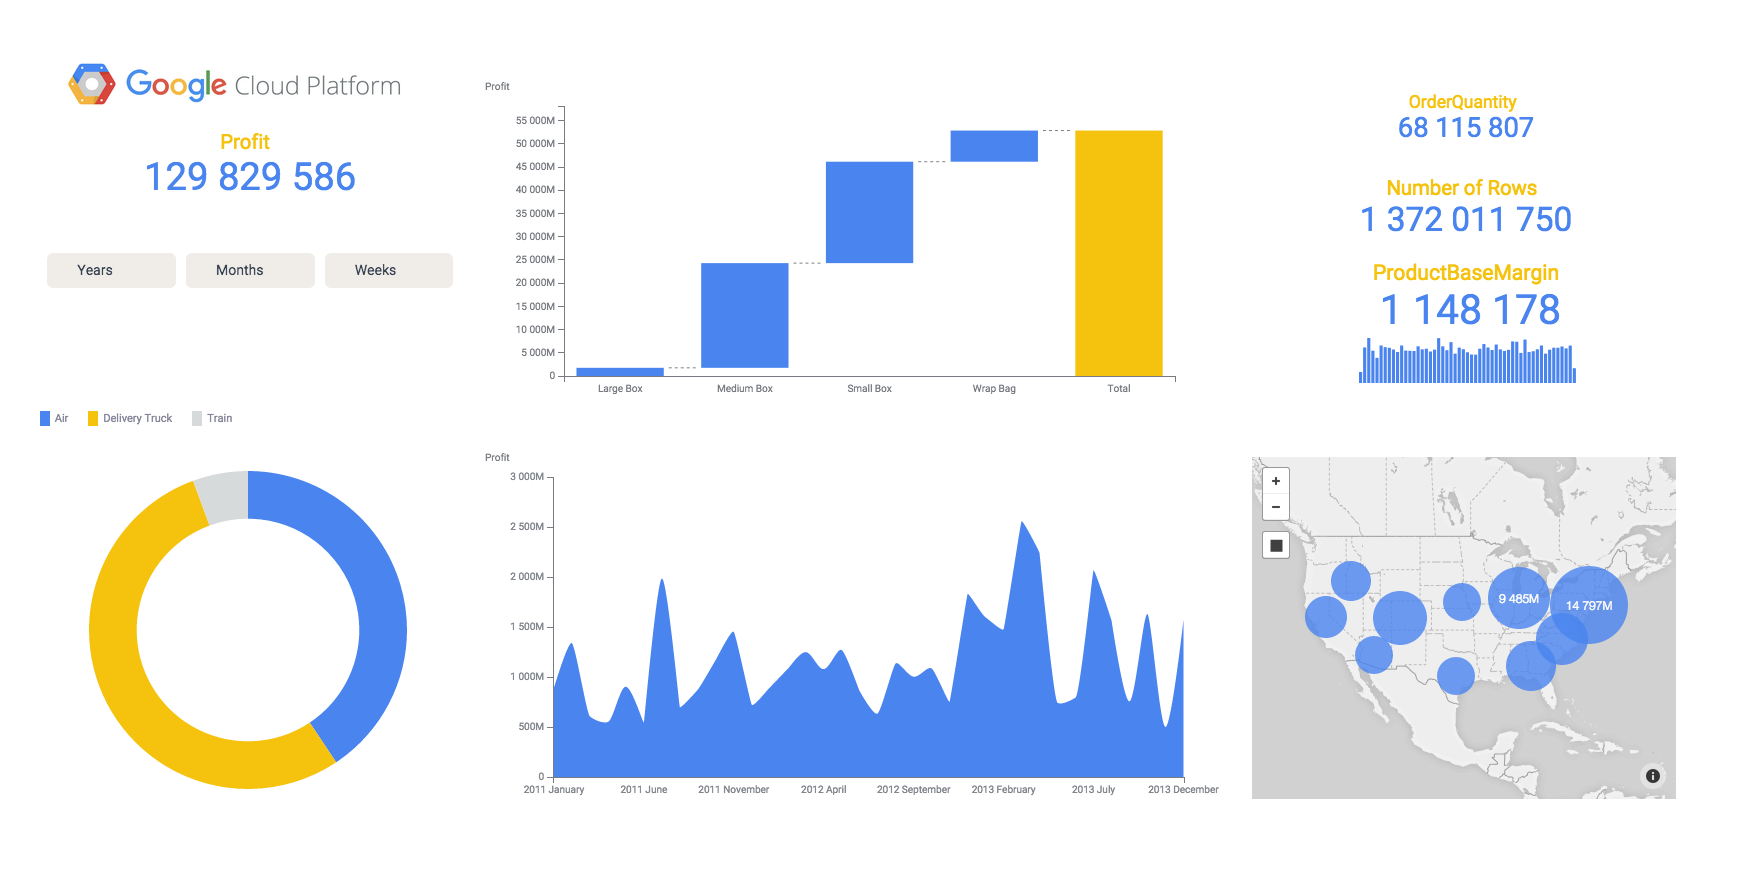
Screenshot of Screenshot of Screenshot of Screenshot of Screenshot of

Looker Screenshots

Screenshot of a Looker dashboard with a geo chart.