

Anaplan - great tool for almost any use case
We use Anaplan for many use cases, including FP&A, Forecasting, Demand Planning, Portfolio Management, Sales Reps performance and …
Anaplan is a transformative way to see, plan, and run your business. Using its proprietary Hyperblock™ technology, Anaplan lets you contextualize real-time performance, and forecast future outcomes for faster, confident decisions. Anaplan enables connected strategy and planning across your enterprise…
Products that are considered exceptional by their customers based on a variety of criteria win TrustRadius awards. Learn more about the types of TrustRadius awards to make the best purchase decision. More about TrustRadius Awards


Anaplan is a transformative way to see, plan, and run your business. Using its proprietary Hyperblock™ technology, Anaplan lets you contextualize real-time performance, and forecast future outcomes for faster, confident decisions. Anaplan enables connected strategy and planning across your…
112 people also want pricing
Kepion is a cloud planning & analytics software company that connects all organizations' teams under a single view of their business performance. We enable more intelligent decisions to be made by companies about their financial and operational future. Kepion global offices and partners deliver…
PlanGuru is budgeting, forecasting and financial analytics software for SMB's, Nonprofits and the Accountants/ Advisors that work with them.


| Deployment Types | Software as a Service (SaaS), Cloud, or Web-Based |
|---|---|
| Operating Systems | Unspecified |
| Mobile Application | Apple iOS, Android, Mobile Web |
| Supported Countries | All countries |
| Supported Languages | Multi-lingual support |
| Consumers | 0% |
|---|---|
| Small Businesses (1-50 employees) | 0% |
| Mid-Size Companies (51-500 employees) | 10% |
| Enterprises (more than 500 employees) | 90% |
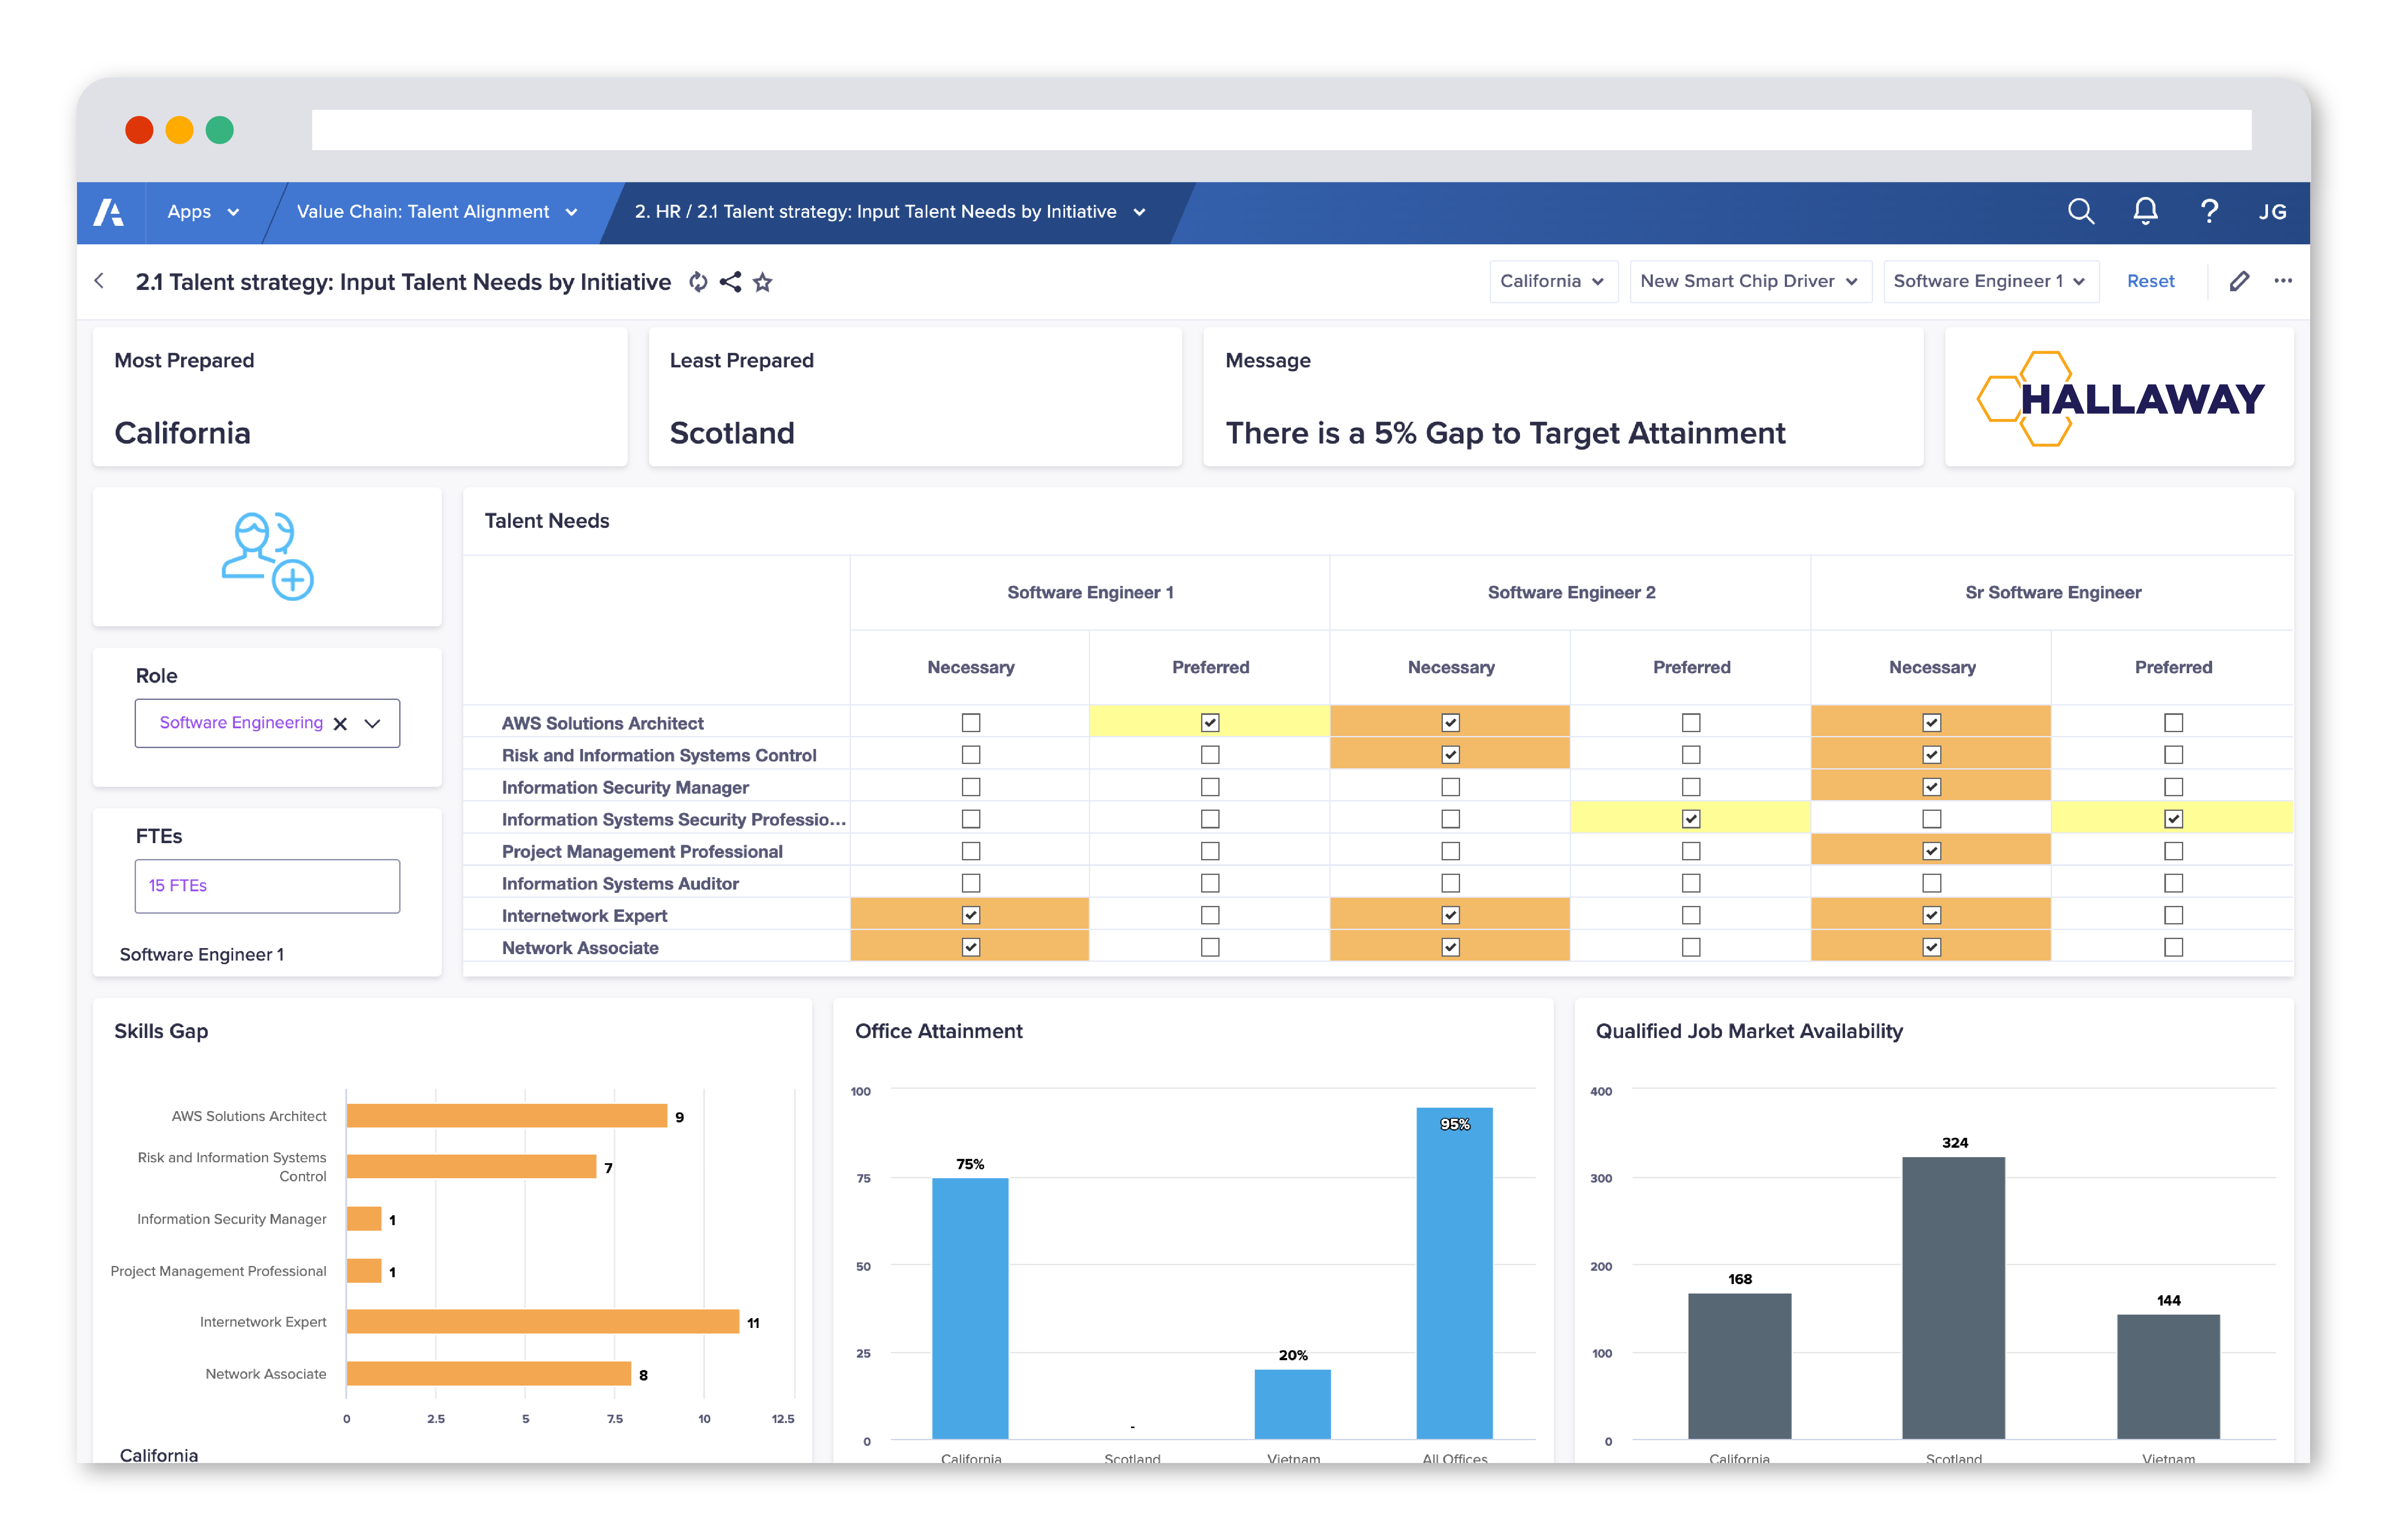
Anaplan has been implemented in various industries to address a wide range of business challenges. Users have found that the software replaces duplicate spreadsheets and simplifies reporting processes, resulting in one version of the truth. Anaplan's inbuilt version control and access controls have improved forecasting accuracy and simplified forecasting processes. It has also helped standardize forecasting and reporting approaches across different asset classes, benefitting functions such as HR, Finance, Accounting, and Management Controlling.
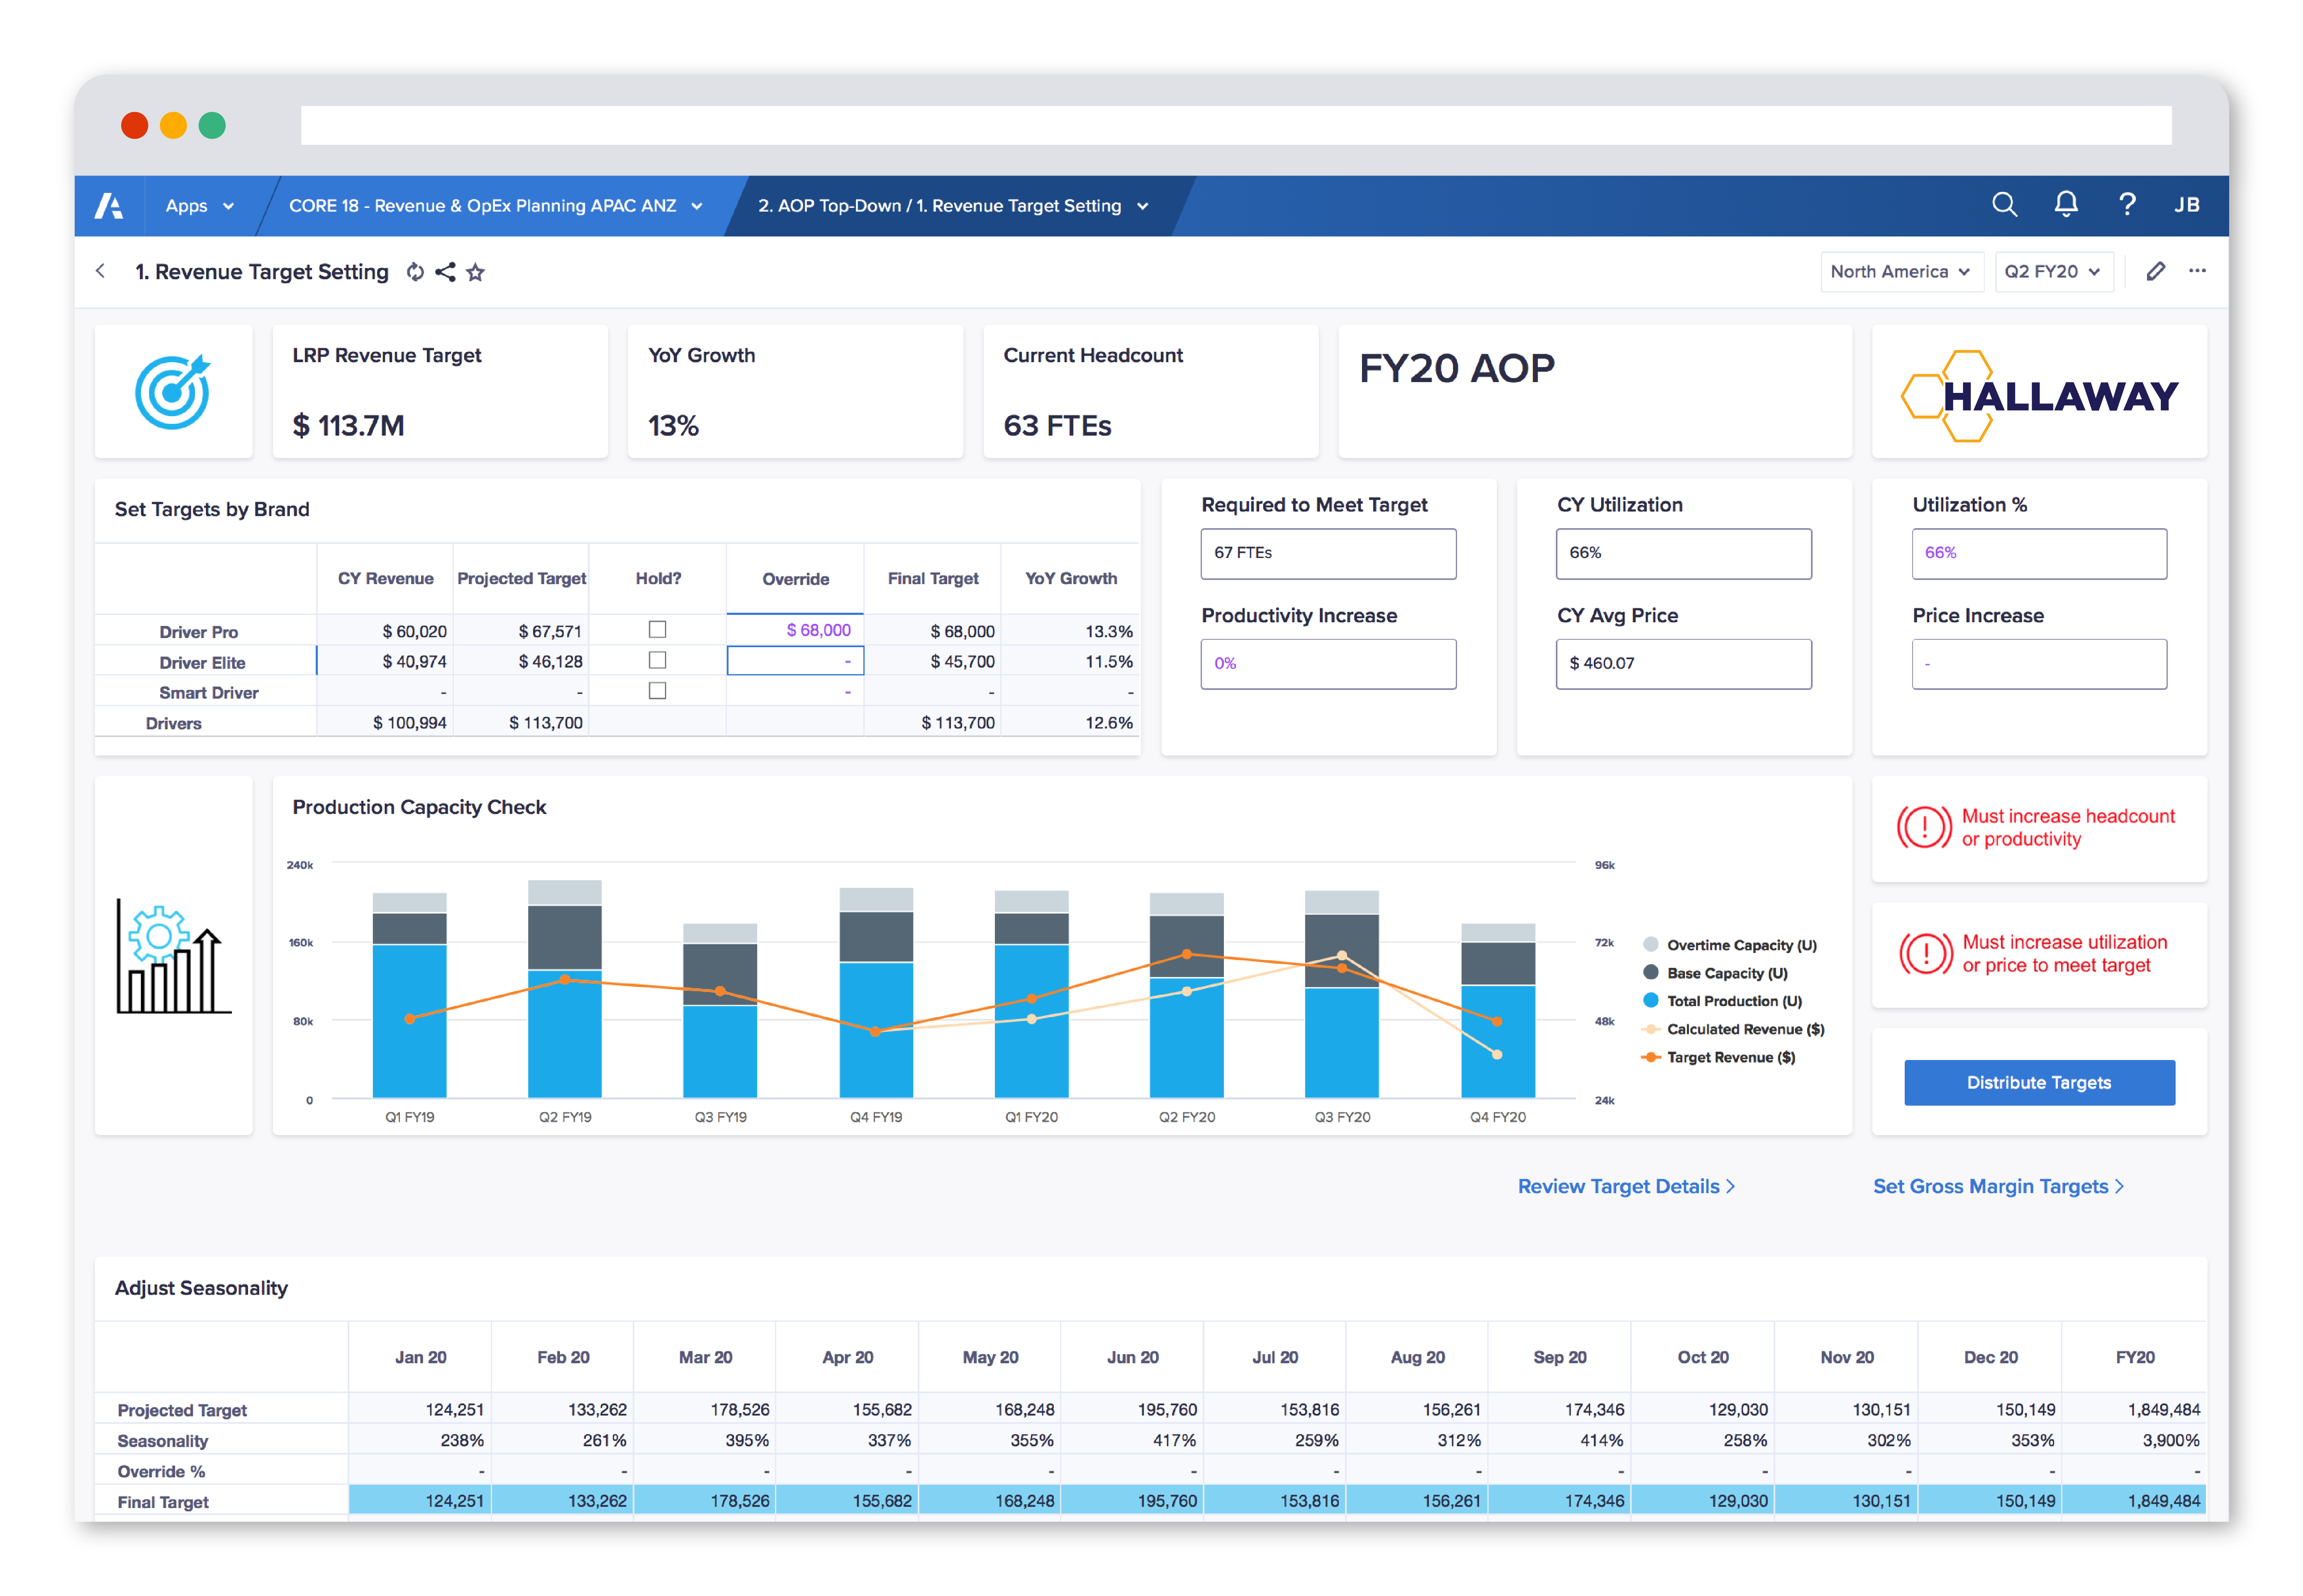
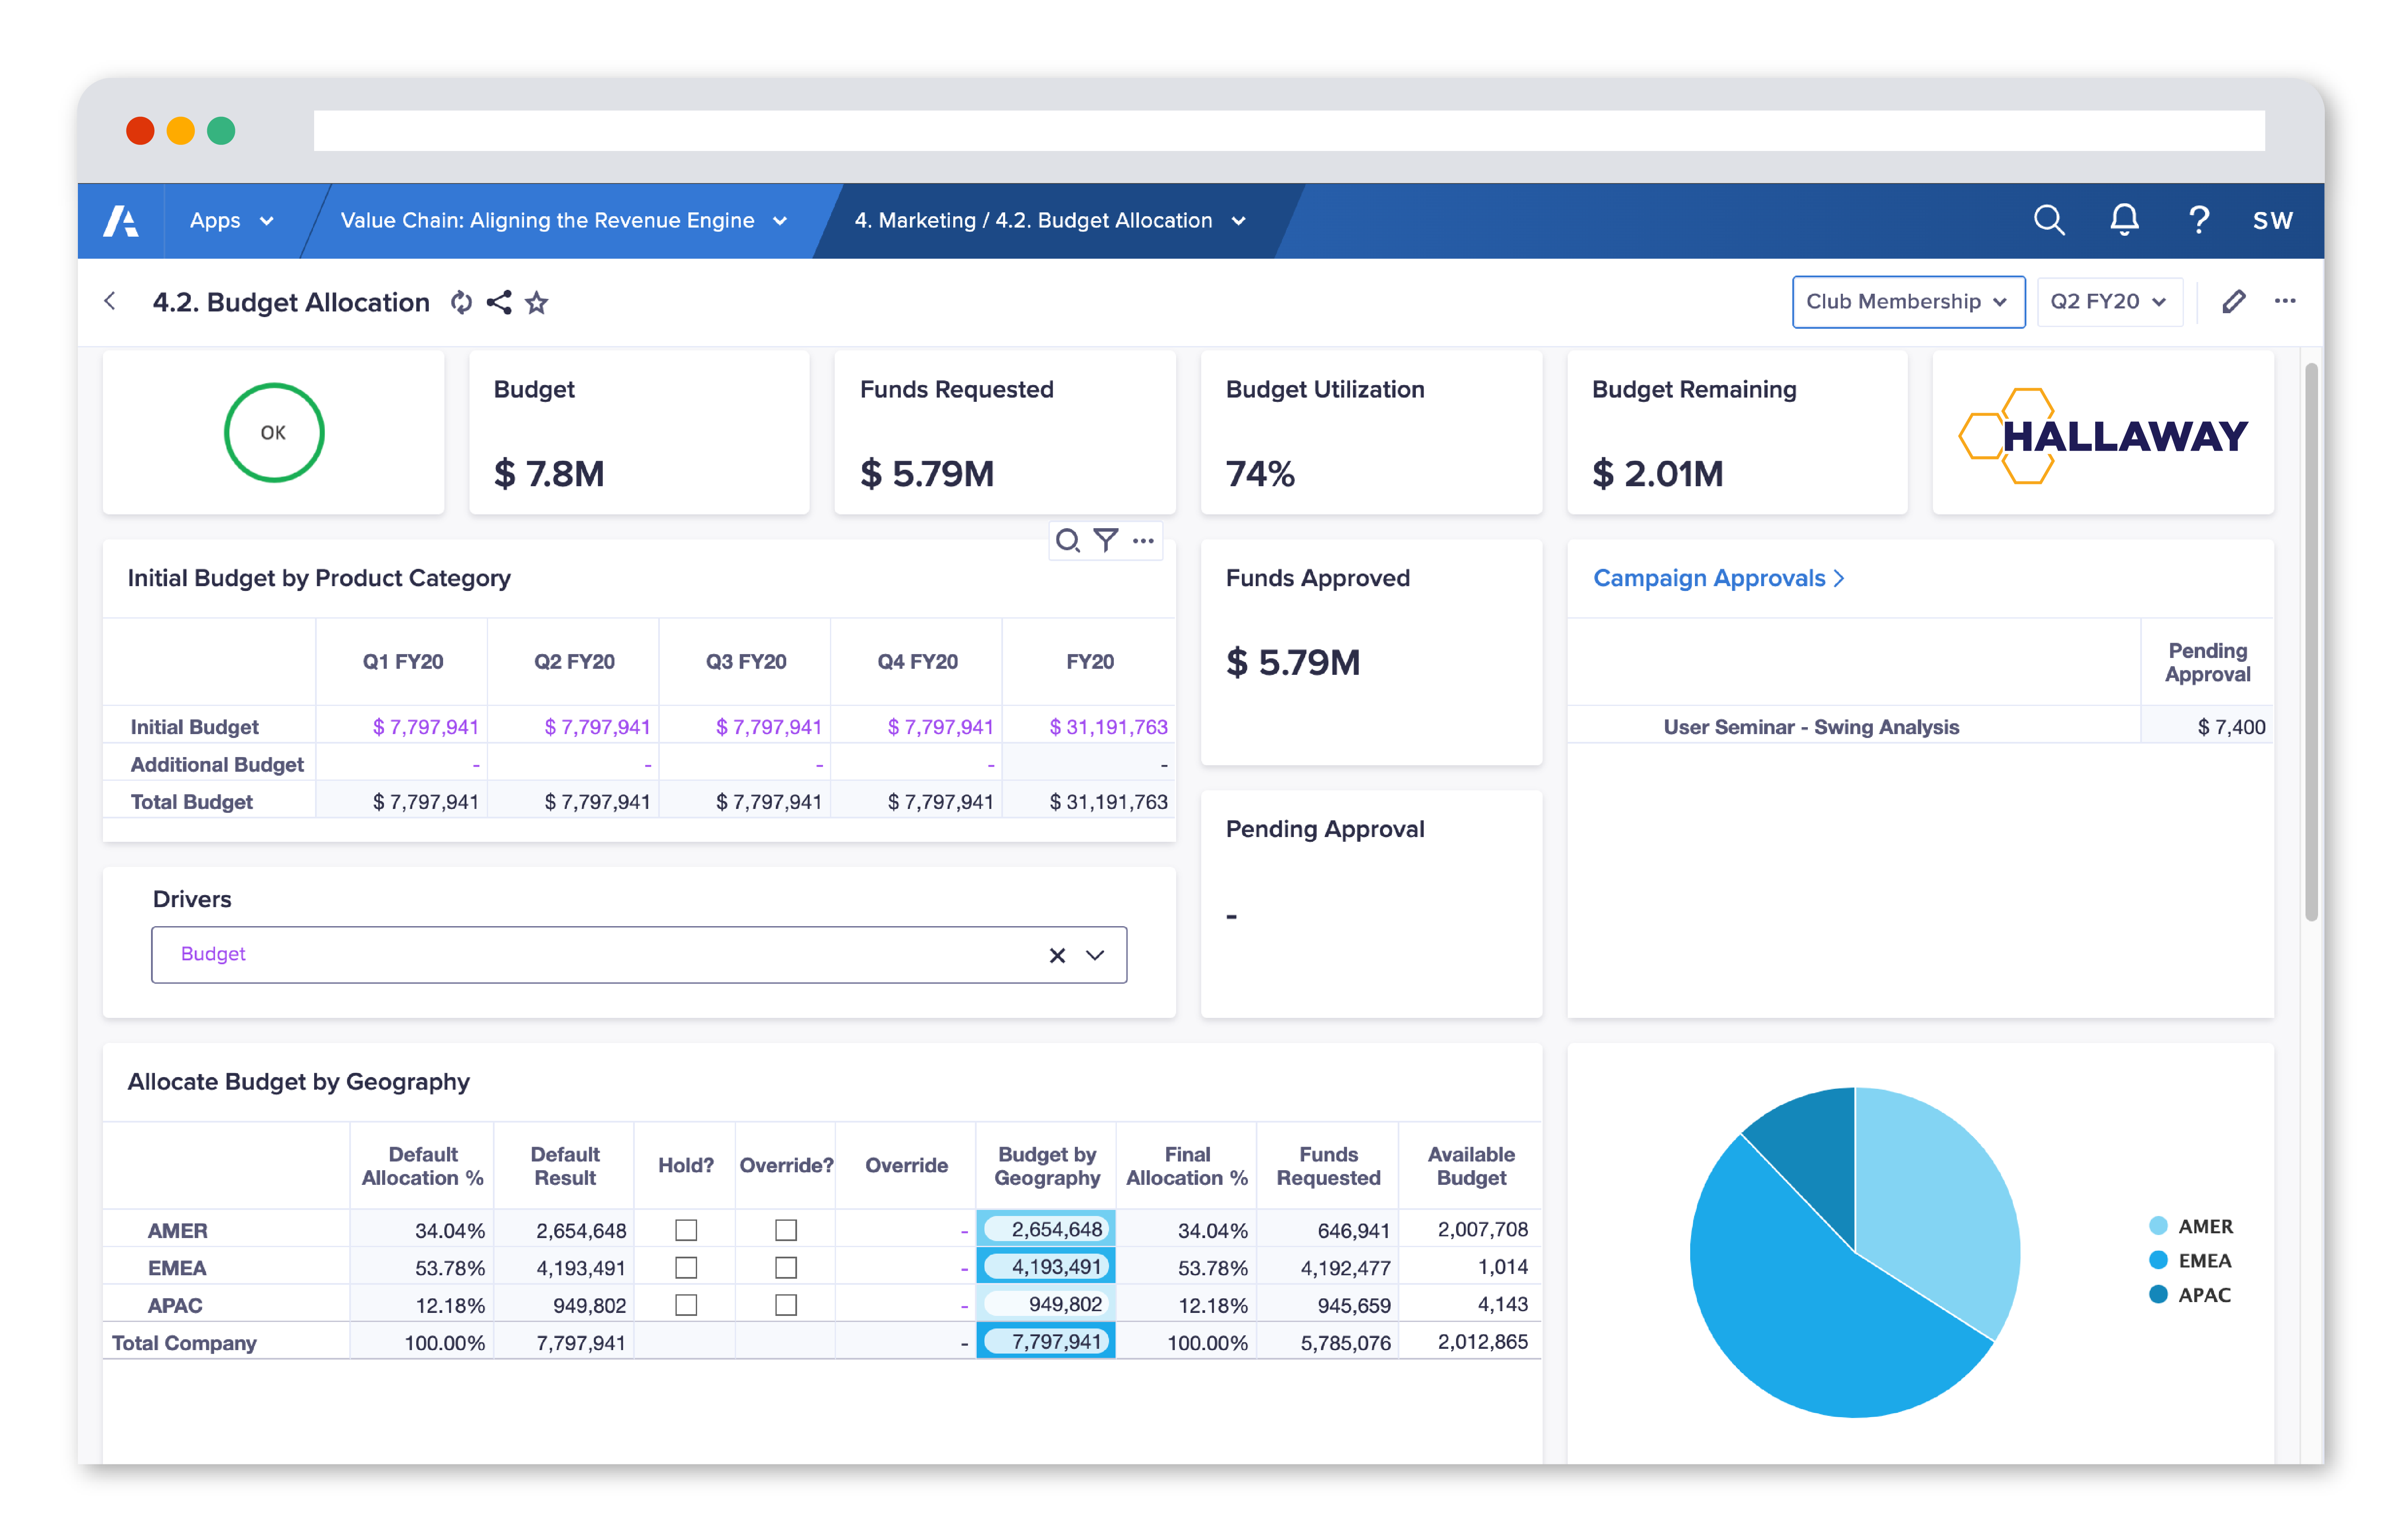
The flexibility of Anaplan allows users to customize the software to meet their specific business needs. It supports a multitude of use cases including financial planning and analysis, customer success, collections, capex forecasting, opex forecasting, headcount and personal spend forecasting, balance sheet forecasting, cash flow forecasting, P&L forecasting, collections forecasting, and management reporting. Multiple users can input forecast assumptions in real-time, enabling dynamic results. Furthermore, Anaplan allows for faster implementations by providing a single platform and source of truth for multiple planning use cases.
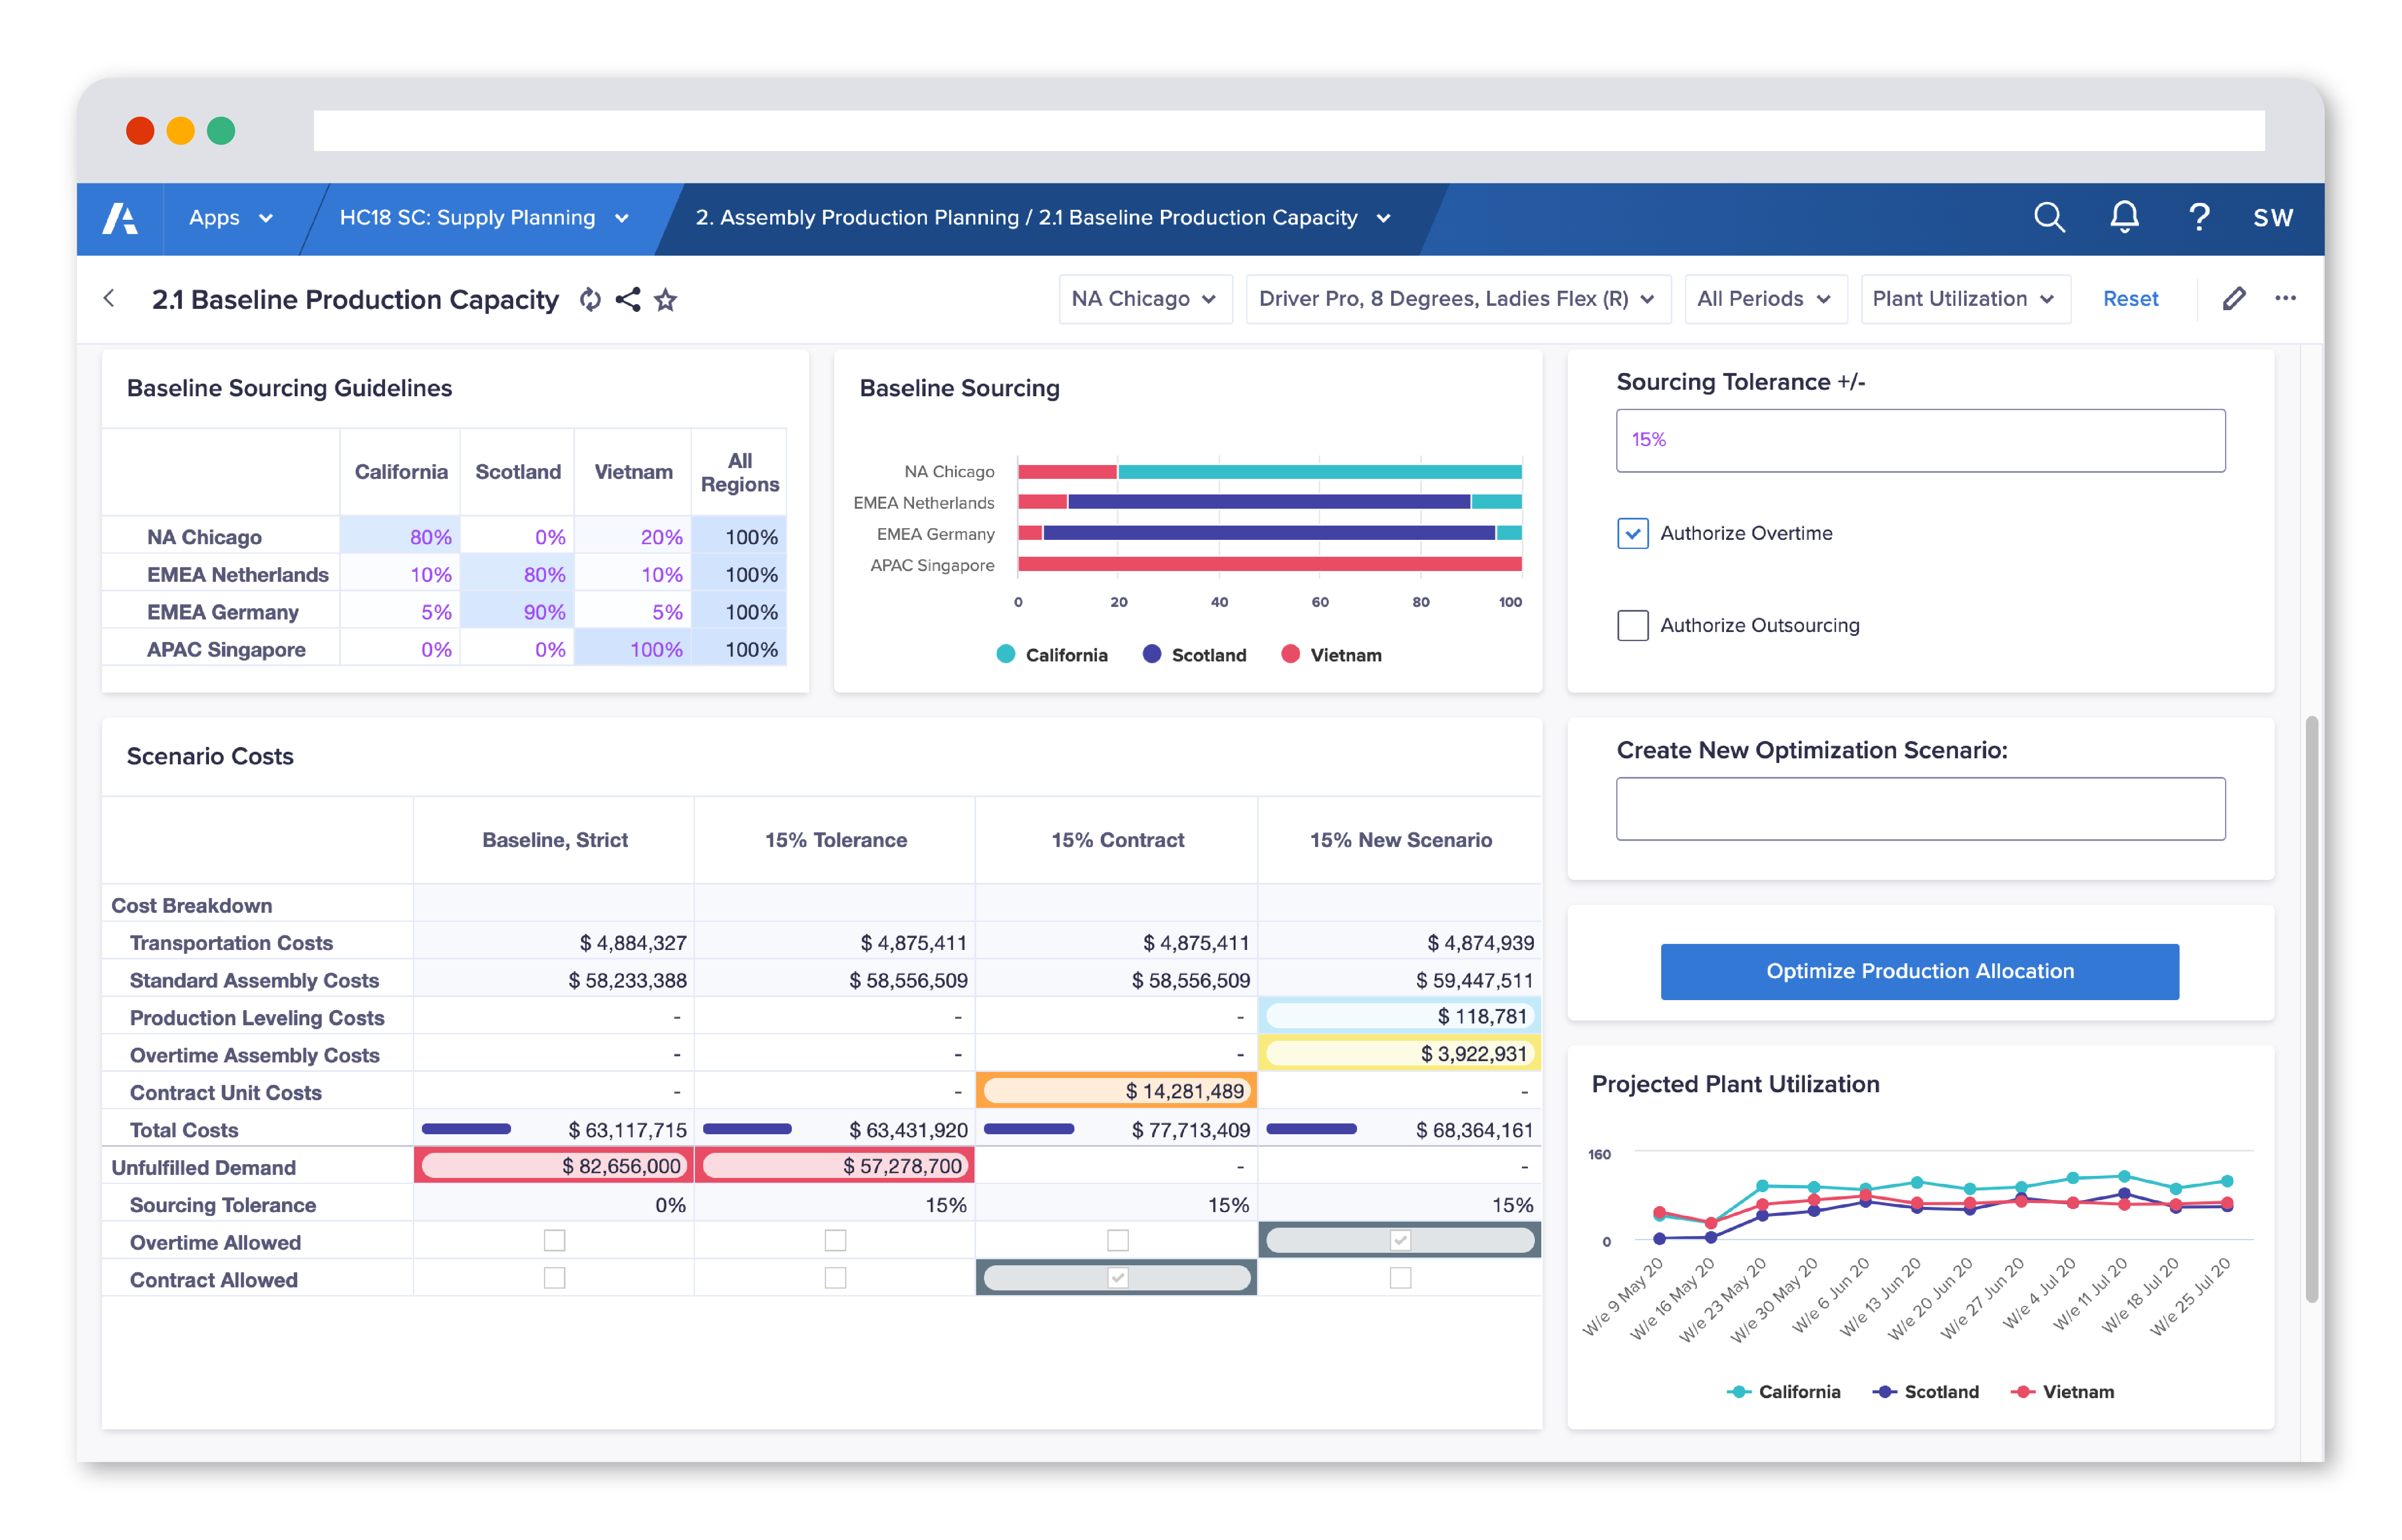
Anaplan's powerful calculation engine enables users to run multiple scenarios in seconds, facilitating what-if analysis and scenario comparison during budgeting and forecasting processes. The software is widely used in sales performance management for functions like territory management, account planning, quota allocation, and incentive compensation planning. In addition to its extensive use cases in finance and sales planning, Anaplan is employed across various industries including real estate development, insurance, telecommunication infrastructure, and banking. The platform empowers organizations by providing scenario planning and sensitivity analysis capabilities that enable informed decision-making. With its user-friendly interface and real-time calculations, Anaplan assists businesses in centralizing data and maintaining a golden source of truth for better planning outcomes.
Highly scalable and flexible data integration and modeling capabilities: Reviewers have praised the Anaplan platform for its highly scalable and flexible data integration and modeling capabilities, allowing for easy evolution from simple calculations to complex formulas. Many users have highlighted this as a major strength of the platform.
Real-time data capabilities enabling informed decision-making: The real-time data capabilities of Anaplan have been widely praised by reviewers for enabling informed decision-making based on up-to-date information. Several users have mentioned that this feature has greatly contributed to their ability to make agile decisions in a fast-paced business environment.
User-friendly interface contributing to high end user adoption: The user-friendly interface of Anaplan has been consistently highlighted by reviewers as a key strength of the platform. Users appreciate the intuitive design, which resembles Excel and allows for quick task completion. This ease of use has contributed to high end user adoption and overall positive feedback from customers.
Limited storage: Some users have found the limited storage in Anaplan to be a hindrance in efficiently managing their data. They have expressed difficulties in storing and organizing large amounts of information, which can impact their ability to effectively utilize the software.
Expensive: Several reviewers feel that Anaplan is expensive and could be more cost-effective considering its features and capabilities. This pricing structure may make it less accessible for smaller businesses or organizations with budget constraints.
Glitches with the interface: Users report experiencing glitches with the interface, causing difficulties in navigating and performing tasks smoothly. These issues can disrupt workflow and decrease efficiency for users.