Overview
What is Vena?
Vena Solutions provides a financial process automation solution to automate Corporate Performance Management, accounting and budgeting, Regulatory & Compliance, and other finance-related processes. It is scaled for medium to large-sized organizations.
A great reporting time-saving tool
Easy to use....
Nimble but Robust Software
Vena Review
Vena - Great, versatile and effective FP&A solution
Great FP&A tool
Happy Vena User.
Vena for Finance and beyond!
Perspective of seasoned Vena adminitrator
Vena! Great for centralizing data and easy-to-use for end users
1. we use for budgeting and forecast twice a year of operating and capital expenses and workforce. I …
Vena Review
Trust Vena
Vote Vena for non profits!
Vena - A Timely, User Friendly Budgeting Solution
How Vena Differs From Its Competitors
Full-Cycle Support
Finance-Informed Decisions
Full-Cycle Support
Finance-Informed Decisions
Full-Cycle Support
Full-Cycle Support
Finance-Informed Decisions
Full-Cycle Support
Finance-Informed Decisions
Full-Cycle Support
Finance-Informed Decisions
Full-Cycle Support
Finance-Informed Decisions
Full-Cycle Support
Finance-Informed Decisions
Full-Cycle Support
Finance-Informed Decisions
Full-Cycle Support
Finance-Informed Decisions
Full-Cycle Support
Finance-Informed Decisions
Full-Cycle Support
Finance-Informed Decisions
Full-Cycle Support
Finance-Informed Decisions
Full-Cycle Support
Finance-Informed Decisions
Full-Cycle Support
Finance-Informed Decisions
Full-Cycle Support
Finance-Informed Decisions
Full-Cycle Support
Finance-Informed Decisions
Full-Cycle Support
Finance-Informed Decisions
Full-Cycle Support
Finance-Informed Decisions
Full-Cycle Support
Finance-Informed Decisions
Full-Cycle Support
Finance-Informed Decisions
Full-Cycle Support
Finance-Informed Decisions
Full-Cycle Support
Finance-Informed Decisions
Full-Cycle Support
Finance-Informed Decisions
Awards
Products that are considered exceptional by their customers based on a variety of criteria win TrustRadius awards. Learn more about the types of TrustRadius awards to make the best purchase decision. More about TrustRadius Awards
Popular Features
- Excel-based Reporting (194)9.393%
- Financial budgeting (202)9.292%
- Management reporting (199)8.888%
- Forecasting (193)8.686%
Reviewer Pros & Cons
Video Reviews
1 video
Pricing
Professional
N/A
Complete
N/A
Entry-level set up fee?
- Setup fee optionalOptional
Offerings
- Free Trial
- Free/Freemium Version
- Premium Consulting/Integration Services
Features
BI Standard Reporting
Standard reporting means pre-built or canned reports available to users without having to create them.
- 8.6Pixel Perfect reports(48) Ratings
Pixel Perfect reports are highly-formatted reports with graphics and ability to preview the report before printing.
- 8.8Customizable dashboards(75) Ratings
Customizable dashboards are dashboards providing the builder some degree of control over the look and feel and display options.
- 8.7Report Formatting Templates(82) Ratings
Ad-hoc Reporting
Ad-Hoc Reports are reports built by the user to meet highly specific requirements.
- 8.7Drill-down analysis(167) Ratings
Drill down analysis is the ability to get to a further level of detail by going deeper into the hierarchy.
- 8.4Formatting capabilities(166) Ratings
Ability to format output e.g. conditional formatting, lines, headers, footers.
- 6.9Integration with R or other statistical packages(48) Ratings
Integration with the open-source R predictive modeling environment.
- 8.4Report sharing and collaboration(144) Ratings
Report sharing and collaboration is the ability to easily share reports with others.
Report Output and Scheduling
Ability to schedule and manager report output.
- 9.2Publish to Web(62) Ratings
- 9Publish to PDF(91) Ratings
- 9.1Report Versioning(109) Ratings
Report versioning is the assignment of version numbers to each version of a report to help in tracking.
- 8.7Report Delivery Scheduling(98) Ratings
Report Delivery Schedule is the ability to have reports delivered to a destination at a specific data and time.
Data Discovery and Visualization
Data Discovery and Visualization is the analysis of multiple data sources in a search for patterns and outliers and the ability to represent the data visually.
- 8.5Pre-built visualization formats (heatmaps, scatter plots etc.)(69) Ratings
Pre-built visualization formats are canned visualization types that can be selected to visualize different kinds of data.
- 7.3Location Analytics / Geographic Visualization(53) Ratings
Location analytics is the visualization of geographical or spatial data.
- 8.4Predictive Analytics(59) Ratings
Predictive Analytics is the ability to build forecasting models based on existing data sets.
- 8Pattern Recognition and Data Mining(6) Ratings
Pattern recognition and data mining mean the ability to recognize hidden patterns in large quantities of data.
Access Control and Security
Access control means being able to determine who has access to which data.
- 9Multi-User Support (named login)(157) Ratings
Named model access means that users have access based on name and password.
- 9.2Role-Based Security Model(156) Ratings
Role-based access means that access to data is determined by job or position in the corporation.
- 9.3Multiple Access Permission Levels (Create, Read, Delete)(159) Ratings
Multiple access permission levels means that different levels of users have different rights.
- 9.2Report-Level Access Control(22) Ratings
Report-level access control means that the type of report determines who has access to it.
- 9.2Single Sign-On (SSO)(116) Ratings
Allows users to use one set of login credentials to access multiple applications
Mobile Capabilities
Support for mobile devices like smartphones and tablets.
- 9.2Responsive Design for Web Access(77) Ratings
Web design aimed at producing easy-to-read sites across a range of different devices.
- 8.9Dashboard / Report / Visualization Interactivity on Mobile(66) Ratings
In-app dashboard reports and data visualization.
Budgeting, Planning, and Forecasting
These activities are designed to assist with both data-driven operational, short-term planning and strategic long term planning
- 8.7Long-term financial planning(187) Ratings
3-5 year financial plan with cashflow.
- 9.2Financial budgeting(202) Ratings
Annual budget for revenue and operating expenses, headcount/compensation, capital expenses, projects, etc.
- 8.6Forecasting(193) Ratings
Combining actuals and budgets, rolling forecasts, driver-based models.
- 8.1Scenario modeling(172) Ratings
Financial or operational modeling of alternate future states and planning for each.
- 8.8Management reporting(199) Ratings
Budget vs. actual or forecast, P&L’s, performance over time, between products etc.
Consolidation and Close
Consolidation of data from multiple entities with currency management, reporting and audit trails.
- 9.2Financial data consolidation(155) Ratings
Consolidating data from several entities into a single statement using US GAAP, IFRS or other standards.
- 8Journal entries and reports(110) Ratings
Ability to enter journal entry adjustments and produce reports showing all journal entries for a specific period.
- 7.2Multi-currency management(103) Ratings
Ability to handle foreign currency conversions during consolidation.
- 8.2Intercompany Eliminations(102) Ratings
Matching and elimination of intercompany revenue, expenses, and balance sheet accounts.
- 8.6Minority Ownership(66) Ratings
Consolidate financials full or partial ownership of subsidiaries, equity pick-up.
- 8.5Local and consolidated reporting(134) Ratings
Ability to report against individual business entities and the consolidated umbrella entity.
- 8.9Detailed Audit Trails(161) Ratings
Tracing changes to data and processes that were run.
Financial Reporting and Compliance
Financial statements and regulatory filings
- 9Financial Statement Reporting(180) Ratings
Creation and production of balance sheets, income statements, cash flows, other schedules
- 8.7Management Reporting(185) Ratings
Tools facilitating creation of internal ad hoc or standard reports.
- 9.3Excel-based Reporting(194) Ratings
Ad hoc or formatted reports using MS Excel.
- 8.8Automated board and financial reporting(139) Ratings
Tools to help automate creation of regulatory reports such as SEC filings and board books.
- 6.3XBRL support for regulatory filing(45) Ratings
Support for the XBRL standard reporting format for exchanging financial data.
Analytics and Reporting
Dashboards and scorecards for KPI monitoring and benchmarking
- 8.4Personalized dashboards(121) Ratings
Create custom dashboards and reports without the help of IT or administrators.
- 8.9Color-coded scorecards(90) Ratings
Track and analyze performances with interactive, color-coded balanced scorecards.
- 8.9KPIs(105) Ratings
Select from a library of more than 6,000 key performance indicators, and incorporate KPIs into your planning process.
- 7.8Cost and profitability analysis(116) Ratings
Cost and profitability analysis provides data for business decision making.
- 9.1Key Performance Indicator setting(103) Ratings
Ability to set key performance indicators for measuring progress towards goals.
- 8.8Benchmarking with external data(77) Ratings
CPI, daily exchange rates, industry KPIs. with scheduled data refreshes.
Integration
Ability to integrate with external applications.
- 9.4Flat file integration(156) Ratings
Integration of flat files like text documents and comma separated files
- 8.8Excel data integration(180) Ratings
Ability to integrate directly with Excel data.
- 8.9Direct links to 3rd-party data sources(143) Ratings
Integration with external applications like ERP, CRM, HCM
Product Details
- About
- Integrations
- Competitors
- Tech Details
- Downloadables
- FAQs
What is Vena?
Vena is a Native Excel Complete Planning Platform used for budgeting and forecasting, for business leaders and finance and operations professionals.
Vena boasts users among more than 1,350 companies such as Nike, Coca-Cola Consolidated and the Kansas City Chiefs. In addition, Vena works with over 100 Partners.
Vena Features
Budgeting, Planning, and Forecasting Features
- Supported: Long-term financial planning
- Supported: Financial budgeting
- Supported: Forecasting
- Supported: Scenario modeling
- Supported: Management reporting
Consolidation and Close Features
- Supported: Financial data consolidation
- Supported: Journal entries and reports
- Supported: Multi-currency management
- Supported: Intercompany Eliminations
- Supported: Minority Ownership
- Supported: Local and consolidated reporting
- Supported: Detailed Audit Trails
Financial Reporting and Compliance Features
- Supported: Financial Statement Reporting
- Supported: Management Reporting
- Supported: Excel-based Reporting
- Supported: Automated board and financial reporting
- Supported: XBRL support for regulatory filing
Analytics and Reporting Features
- Supported: Personalized dashboards
- Supported: Color-coded scorecards
- Supported: KPIs
- Supported: Cost and profitability analysis
- Supported: Key Performance Indicator setting
- Supported: Benchmarking with external data
Integration Features
- Supported: Flat file integration
- Supported: Excel data integration
- Supported: Direct links to 3rd-party data sources
BI Standard Reporting Features
- Supported: Pixel Perfect reports
- Supported: Customizable dashboards
- Supported: Report Formatting Templates
Ad-hoc Reporting Features
- Supported: Drill-down analysis
- Supported: Formatting capabilities
- Supported: Predictive modeling
- Supported: Integration with R or other statistical packages
- Supported: Report sharing and collaboration
Report Output and Scheduling Features
- Supported: Publish to Web
- Supported: Publish to PDF
- Supported: Report Versioning
- Supported: Report Delivery Scheduling
Data Discovery and Visualization Features
- Supported: Pre-built visualization formats (heatmaps, scatter plots etc.)
- Supported: Location Analytics / Geographic Visualization
- Supported: Predictive Analytics
- Supported: Support for Machine Learning models
- Supported: Pattern Recognition and Data Mining
- Supported: Integration with R or other statistical packages
Access Control and Security Features
- Supported: Multi-User Support (named login)
- Supported: Role-Based Security Model
- Supported: Multiple Access Permission Levels (Create, Read, Delete)
- Supported: Report-Level Access Control
- Supported: Table-Level Access Control (BI-layer)
- Supported: Field-Level Access Control (BI-layer)
- Supported: Single Sign-On (SSO)
Mobile Capabilities Features
- Supported: Responsive Design for Web Access
- Supported: Dashboard / Report / Visualization Interactivity on Mobile
Vena Screenshots
Vena Videos
Vena Integrations
Vena Competitors
Vena Technical Details
Deployment Types | Software as a Service (SaaS), Cloud, or Web-Based |
---|---|
Operating Systems | Unspecified |
Mobile Application | You don't need to download an app or change a setting to use Vena on your mobile device: just open your browser, go to Vena (vena.io), and log in as you normally do. The Contributor interface is fully responsive, so it can adjust to any size screen, regardless of the type of device you have. |
Supported Countries | United States of America, Canada, United Kingdom, Australia, South Africa, Europe |
Supported Languages | Vena supports any localization capabilities already native within Excel. Vena Cloud supports English, Spanish, and French. If a specific language is required please don’t hesitate to ask. |
Vena Downloadables
Frequently Asked Questions
Vena Customer Size Distribution
Consumers | 0% |
---|---|
Small Businesses (1-50 employees) | 19% |
Mid-Size Companies (51-500 employees) | 55% |
Enterprises (more than 500 employees) | 26% |
Comparisons
Compare with
Reviews and Ratings
(307)Attribute Ratings
- 8.6Likelihood to Renew18 ratings
- 8.8Availability6 ratings
- 8.5Performance6 ratings
- 9Usability25 ratings
- 10Support Rating95 ratings
- 8.9Online Training3 ratings
- 9In-Person Training3 ratings
- 7.5Implementation Rating4 ratings
- 8.2Configurability3 ratings
- 8.8Product Scalability6 ratings
- 8.9Ease of integration3 ratings
- 8.9Vendor pre-sale3 ratings
- 8.8Vendor post-sale3 ratings
Reviews
(1-25 of 214)Vena Solutions Review
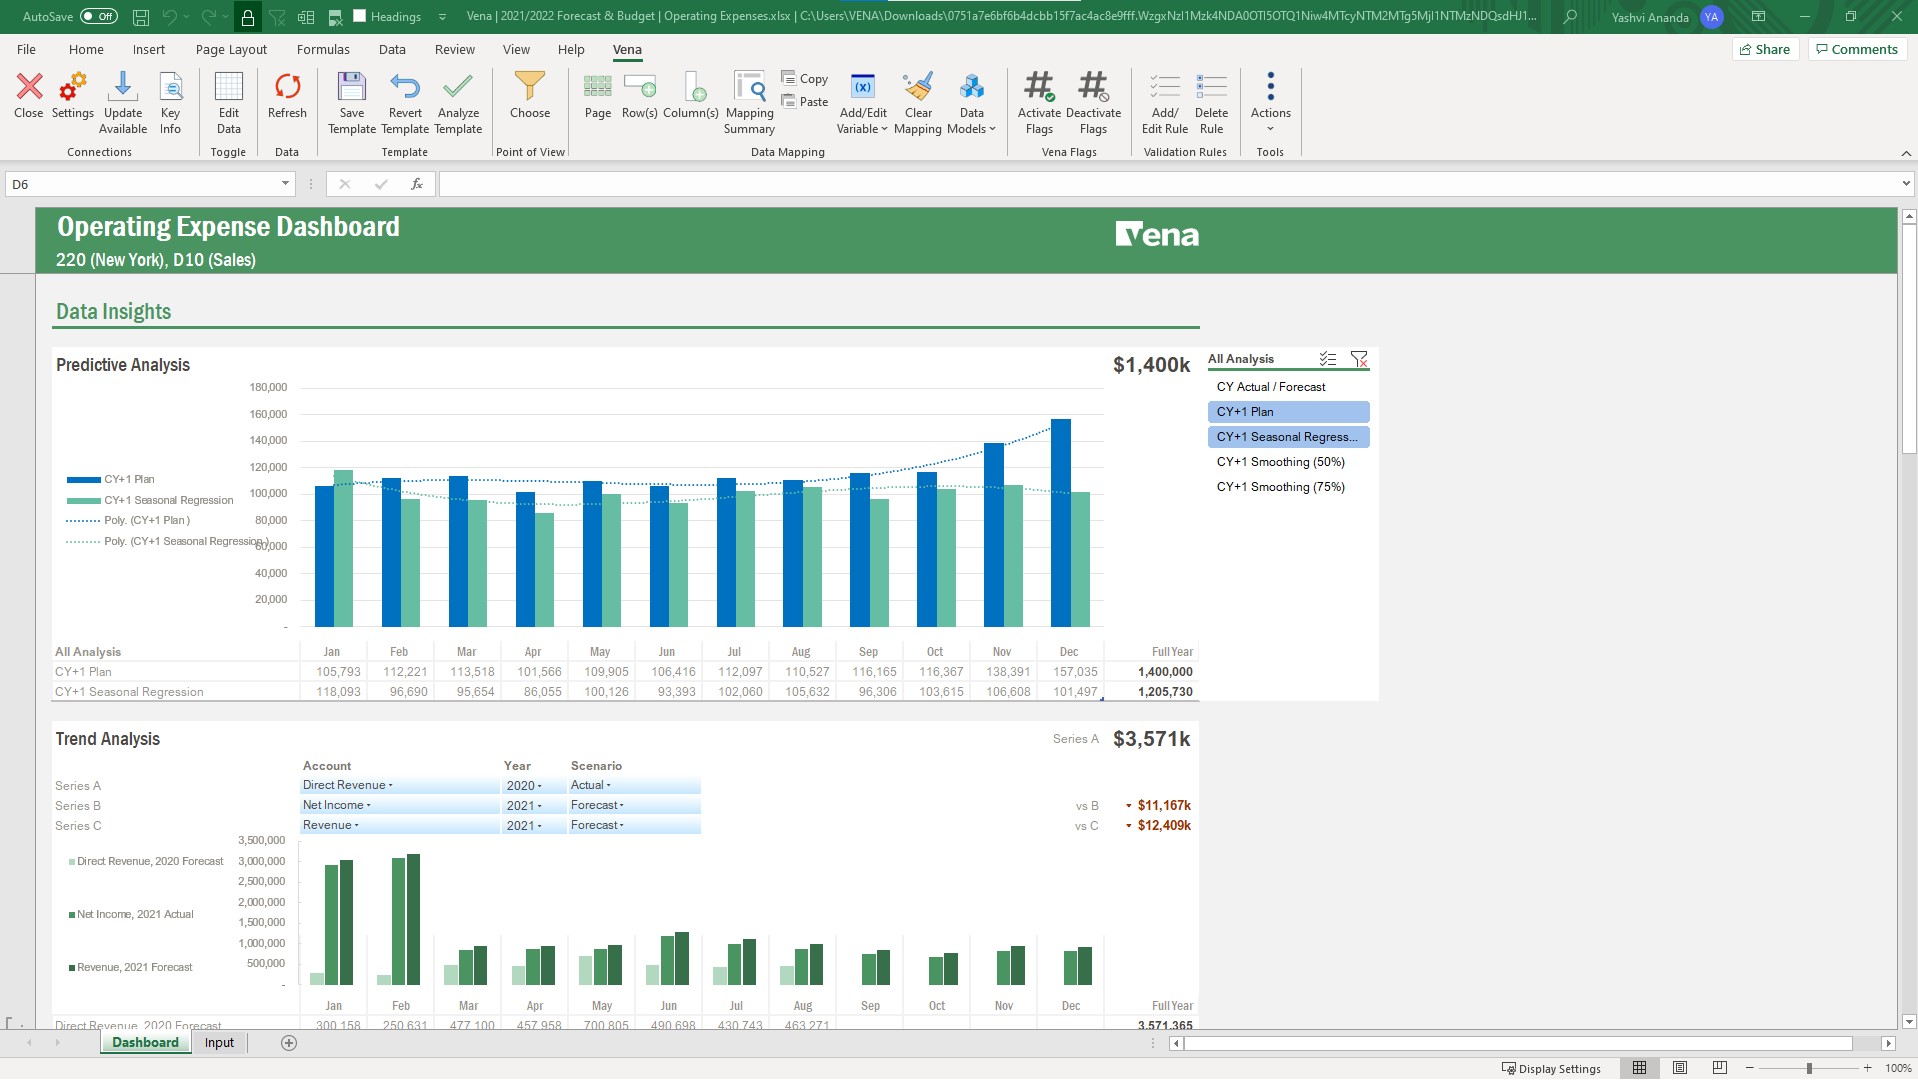
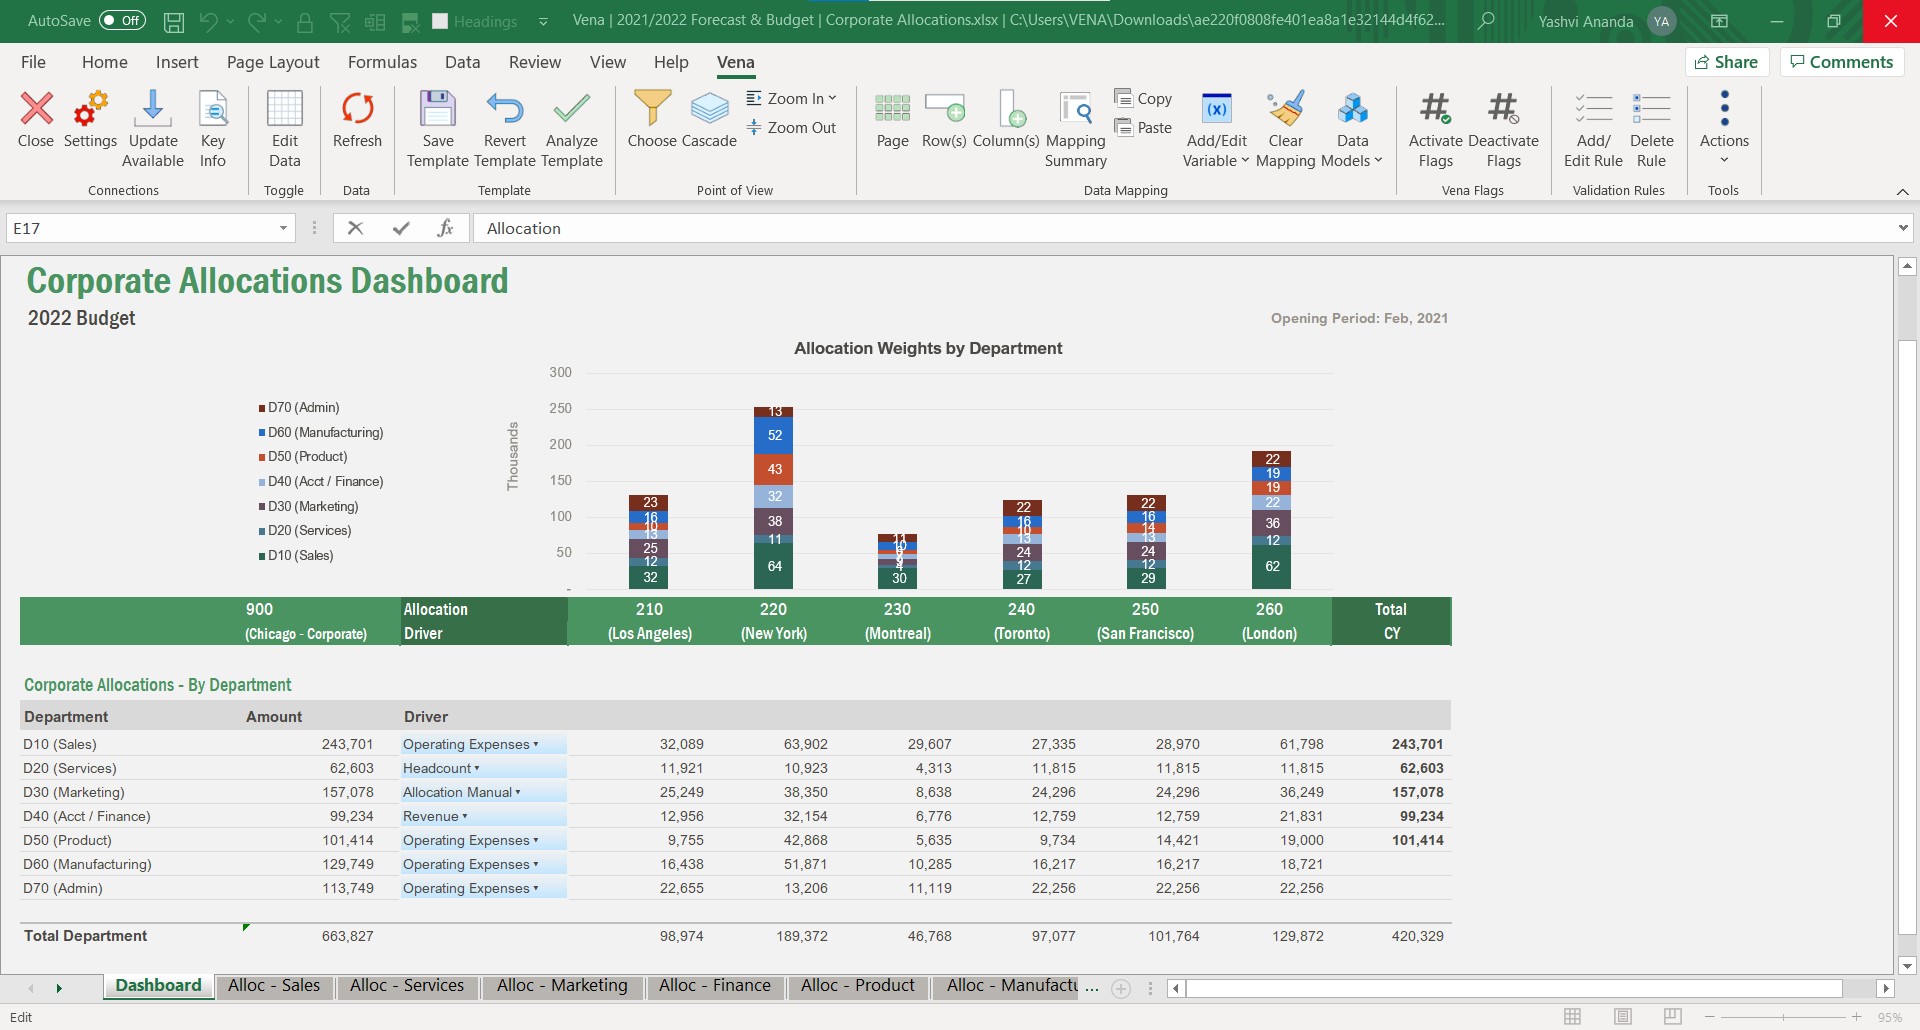
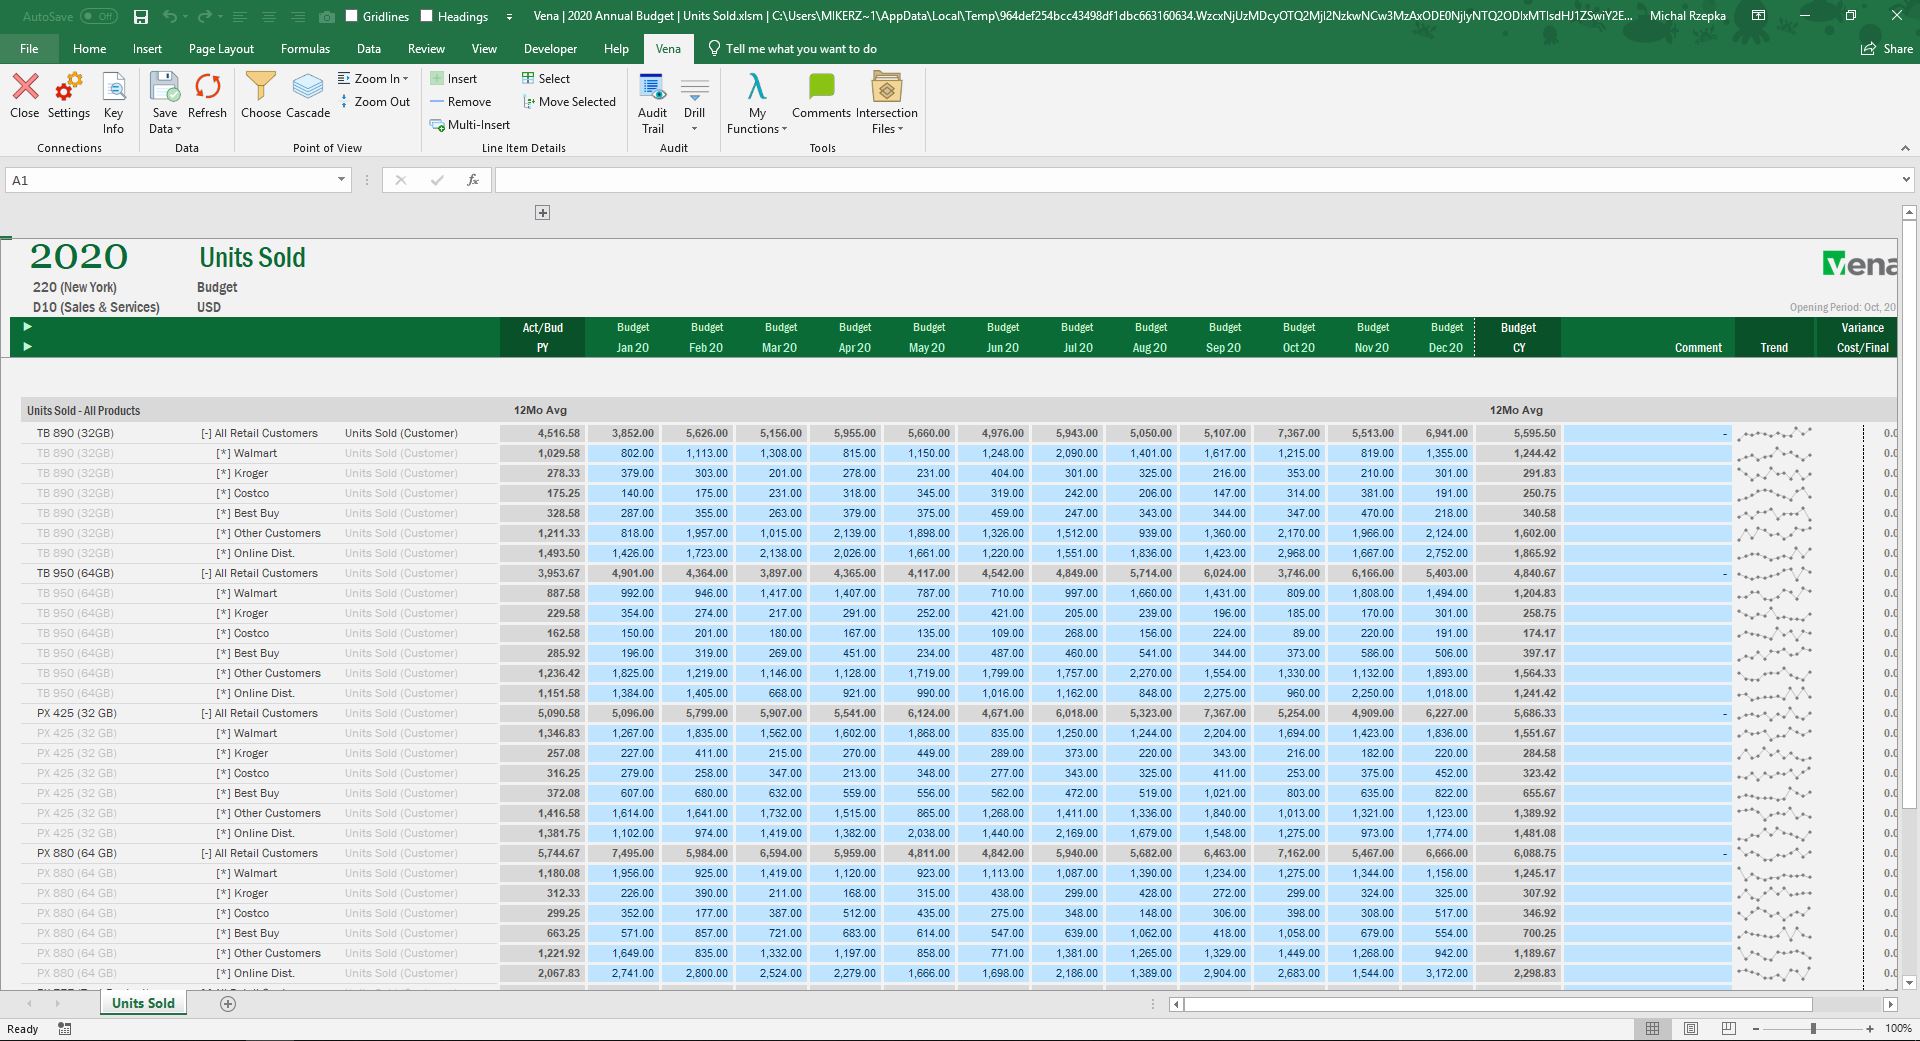
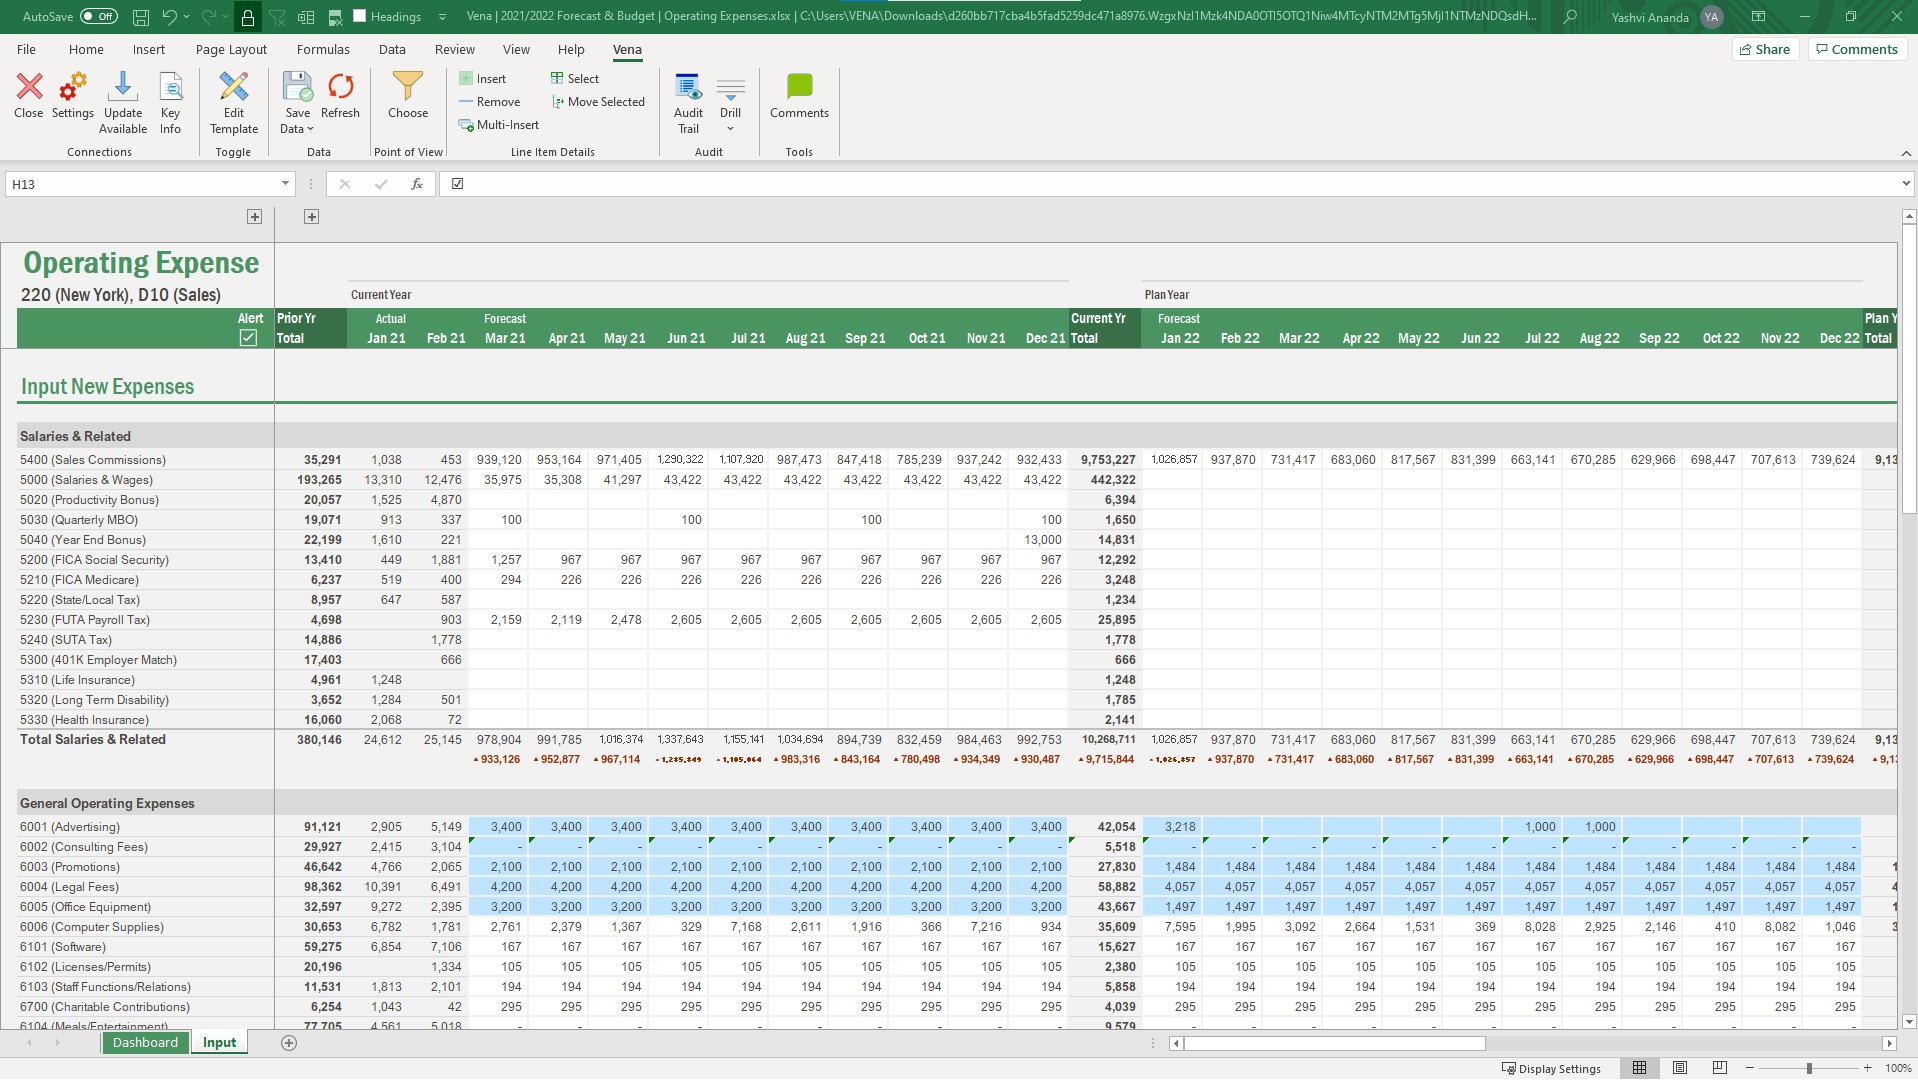
- Long-term financial planning
- 90%9.0
- Financial budgeting
- 100%10.0
- Forecasting
- 80%8.0
- Scenario modeling
- 80%8.0
- Management reporting
- 90%9.0
- Financial data consolidation
- 80%8.0
- Journal entries and reports
- 90%9.0
- Local and consolidated reporting
- 90%9.0
- Detailed Audit Trails
- 100%10.0
- Financial Statement Reporting
- 90%9.0
- Management Reporting
- 90%9.0
- Excel-based Reporting
- 100%10.0
- Automated board and financial reporting
- 90%9.0
- Personalized dashboards
- 90%9.0
- Color-coded scorecards
- 100%10.0
- KPIs
- 90%9.0
- Cost and profitability analysis
- 100%10.0
- Key Performance Indicator setting
- 90%9.0
- Benchmarking with external data
- 90%9.0
- Flat file integration
- 100%10.0
- Excel data integration
- 100%10.0
- Direct links to 3rd-party data sources
- 90%9.0
- Drill-down analysis
- 100%10.0
- Formatting capabilities
- 100%10.0
- Integration with R or other statistical packages
- 100%10.0
- Report sharing and collaboration
- 100%10.0
- Report Versioning
- 90%9.0
- Pre-built visualization formats (heatmaps, scatter plots etc.)
- 90%9.0
- Location Analytics / Geographic Visualization
- 90%9.0
- Predictive Analytics
- 80%8.0
- Pattern Recognition and Data Mining
- N/AN/A
- Multi-User Support (named login)
- 90%9.0
- Role-Based Security Model
- 90%9.0
- Multiple Access Permission Levels (Create, Read, Delete)
- 90%9.0
- Report-Level Access Control
- N/AN/A
- Dashboard / Report / Visualization Interactivity on Mobile
- 90%9.0
A great reporting time-saving tool
- Long-term financial planning
- N/AN/A
- Financial budgeting
- N/AN/A
- Forecasting
- N/AN/A
- Scenario modeling
- N/AN/A
- Management reporting
- 80%8.0
- Financial data consolidation
- 80%8.0
- Journal entries and reports
- N/AN/A
- Multi-currency management
- 70%7.0
- Intercompany Eliminations
- N/AN/A
- Minority Ownership
- N/AN/A
- Local and consolidated reporting
- 80%8.0
- Detailed Audit Trails
- N/AN/A
- Financial Statement Reporting
- 80%8.0
- Management Reporting
- 80%8.0
- Excel-based Reporting
- 80%8.0
- Automated board and financial reporting
- N/AN/A
- XBRL support for regulatory filing
- N/AN/A
- Personalized dashboards
- N/AN/A
- Color-coded scorecards
- N/AN/A
- KPIs
- N/AN/A
- Cost and profitability analysis
- N/AN/A
- Key Performance Indicator setting
- N/AN/A
- Benchmarking with external data
- N/AN/A
- Flat file integration
- 70%7.0
- Excel data integration
- 70%7.0
- Direct links to 3rd-party data sources
- 60%6.0
- Pixel Perfect reports
- N/AN/A
- Customizable dashboards
- N/AN/A
- Report Formatting Templates
- N/AN/A
- Drill-down analysis
- 10%1.0
- Formatting capabilities
- 100%10.0
- Integration with R or other statistical packages
- N/AN/A
- Report sharing and collaboration
- N/AN/A
- Publish to Web
- N/AN/A
- Publish to PDF
- N/AN/A
- Report Versioning
- N/AN/A
- Report Delivery Scheduling
- N/AN/A
- Pre-built visualization formats (heatmaps, scatter plots etc.)
- 10%1.0
- Location Analytics / Geographic Visualization
- N/AN/A
- Predictive Analytics
- N/AN/A
- Pattern Recognition and Data Mining
- N/AN/A
- Multi-User Support (named login)
- 80%8.0
- Role-Based Security Model
- 80%8.0
- Multiple Access Permission Levels (Create, Read, Delete)
- 80%8.0
- Report-Level Access Control
- 80%8.0
- Single Sign-On (SSO)
- 90%9.0
- Responsive Design for Web Access
- 80%8.0
- Dashboard / Report / Visualization Interactivity on Mobile
- N/AN/A
Easy to use....
- Long-term financial planning
- 70%7.0
- Financial budgeting
- 70%7.0
- Forecasting
- 70%7.0
- Scenario modeling
- 60%6.0
- Management reporting
- 80%8.0
- Financial data consolidation
- 90%9.0
- Journal entries and reports
- N/AN/A
- Multi-currency management
- N/AN/A
- Intercompany Eliminations
- N/AN/A
- Minority Ownership
- N/AN/A
- Local and consolidated reporting
- 80%8.0
- Detailed Audit Trails
- N/AN/A
- Financial Statement Reporting
- 100%10.0
- Management Reporting
- 90%9.0
- Excel-based Reporting
- 90%9.0
- Automated board and financial reporting
- 80%8.0
- Personalized dashboards
- N/AN/A
- Color-coded scorecards
- N/AN/A
- KPIs
- N/AN/A
- Cost and profitability analysis
- N/AN/A
- Key Performance Indicator setting
- N/AN/A
- Benchmarking with external data
- N/AN/A
- Flat file integration
- 80%8.0
- Excel data integration
- 90%9.0
- Direct links to 3rd-party data sources
- N/AN/A
- Pixel Perfect reports
- N/AN/A
- Customizable dashboards
- N/AN/A
- Report Formatting Templates
- N/AN/A
- Drill-down analysis
- N/AN/A
- Formatting capabilities
- 70%7.0
- Integration with R or other statistical packages
- N/AN/A
- Report sharing and collaboration
- 80%8.0
- Publish to Web
- N/AN/A
- Publish to PDF
- N/AN/A
- Report Versioning
- N/AN/A
- Report Delivery Scheduling
- 70%7.0
- Pre-built visualization formats (heatmaps, scatter plots etc.)
- N/AN/A
- Location Analytics / Geographic Visualization
- N/AN/A
- Predictive Analytics
- N/AN/A
- Pattern Recognition and Data Mining
- N/AN/A
- Multi-User Support (named login)
- N/AN/A
- Role-Based Security Model
- 70%7.0
- Multiple Access Permission Levels (Create, Read, Delete)
- 70%7.0
- Report-Level Access Control
- N/AN/A
- Single Sign-On (SSO)
- 70%7.0
- Responsive Design for Web Access
- N/AN/A
- Dashboard / Report / Visualization Interactivity on Mobile
- N/AN/A
Nimble but Robust Software
- Long-term financial planning
- 80%8.0
- Financial budgeting
- 80%8.0
- Forecasting
- 80%8.0
- Scenario modeling
- 80%8.0
- Management reporting
- 90%9.0
- Financial data consolidation
- 90%9.0
- Journal entries and reports
- N/AN/A
- Multi-currency management
- N/AN/A
- Intercompany Eliminations
- 50%5.0
- Minority Ownership
- N/AN/A
- Local and consolidated reporting
- N/AN/A
- Detailed Audit Trails
- 70%7.0
- Financial Statement Reporting
- 80%8.0
- Management Reporting
- 90%9.0
- Excel-based Reporting
- 90%9.0
- Automated board and financial reporting
- 70%7.0
- XBRL support for regulatory filing
- N/AN/A
- Personalized dashboards
- N/AN/A
- Color-coded scorecards
- N/AN/A
- KPIs
- 70%7.0
- Cost and profitability analysis
- 80%8.0
- Key Performance Indicator setting
- 60%6.0
- Benchmarking with external data
- 30%3.0
- Flat file integration
- 80%8.0
- Excel data integration
- 80%8.0
- Direct links to 3rd-party data sources
- 30%3.0
- Pixel Perfect reports
- N/AN/A
- Customizable dashboards
- N/AN/A
- Report Formatting Templates
- N/AN/A
- Drill-down analysis
- 70%7.0
- Formatting capabilities
- 80%8.0
- Integration with R or other statistical packages
- N/AN/A
- Report sharing and collaboration
- N/AN/A
- Publish to Web
- N/AN/A
- Publish to PDF
- N/AN/A
- Report Versioning
- N/AN/A
- Report Delivery Scheduling
- N/AN/A
- Pre-built visualization formats (heatmaps, scatter plots etc.)
- N/AN/A
- Location Analytics / Geographic Visualization
- N/AN/A
- Predictive Analytics
- N/AN/A
- Pattern Recognition and Data Mining
- N/AN/A
- Multi-User Support (named login)
- 80%8.0
- Role-Based Security Model
- 80%8.0
- Multiple Access Permission Levels (Create, Read, Delete)
- 80%8.0
- Report-Level Access Control
- 80%8.0
- Single Sign-On (SSO)
- 80%8.0
- Responsive Design for Web Access
- N/AN/A
- Dashboard / Report / Visualization Interactivity on Mobile
- N/AN/A
Vena Review
- Long-term financial planning
- 90%9.0
- Financial budgeting
- 90%9.0
- Forecasting
- 90%9.0
- Scenario modeling
- 90%9.0
- Management reporting
- 90%9.0
- Financial data consolidation
- N/AN/A
- Journal entries and reports
- N/AN/A
- Multi-currency management
- N/AN/A
- Intercompany Eliminations
- N/AN/A
- Minority Ownership
- N/AN/A
- Local and consolidated reporting
- N/AN/A
- Detailed Audit Trails
- N/AN/A
- Financial Statement Reporting
- 90%9.0
- Management Reporting
- 90%9.0
- Excel-based Reporting
- 90%9.0
- Automated board and financial reporting
- N/AN/A
- XBRL support for regulatory filing
- N/AN/A
- Personalized dashboards
- N/AN/A
- Color-coded scorecards
- N/AN/A
- KPIs
- N/AN/A
- Cost and profitability analysis
- N/AN/A
- Key Performance Indicator setting
- N/AN/A
- Benchmarking with external data
- N/AN/A
- Flat file integration
- 90%9.0
- Excel data integration
- 90%9.0
- Direct links to 3rd-party data sources
- 90%9.0
- Pixel Perfect reports
- N/AN/A
- Customizable dashboards
- N/AN/A
- Report Formatting Templates
- N/AN/A
- Drill-down analysis
- 90%9.0
- Formatting capabilities
- 90%9.0
- Integration with R or other statistical packages
- N/AN/A
- Report sharing and collaboration
- 90%9.0
- Publish to Web
- N/AN/A
- Publish to PDF
- N/AN/A
- Report Versioning
- N/AN/A
- Report Delivery Scheduling
- N/AN/A
- Pre-built visualization formats (heatmaps, scatter plots etc.)
- N/AN/A
- Location Analytics / Geographic Visualization
- N/AN/A
- Predictive Analytics
- N/AN/A
- Pattern Recognition and Data Mining
- N/AN/A
- Multi-User Support (named login)
- 90%9.0
- Role-Based Security Model
- 90%9.0
- Multiple Access Permission Levels (Create, Read, Delete)
- 90%9.0
- Report-Level Access Control
- N/AN/A
- Single Sign-On (SSO)
- N/AN/A
- Responsive Design for Web Access
- N/AN/A
- Dashboard / Report / Visualization Interactivity on Mobile
- N/AN/A
Vena - Great, versatile and effective FP&A solution
- Long-term financial planning
- 100%10.0
- Financial budgeting
- 100%10.0
- Forecasting
- 80%8.0
- Scenario modeling
- 80%8.0
- Management reporting
- 90%9.0
- Financial data consolidation
- 70%7.0
- Journal entries and reports
- 80%8.0
- Multi-currency management
- 60%6.0
- Intercompany Eliminations
- 60%6.0
- Minority Ownership
- 60%6.0
- Local and consolidated reporting
- 70%7.0
- Detailed Audit Trails
- 100%10.0
- Financial Statement Reporting
- 90%9.0
- Management Reporting
- 100%10.0
- Excel-based Reporting
- 100%10.0
- Automated board and financial reporting
- 100%10.0
- XBRL support for regulatory filing
- 50%5.0
- Personalized dashboards
- 100%10.0
- Color-coded scorecards
- 80%8.0
- KPIs
- 80%8.0
- Cost and profitability analysis
- 100%10.0
- Key Performance Indicator setting
- 90%9.0
- Benchmarking with external data
- 90%9.0
- Flat file integration
- 100%10.0
- Excel data integration
- 100%10.0
- Direct links to 3rd-party data sources
- 90%9.0
- Pixel Perfect reports
- 90%9.0
- Customizable dashboards
- 100%10.0
- Report Formatting Templates
- 100%10.0
- Drill-down analysis
- 80%8.0
- Formatting capabilities
- 100%10.0
- Integration with R or other statistical packages
- 70%7.0
- Report sharing and collaboration
- 80%8.0
- Publish to Web
- 70%7.0
- Publish to PDF
- 100%10.0
- Report Versioning
- 100%10.0
- Report Delivery Scheduling
- 100%10.0
- Pre-built visualization formats (heatmaps, scatter plots etc.)
- 70%7.0
- Location Analytics / Geographic Visualization
- 70%7.0
- Predictive Analytics
- 90%9.0
- Pattern Recognition and Data Mining
- N/AN/A
- Multi-User Support (named login)
- 100%10.0
- Role-Based Security Model
- 100%10.0
- Multiple Access Permission Levels (Create, Read, Delete)
- 100%10.0
- Report-Level Access Control
- N/AN/A
- Single Sign-On (SSO)
- 100%10.0
- Responsive Design for Web Access
- 100%10.0
- Dashboard / Report / Visualization Interactivity on Mobile
- 100%10.0
Great FP&A tool
- Long-term financial planning
- 70%7.0
- Financial budgeting
- 100%10.0
- Management reporting
- 100%10.0
- Financial data consolidation
- 100%10.0
- Journal entries and reports
- 100%10.0
- Multi-currency management
- 60%6.0
- Intercompany Eliminations
- 100%10.0
- Local and consolidated reporting
- 100%10.0
- Detailed Audit Trails
- 100%10.0
- Financial Statement Reporting
- 100%10.0
- Management Reporting
- 90%9.0
- Excel-based Reporting
- 90%9.0
- Automated board and financial reporting
- 90%9.0
- Personalized dashboards
- 80%8.0
- Color-coded scorecards
- 70%7.0
- KPIs
- 70%7.0
- Cost and profitability analysis
- 70%7.0
- Key Performance Indicator setting
- 70%7.0
- Benchmarking with external data
- 70%7.0
- Flat file integration
- 80%8.0
- Excel data integration
- 100%10.0
- Pixel Perfect reports
- 70%7.0
- Customizable dashboards
- 70%7.0
- Report Formatting Templates
- 60%6.0
- Drill-down analysis
- 70%7.0
- Formatting capabilities
- 70%7.0
- Integration with R or other statistical packages
- 70%7.0
- Report sharing and collaboration
- 70%7.0
- Publish to Web
- 70%7.0
- Publish to PDF
- 100%10.0
- Report Versioning
- 80%8.0
- Report Delivery Scheduling
- 70%7.0
- Pre-built visualization formats (heatmaps, scatter plots etc.)
- 70%7.0
- Location Analytics / Geographic Visualization
- 70%7.0
- Predictive Analytics
- 60%6.0
- Multi-User Support (named login)
- 80%8.0
- Role-Based Security Model
- 100%10.0
- Multiple Access Permission Levels (Create, Read, Delete)
- 100%10.0
- Report-Level Access Control
- 100%10.0
- Single Sign-On (SSO)
- 100%10.0
- Responsive Design for Web Access
- 60%6.0
- Dashboard / Report / Visualization Interactivity on Mobile
- 60%6.0
Happy Vena User.
- Long-term financial planning
- 100%10.0
- Financial budgeting
- 100%10.0
- Forecasting
- 100%10.0
- Scenario modeling
- 100%10.0
- Management reporting
- 100%10.0
- Financial Statement Reporting
- 100%10.0
- Management Reporting
- 100%10.0
- Excel-based Reporting
- 100%10.0
- Automated board and financial reporting
- 100%10.0
- Flat file integration
- 100%10.0
- Excel data integration
- 100%10.0
- Drill-down analysis
- 100%10.0
- Formatting capabilities
- 100%10.0
- Report sharing and collaboration
- 100%10.0
- Publish to PDF
- 100%10.0
- Report Versioning
- 100%10.0
- Report Delivery Scheduling
- 100%10.0
- Multi-User Support (named login)
- 100%10.0
- Role-Based Security Model
- 100%10.0
- Multiple Access Permission Levels (Create, Read, Delete)
- 100%10.0
- Report-Level Access Control
- 100%10.0
- Single Sign-On (SSO)
- 100%10.0
Vena for Finance and beyond!
- Long-term financial planning
- 90%9.0
- Financial budgeting
- 90%9.0
- Forecasting
- 100%10.0
- Scenario modeling
- 90%9.0
- Management reporting
- 100%10.0
- Financial data consolidation
- 100%10.0
- Detailed Audit Trails
- 80%8.0
- Financial Statement Reporting
- 100%10.0
- Management Reporting
- 100%10.0
- Excel-based Reporting
- 100%10.0
- Automated board and financial reporting
- 80%8.0
- Cost and profitability analysis
- 90%9.0
- Flat file integration
- 100%10.0
- Excel data integration
- 100%10.0
- Direct links to 3rd-party data sources
- 90%9.0
- Drill-down analysis
- 100%10.0
- Formatting capabilities
- 80%8.0
- Report sharing and collaboration
- 100%10.0
- Publish to PDF
- 90%9.0
- Report Versioning
- 90%9.0
- Report Delivery Scheduling
- 90%9.0
- Multi-User Support (named login)
- 90%9.0
- Role-Based Security Model
- 90%9.0
- Multiple Access Permission Levels (Create, Read, Delete)
- 100%10.0
- Report-Level Access Control
- 100%10.0
Perspective of seasoned Vena adminitrator
- Long-term financial planning
- 100%10.0
- Financial budgeting
- 100%10.0
- Forecasting
- 100%10.0
- Scenario modeling
- 100%10.0
- Management reporting
- 100%10.0
- Financial data consolidation
- 100%10.0
- Journal entries and reports
- N/AN/A
- Multi-currency management
- N/AN/A
- Intercompany Eliminations
- N/AN/A
- Minority Ownership
- N/AN/A
- Local and consolidated reporting
- 100%10.0
- Detailed Audit Trails
- N/AN/A
- Financial Statement Reporting
- 100%10.0
- Management Reporting
- 100%10.0
- Excel-based Reporting
- 100%10.0
- Automated board and financial reporting
- 50%5.0
- XBRL support for regulatory filing
- N/AN/A
- Personalized dashboards
- N/AN/A
- Color-coded scorecards
- N/AN/A
- KPIs
- N/AN/A
- Cost and profitability analysis
- 100%10.0
- Key Performance Indicator setting
- N/AN/A
- Benchmarking with external data
- N/AN/A
- Flat file integration
- 100%10.0
- Excel data integration
- 100%10.0
- Direct links to 3rd-party data sources
- 70%7.0
- Pixel Perfect reports
- 90%9.0
- Customizable dashboards
- N/AN/A
- Report Formatting Templates
- 80%8.0
- Drill-down analysis
- 90%9.0
- Formatting capabilities
- 80%8.0
- Integration with R or other statistical packages
- N/AN/A
- Report sharing and collaboration
- 90%9.0
- Publish to Web
- N/AN/A
- Publish to PDF
- N/AN/A
- Report Versioning
- N/AN/A
- Report Delivery Scheduling
- N/AN/A
- Pre-built visualization formats (heatmaps, scatter plots etc.)
- N/AN/A
- Location Analytics / Geographic Visualization
- N/AN/A
- Predictive Analytics
- N/AN/A
- Pattern Recognition and Data Mining
- N/AN/A
- Multi-User Support (named login)
- 100%10.0
- Role-Based Security Model
- 100%10.0
- Multiple Access Permission Levels (Create, Read, Delete)
- 100%10.0
- Report-Level Access Control
- N/AN/A
- Single Sign-On (SSO)
- 100%10.0
- Responsive Design for Web Access
- 80%8.0
- Dashboard / Report / Visualization Interactivity on Mobile
- N/AN/A
Vena! Great for centralizing data and easy-to-use for end users
- Long-term financial planning
- 90%9.0
- Financial budgeting
- 100%10.0
- Forecasting
- 100%10.0
- Scenario modeling
- N/AN/A
- Management reporting
- 90%9.0
- Financial data consolidation
- 70%7.0
- Journal entries and reports
- N/AN/A
- Multi-currency management
- N/AN/A
- Intercompany Eliminations
- 70%7.0
- Minority Ownership
- N/AN/A
- Local and consolidated reporting
- 100%10.0
- Detailed Audit Trails
- 40%4.0
- Financial Statement Reporting
- 90%9.0
- Management Reporting
- 90%9.0
- Excel-based Reporting
- 100%10.0
- Automated board and financial reporting
- N/AN/A
- XBRL support for regulatory filing
- N/AN/A
- Personalized dashboards
- N/AN/A
- Color-coded scorecards
- N/AN/A
- KPIs
- 90%9.0
- Cost and profitability analysis
- N/AN/A
- Key Performance Indicator setting
- 70%7.0
- Benchmarking with external data
- N/AN/A
- Flat file integration
- 100%10.0
- Excel data integration
- 100%10.0
- Direct links to 3rd-party data sources
- 30%3.0
- Pixel Perfect reports
- N/AN/A
- Customizable dashboards
- N/AN/A
- Report Formatting Templates
- N/AN/A
- Drill-down analysis
- 100%10.0
- Formatting capabilities
- 90%9.0
- Integration with R or other statistical packages
- N/AN/A
- Report sharing and collaboration
- 70%7.0
- Publish to Web
- N/AN/A
- Publish to PDF
- N/AN/A
- Report Versioning
- 80%8.0
- Report Delivery Scheduling
- N/AN/A
- Pre-built visualization formats (heatmaps, scatter plots etc.)
- N/AN/A
- Location Analytics / Geographic Visualization
- N/AN/A
- Predictive Analytics
- N/AN/A
- Pattern Recognition and Data Mining
- N/AN/A
- Multi-User Support (named login)
- 100%10.0
- Role-Based Security Model
- 100%10.0
- Multiple Access Permission Levels (Create, Read, Delete)
- 100%10.0
- Report-Level Access Control
- 100%10.0
- Single Sign-On (SSO)
- N/AN/A
- Responsive Design for Web Access
- N/AN/A
- Dashboard / Report / Visualization Interactivity on Mobile
- N/AN/A
Vena Review
- Long-term financial planning
- 70%7.0
- Financial budgeting
- 70%7.0
- Forecasting
- 70%7.0
- Scenario modeling
- 80%8.0
- Management reporting
- 80%8.0
- Financial data consolidation
- 70%7.0
- Journal entries and reports
- 60%6.0
- Multi-currency management
- 60%6.0
- Intercompany Eliminations
- 80%8.0
- Minority Ownership
- 70%7.0
- Local and consolidated reporting
- 80%8.0
- Detailed Audit Trails
- 80%8.0
- Financial Statement Reporting
- 70%7.0
- Management Reporting
- 70%7.0
- Excel-based Reporting
- 70%7.0
- Automated board and financial reporting
- 80%8.0
- XBRL support for regulatory filing
- 60%6.0
- Personalized dashboards
- 90%9.0
- Color-coded scorecards
- 60%6.0
- KPIs
- 70%7.0
- Cost and profitability analysis
- 70%7.0
- Key Performance Indicator setting
- 70%7.0
- Benchmarking with external data
- 60%6.0
- Flat file integration
- 40%4.0
- Excel data integration
- 70%7.0
- Direct links to 3rd-party data sources
- 70%7.0
- Pixel Perfect reports
- 60%6.0
- Customizable dashboards
- 80%8.0
- Report Formatting Templates
- 50%5.0
- Drill-down analysis
- 90%9.0
- Formatting capabilities
- 100%10.0
- Integration with R or other statistical packages
- 60%6.0
- Report sharing and collaboration
- 100%10.0
- Publish to Web
- 40%4.0
- Publish to PDF
- 80%8.0
- Report Versioning
- 80%8.0
- Report Delivery Scheduling
- 80%8.0
- Pre-built visualization formats (heatmaps, scatter plots etc.)
- 80%8.0
- Location Analytics / Geographic Visualization
- 90%9.0
- Predictive Analytics
- 90%9.0
- Pattern Recognition and Data Mining
- 90%9.0
- Multi-User Support (named login)
- 80%8.0
- Role-Based Security Model
- 70%7.0
- Multiple Access Permission Levels (Create, Read, Delete)
- 70%7.0
- Report-Level Access Control
- 80%8.0
- Single Sign-On (SSO)
- 70%7.0
- Responsive Design for Web Access
- 90%9.0
- Dashboard / Report / Visualization Interactivity on Mobile
- 80%8.0
Trust Vena
- Long-term financial planning
- N/AN/A
- Financial budgeting
- 80%8.0
- Forecasting
- 80%8.0
- Scenario modeling
- 80%8.0
- Management reporting
- 80%8.0
- Financial Statement Reporting
- 90%9.0
- Management Reporting
- 80%8.0
- Excel-based Reporting
- 90%9.0
- Flat file integration
- 80%8.0
- Excel data integration
- 90%9.0
- Direct links to 3rd-party data sources
- 80%8.0
- Drill-down analysis
- 80%8.0
- Formatting capabilities
- 80%8.0
- Report sharing and collaboration
- 80%8.0
- Report Versioning
- 90%9.0
- Report Delivery Scheduling
- 80%8.0
- Role-Based Security Model
- 90%9.0
- Multiple Access Permission Levels (Create, Read, Delete)
- 90%9.0
- Report-Level Access Control
- 90%9.0
- Single Sign-On (SSO)
- 90%9.0
- Dashboard / Report / Visualization Interactivity on Mobile
- N/AN/A
Vote Vena for non profits!
- Long-term financial planning
- 100%10.0
- Financial budgeting
- 100%10.0
- Forecasting
- 100%10.0
- Scenario modeling
- 100%10.0
- Management reporting
- 100%10.0
- Financial data consolidation
- 100%10.0
- Journal entries and reports
- N/AN/A
- Multi-currency management
- N/AN/A
- Intercompany Eliminations
- N/AN/A
- Minority Ownership
- N/AN/A
- Local and consolidated reporting
- N/AN/A
- Detailed Audit Trails
- 100%10.0
- Financial Statement Reporting
- 100%10.0
- Management Reporting
- 100%10.0
- Excel-based Reporting
- 100%10.0
- Automated board and financial reporting
- 100%10.0
- XBRL support for regulatory filing
- N/AN/A
- Personalized dashboards
- N/AN/A
- Color-coded scorecards
- N/AN/A
- KPIs
- N/AN/A
- Cost and profitability analysis
- N/AN/A
- Key Performance Indicator setting
- N/AN/A
- Benchmarking with external data
- N/AN/A
- Flat file integration
- 100%10.0
- Excel data integration
- 100%10.0
- Direct links to 3rd-party data sources
- 100%10.0
- Pixel Perfect reports
- N/AN/A
- Customizable dashboards
- N/AN/A
- Report Formatting Templates
- N/AN/A
- Drill-down analysis
- 100%10.0
- Formatting capabilities
- 100%10.0
- Integration with R or other statistical packages
- N/AN/A
- Report sharing and collaboration
- 100%10.0
- Publish to Web
- N/AN/A
- Publish to PDF
- N/AN/A
- Pre-built visualization formats (heatmaps, scatter plots etc.)
- N/AN/A
- Location Analytics / Geographic Visualization
- N/AN/A
- Predictive Analytics
- N/AN/A
- Pattern Recognition and Data Mining
- N/AN/A
- Multi-User Support (named login)
- 100%10.0
- Role-Based Security Model
- 100%10.0
- Multiple Access Permission Levels (Create, Read, Delete)
- 100%10.0
- Report-Level Access Control
- N/AN/A
- Single Sign-On (SSO)
- N/AN/A
- Responsive Design for Web Access
- N/AN/A
- Dashboard / Report / Visualization Interactivity on Mobile
- N/AN/A
Vena - A Timely, User Friendly Budgeting Solution
- Long-term financial planning
- 70%7.0
- Financial budgeting
- 90%9.0
- Forecasting
- 90%9.0
- Scenario modeling
- 80%8.0
- Management reporting
- 60%6.0
- Financial data consolidation
- 90%9.0
- Journal entries and reports
- 70%7.0
- Multi-currency management
- N/AN/A
- Intercompany Eliminations
- N/AN/A
- Minority Ownership
- N/AN/A
- Local and consolidated reporting
- 80%8.0
- Detailed Audit Trails
- 70%7.0
- Financial Statement Reporting
- 60%6.0
- Management Reporting
- 50%5.0
- Excel-based Reporting
- 70%7.0
- Automated board and financial reporting
- N/AN/A
- XBRL support for regulatory filing
- N/AN/A
- Personalized dashboards
- N/AN/A
- Color-coded scorecards
- N/AN/A
- KPIs
- N/AN/A
- Cost and profitability analysis
- N/AN/A
- Key Performance Indicator setting
- N/AN/A
- Benchmarking with external data
- N/AN/A
- Flat file integration
- 80%8.0
- Excel data integration
- 70%7.0
- Direct links to 3rd-party data sources
- 60%6.0
- Pixel Perfect reports
- N/AN/A
- Customizable dashboards
- N/AN/A
- Report Formatting Templates
- N/AN/A
- Drill-down analysis
- 80%8.0
- Formatting capabilities
- 90%9.0
- Integration with R or other statistical packages
- N/AN/A
- Report sharing and collaboration
- N/AN/A
- Publish to Web
- N/AN/A
- Publish to PDF
- N/AN/A
- Report Versioning
- N/AN/A
- Report Delivery Scheduling
- N/AN/A
- Pre-built visualization formats (heatmaps, scatter plots etc.)
- N/AN/A
- Location Analytics / Geographic Visualization
- N/AN/A
- Predictive Analytics
- N/AN/A
- Pattern Recognition and Data Mining
- N/AN/A
- Multi-User Support (named login)
- 100%10.0
- Role-Based Security Model
- 90%9.0
- Multiple Access Permission Levels (Create, Read, Delete)
- 90%9.0
- Report-Level Access Control
- 90%9.0
- Single Sign-On (SSO)
- 100%10.0
- Responsive Design for Web Access
- N/AN/A
- Dashboard / Report / Visualization Interactivity on Mobile
- N/AN/A
Vena has been helpful with our financial reports and budget process
- Long-term financial planning
- 90%9.0
- Financial budgeting
- 80%8.0
- Forecasting
- 90%9.0
- Scenario modeling
- 70%7.0
- Management reporting
- 60%6.0
- Financial data consolidation
- N/AN/A
- Journal entries and reports
- N/AN/A
- Multi-currency management
- N/AN/A
- Intercompany Eliminations
- N/AN/A
- Minority Ownership
- N/AN/A
- Local and consolidated reporting
- N/AN/A
- Detailed Audit Trails
- N/AN/A
- Financial Statement Reporting
- 80%8.0
- Management Reporting
- 60%6.0
- Excel-based Reporting
- 80%8.0
- Automated board and financial reporting
- 50%5.0
- XBRL support for regulatory filing
- N/AN/A
- Personalized dashboards
- N/AN/A
- Color-coded scorecards
- N/AN/A
- KPIs
- N/AN/A
- Cost and profitability analysis
- N/AN/A
- Key Performance Indicator setting
- N/AN/A
- Benchmarking with external data
- N/AN/A
- Flat file integration
- N/AN/A
- Excel data integration
- 80%8.0
- Direct links to 3rd-party data sources
- N/AN/A
- Pixel Perfect reports
- N/AN/A
- Customizable dashboards
- N/AN/A
- Report Formatting Templates
- N/AN/A
- Drill-down analysis
- 70%7.0
- Formatting capabilities
- 70%7.0
- Integration with R or other statistical packages
- N/AN/A
- Report sharing and collaboration
- 50%5.0
- Publish to Web
- N/AN/A
- Publish to PDF
- N/AN/A
- Report Versioning
- N/AN/A
- Report Delivery Scheduling
- N/AN/A
- Pre-built visualization formats (heatmaps, scatter plots etc.)
- N/AN/A
- Location Analytics / Geographic Visualization
- N/AN/A
- Predictive Analytics
- N/AN/A
- Pattern Recognition and Data Mining
- N/AN/A
- Multi-User Support (named login)
- N/AN/A
- Role-Based Security Model
- N/AN/A
- Multiple Access Permission Levels (Create, Read, Delete)
- N/AN/A
- Report-Level Access Control
- N/AN/A
- Single Sign-On (SSO)
- N/AN/A
- Responsive Design for Web Access
- N/AN/A
- Dashboard / Report / Visualization Interactivity on Mobile
- N/AN/A
It's the real deal!
- Long-term financial planning
- 100%10.0
- Financial budgeting
- N/AN/A
- Forecasting
- 100%10.0
- Scenario modeling
- 100%10.0
- Management reporting
- 100%10.0
- Financial data consolidation
- 100%10.0
- Local and consolidated reporting
- 90%9.0
- Detailed Audit Trails
- 90%9.0
- Financial Statement Reporting
- 100%10.0
- Management Reporting
- 100%10.0
- Excel-based Reporting
- 100%10.0
- Automated board and financial reporting
- 90%9.0
- Personalized dashboards
- 90%9.0
- KPIs
- 90%9.0
- Key Performance Indicator setting
- 90%9.0
- Benchmarking with external data
- N/AN/A
- Flat file integration
- 80%8.0
- Excel data integration
- 80%8.0
- Direct links to 3rd-party data sources
- 80%8.0
- Pixel Perfect reports
- N/AN/A
- Customizable dashboards
- N/AN/A
- Report Formatting Templates
- N/AN/A
- Drill-down analysis
- 90%9.0
- Formatting capabilities
- 90%9.0
- Integration with R or other statistical packages
- N/AN/A
- Report sharing and collaboration
- 90%9.0
- Publish to Web
- 10%1.0
- Publish to PDF
- N/AN/A
- Report Versioning
- 100%10.0
- Report Delivery Scheduling
- 10%1.0
- Pre-built visualization formats (heatmaps, scatter plots etc.)
- N/AN/A
- Location Analytics / Geographic Visualization
- N/AN/A
- Predictive Analytics
- N/AN/A
- Pattern Recognition and Data Mining
- N/AN/A
- Multi-User Support (named login)
- N/AN/A
- Role-Based Security Model
- 100%10.0
- Multiple Access Permission Levels (Create, Read, Delete)
- 100%10.0
- Report-Level Access Control
- 100%10.0
- Single Sign-On (SSO)
- 100%10.0
Vena is the anchor of our finance organization
- Long-term financial planning
- 80%8.0
- Financial budgeting
- 100%10.0
- Forecasting
- 100%10.0
- Scenario modeling
- 80%8.0
- Management reporting
- 90%9.0
- Financial data consolidation
- 100%10.0
- Journal entries and reports
- 70%7.0
- Multi-currency management
- N/AN/A
- Intercompany Eliminations
- 80%8.0
- Minority Ownership
- N/AN/A
- Local and consolidated reporting
- 80%8.0
- Detailed Audit Trails
- 100%10.0
- Financial Statement Reporting
- 100%10.0
- Management Reporting
- 100%10.0
- Excel-based Reporting
- 100%10.0
- Automated board and financial reporting
- 80%8.0
- XBRL support for regulatory filing
- N/AN/A
- Personalized dashboards
- N/AN/A
- Color-coded scorecards
- N/AN/A
- KPIs
- N/AN/A
- Cost and profitability analysis
- N/AN/A
- Key Performance Indicator setting
- N/AN/A
- Benchmarking with external data
- N/AN/A
- Flat file integration
- 70%7.0
- Excel data integration
- 90%9.0
- Direct links to 3rd-party data sources
- N/AN/A
- Pixel Perfect reports
- N/AN/A
- Customizable dashboards
- N/AN/A
- Report Formatting Templates
- N/AN/A
- Drill-down analysis
- 60%6.0
- Formatting capabilities
- 60%6.0
- Integration with R or other statistical packages
- N/AN/A
- Report sharing and collaboration
- N/AN/A
- Publish to Web
- N/AN/A
- Publish to PDF
- N/AN/A
- Report Versioning
- N/AN/A
- Report Delivery Scheduling
- N/AN/A
- Pre-built visualization formats (heatmaps, scatter plots etc.)
- N/AN/A
- Location Analytics / Geographic Visualization
- N/AN/A
- Predictive Analytics
- N/AN/A
- Pattern Recognition and Data Mining
- N/AN/A
- Multi-User Support (named login)
- 80%8.0
- Role-Based Security Model
- 80%8.0
- Multiple Access Permission Levels (Create, Read, Delete)
- N/AN/A
- Report-Level Access Control
- N/AN/A
- Single Sign-On (SSO)
- N/AN/A
- Responsive Design for Web Access
- N/AN/A
- Dashboard / Report / Visualization Interactivity on Mobile
- N/AN/A
Vena very helpful for our planning needs
- Financial budgeting
- 100%10.0
- Forecasting
- 70%7.0
- Management reporting
- 100%10.0
- Journal entries and reports
- 90%9.0
- Local and consolidated reporting
- 90%9.0
- Detailed Audit Trails
- 90%9.0
- Financial Statement Reporting
- 100%10.0
- Management Reporting
- 80%8.0
- Excel-based Reporting
- 100%10.0
- Cost and profitability analysis
- 50%5.0
- Flat file integration
- 100%10.0
- Drill-down analysis
- 70%7.0
- Formatting capabilities
- 70%7.0
- Report sharing and collaboration
- 70%7.0
- Multi-User Support (named login)
- 100%10.0
- Role-Based Security Model
- 90%9.0
- Multiple Access Permission Levels (Create, Read, Delete)
- 90%9.0
- Report-Level Access Control
- 90%9.0
- Single Sign-On (SSO)
- 100%10.0
Great CRM tool that has continued to grow with our company as our needs and reporting evolve
- Long-term financial planning
- 100%10.0
- Financial budgeting
- 100%10.0
- Forecasting
- 100%10.0
- Scenario modeling
- 100%10.0
- Management reporting
- 100%10.0
- Financial data consolidation
- N/AN/A
- Journal entries and reports
- N/AN/A
- Multi-currency management
- N/AN/A
- Intercompany Eliminations
- N/AN/A
- Minority Ownership
- N/AN/A
- Local and consolidated reporting
- 100%10.0
- Detailed Audit Trails
- 100%10.0
- Financial Statement Reporting
- 100%10.0
- Management Reporting
- 100%10.0
- Excel-based Reporting
- 100%10.0
- Automated board and financial reporting
- 100%10.0
- XBRL support for regulatory filing
- N/AN/A
- Personalized dashboards
- N/AN/A
- Color-coded scorecards
- N/AN/A
- KPIs
- 100%10.0
- Cost and profitability analysis
- 100%10.0
- Key Performance Indicator setting
- 100%10.0
- Benchmarking with external data
- N/AN/A
- Flat file integration
- 100%10.0
- Excel data integration
- 100%10.0
- Direct links to 3rd-party data sources
- 100%10.0
- Pixel Perfect reports
- N/AN/A
- Customizable dashboards
- N/AN/A
- Report Formatting Templates
- N/AN/A
- Drill-down analysis
- 80%8.0
- Formatting capabilities
- 100%10.0
- Integration with R or other statistical packages
- N/AN/A
- Report sharing and collaboration
- 100%10.0
- Publish to Web
- N/AN/A
- Publish to PDF
- N/AN/A
- Report Versioning
- 100%10.0
- Report Delivery Scheduling
- N/AN/A
- Pre-built visualization formats (heatmaps, scatter plots etc.)
- N/AN/A
- Location Analytics / Geographic Visualization
- N/AN/A
- Predictive Analytics
- N/AN/A
- Pattern Recognition and Data Mining
- N/AN/A
- Multi-User Support (named login)
- 100%10.0
- Role-Based Security Model
- 100%10.0
- Multiple Access Permission Levels (Create, Read, Delete)
- 100%10.0
- Report-Level Access Control
- 100%10.0
- Single Sign-On (SSO)
- 100%10.0
- Responsive Design for Web Access
- N/AN/A
- Dashboard / Report / Visualization Interactivity on Mobile
- N/AN/A
New Implementation for Budgeting
- Long-term financial planning
- 100%10.0
- Financial budgeting
- 100%10.0
- Forecasting
- 80%8.0
- Scenario modeling
- 100%10.0
- Management reporting
- 90%9.0
- Financial data consolidation
- N/AN/A
- Journal entries and reports
- N/AN/A
- Multi-currency management
- N/AN/A
- Intercompany Eliminations
- N/AN/A
- Minority Ownership
- N/AN/A
- Local and consolidated reporting
- N/AN/A
- Detailed Audit Trails
- N/AN/A
- Financial Statement Reporting
- N/AN/A
- Management Reporting
- N/AN/A
- Excel-based Reporting
- N/AN/A
- Automated board and financial reporting
- N/AN/A
- XBRL support for regulatory filing
- N/AN/A
- Personalized dashboards
- N/AN/A
- Color-coded scorecards
- N/AN/A
- KPIs
- N/AN/A
- Cost and profitability analysis
- N/AN/A
- Key Performance Indicator setting
- N/AN/A
- Benchmarking with external data
- N/AN/A
- Flat file integration
- N/AN/A
- Excel data integration
- N/AN/A
- Direct links to 3rd-party data sources
- N/AN/A
- Pixel Perfect reports
- N/AN/A
- Customizable dashboards
- N/AN/A
- Report Formatting Templates
- N/AN/A
- Drill-down analysis
- N/AN/A
- Formatting capabilities
- N/AN/A
- Integration with R or other statistical packages
- N/AN/A
- Report sharing and collaboration
- N/AN/A
- Publish to Web
- N/AN/A
- Publish to PDF
- N/AN/A
- Report Versioning
- N/AN/A
- Report Delivery Scheduling
- N/AN/A
- Pre-built visualization formats (heatmaps, scatter plots etc.)
- N/AN/A
- Location Analytics / Geographic Visualization
- N/AN/A
- Predictive Analytics
- N/AN/A
- Multi-User Support (named login)
- N/AN/A
- Role-Based Security Model
- N/AN/A
- Multiple Access Permission Levels (Create, Read, Delete)
- N/AN/A
- Single Sign-On (SSO)
- N/AN/A
- Responsive Design for Web Access
- N/AN/A
- Dashboard / Report / Visualization Interactivity on Mobile
- N/AN/A
- Long-term financial planning
- N/AN/A
- Financial budgeting
- 90%9.0
- Forecasting
- 100%10.0
- Scenario modeling
- N/AN/A
- Management reporting
- 100%10.0
- Financial data consolidation
- 100%10.0
- Journal entries and reports
- 80%8.0
- Multi-currency management
- N/AN/A
- Intercompany Eliminations
- N/AN/A
- Minority Ownership
- N/AN/A
- Local and consolidated reporting
- 100%10.0
- Detailed Audit Trails
- 100%10.0
- Financial Statement Reporting
- 100%10.0
- Management Reporting
- 80%8.0
- Excel-based Reporting
- 100%10.0
- Automated board and financial reporting
- N/AN/A
- XBRL support for regulatory filing
- N/AN/A
- Personalized dashboards
- 100%10.0
- Color-coded scorecards
- N/AN/A
- KPIs
- N/AN/A
- Cost and profitability analysis
- N/AN/A
- Key Performance Indicator setting
- N/AN/A
- Benchmarking with external data
- N/AN/A
- Flat file integration
- 100%10.0
- Excel data integration
- 100%10.0
- Direct links to 3rd-party data sources
- 100%10.0
- Pixel Perfect reports
- N/AN/A
- Customizable dashboards
- N/AN/A
- Report Formatting Templates
- N/AN/A
- Drill-down analysis
- 100%10.0
- Formatting capabilities
- 100%10.0
- Integration with R or other statistical packages
- N/AN/A
- Report sharing and collaboration
- 90%9.0
- Publish to Web
- 100%10.0
- Publish to PDF
- 100%10.0
- Report Versioning
- 100%10.0
- Report Delivery Scheduling
- 100%10.0
- Pre-built visualization formats (heatmaps, scatter plots etc.)
- N/AN/A
- Location Analytics / Geographic Visualization
- N/AN/A
- Predictive Analytics
- N/AN/A
- Pattern Recognition and Data Mining
- N/AN/A
- Multi-User Support (named login)
- 100%10.0
- Role-Based Security Model
- 100%10.0
- Multiple Access Permission Levels (Create, Read, Delete)
- 100%10.0
- Report-Level Access Control
- 100%10.0
- Single Sign-On (SSO)
- 100%10.0
- Responsive Design for Web Access
- N/AN/A
- Dashboard / Report / Visualization Interactivity on Mobile
- N/AN/A
- Long-term financial planning
- 80%8.0
- Financial budgeting
- 90%9.0
- Forecasting
- 90%9.0
- Scenario modeling
- 90%9.0
- Management reporting
- 90%9.0
- Financial data consolidation
- 80%8.0
- Journal entries and reports
- 90%9.0
- Multi-currency management
- 90%9.0
- Intercompany Eliminations
- 90%9.0
- Minority Ownership
- 90%9.0
- Local and consolidated reporting
- 90%9.0
- Detailed Audit Trails
- 80%8.0
- Financial Statement Reporting
- 90%9.0
- Management Reporting
- 80%8.0
- Excel-based Reporting
- 90%9.0
- Automated board and financial reporting
- 90%9.0
- XBRL support for regulatory filing
- 90%9.0
- Personalized dashboards
- 80%8.0
- Color-coded scorecards
- 90%9.0
- KPIs
- 90%9.0
- Cost and profitability analysis
- 70%7.0
- Key Performance Indicator setting
- 80%8.0
- Benchmarking with external data
- 90%9.0
- Flat file integration
- 90%9.0
- Excel data integration
- 90%9.0
- Direct links to 3rd-party data sources
- 90%9.0
- Pixel Perfect reports
- 90%9.0
- Customizable dashboards
- 80%8.0
- Report Formatting Templates
- 90%9.0
- Drill-down analysis
- 90%9.0
- Formatting capabilities
- 90%9.0
- Integration with R or other statistical packages
- 90%9.0
- Report sharing and collaboration
- 90%9.0
- Publish to Web
- 90%9.0
- Publish to PDF
- 90%9.0
- Report Versioning
- 90%9.0
- Report Delivery Scheduling
- 90%9.0
- Pre-built visualization formats (heatmaps, scatter plots etc.)
- 90%9.0
- Location Analytics / Geographic Visualization
- 80%8.0
- Predictive Analytics
- 80%8.0
- Pattern Recognition and Data Mining
- 90%9.0
- Multi-User Support (named login)
- 90%9.0
- Role-Based Security Model
- 90%9.0
- Multiple Access Permission Levels (Create, Read, Delete)
- 90%9.0
- Report-Level Access Control
- 90%9.0
- Single Sign-On (SSO)
- 90%9.0
- Responsive Design for Web Access
- 90%9.0
- Dashboard / Report / Visualization Interactivity on Mobile
- 90%9.0
Power of Automation
- Long-term financial planning
- 80%8.0
- Financial budgeting
- 80%8.0
- Forecasting
- 80%8.0
- Scenario modeling
- 80%8.0
- Management reporting
- 80%8.0
- Financial data consolidation
- 90%9.0
- Journal entries and reports
- 80%8.0
- Multi-currency management
- 50%5.0
- Intercompany Eliminations
- 80%8.0
- Minority Ownership
- N/AN/A
- Local and consolidated reporting
- 80%8.0
- Detailed Audit Trails
- 80%8.0
- Financial Statement Reporting
- 80%8.0
- Management Reporting
- 80%8.0
- Excel-based Reporting
- 80%8.0
- Automated board and financial reporting
- 90%9.0
- XBRL support for regulatory filing
- N/AN/A
- Personalized dashboards
- 70%7.0
- Color-coded scorecards
- N/AN/A
- KPIs
- N/AN/A
- Cost and profitability analysis
- 70%7.0
- Key Performance Indicator setting
- N/AN/A
- Benchmarking with external data
- N/AN/A
- Flat file integration
- 80%8.0
- Excel data integration
- 80%8.0
- Direct links to 3rd-party data sources
- N/AN/A
- Pixel Perfect reports
- N/AN/A
- Customizable dashboards
- N/AN/A
- Report Formatting Templates
- 80%8.0
- Drill-down analysis
- 80%8.0
- Formatting capabilities
- 80%8.0
- Integration with R or other statistical packages
- N/AN/A
- Report sharing and collaboration
- 80%8.0
- Publish to Web
- N/AN/A
- Publish to PDF
- 80%8.0
- Report Versioning
- 80%8.0
- Report Delivery Scheduling
- N/AN/A
- Pre-built visualization formats (heatmaps, scatter plots etc.)
- N/AN/A
- Location Analytics / Geographic Visualization
- N/AN/A
- Predictive Analytics
- N/AN/A
- Pattern Recognition and Data Mining
- N/AN/A
- Multi-User Support (named login)
- 80%8.0
- Role-Based Security Model
- 80%8.0
- Multiple Access Permission Levels (Create, Read, Delete)
- 80%8.0
- Report-Level Access Control
- 80%8.0
- Single Sign-On (SSO)
- 80%8.0
- Responsive Design for Web Access
- N/AN/A
- Dashboard / Report / Visualization Interactivity on Mobile
- N/AN/A
Vena Review
- Long-term financial planning
- 100%10.0
- Financial budgeting
- 100%10.0
- Forecasting
- 100%10.0
- Scenario modeling
- 100%10.0
- Management reporting
- 100%10.0
- Financial data consolidation
- 80%8.0
- Journal entries and reports
- 90%9.0
- Multi-currency management
- 80%8.0
- Intercompany Eliminations
- 80%8.0
- Minority Ownership
- 80%8.0
- Local and consolidated reporting
- 80%8.0
- Detailed Audit Trails
- 100%10.0
- Financial Statement Reporting
- 100%10.0
- Management Reporting
- 100%10.0
- Excel-based Reporting
- 100%10.0
- Automated board and financial reporting
- 100%10.0
- Personalized dashboards
- 100%10.0
- KPIs
- 100%10.0
- Cost and profitability analysis
- 100%10.0
- Key Performance Indicator setting
- 90%9.0
- Flat file integration
- 90%9.0
- Excel data integration
- 90%9.0
- Direct links to 3rd-party data sources
- 100%10.0
- Customizable dashboards
- 90%9.0
- Report Formatting Templates
- 90%9.0
- Drill-down analysis
- 100%10.0
- Formatting capabilities
- 100%10.0
- Report sharing and collaboration
- 100%10.0
- Publish to PDF
- 70%7.0
- Report Versioning
- 100%10.0
- Report Delivery Scheduling
- 90%9.0
- Pre-built visualization formats (heatmaps, scatter plots etc.)
- 90%9.0
- Location Analytics / Geographic Visualization
- 90%9.0
- Predictive Analytics
- 90%9.0
- Pattern Recognition and Data Mining
- 90%9.0
- Role-Based Security Model
- 100%10.0
- Multiple Access Permission Levels (Create, Read, Delete)
- 90%9.0
- Report-Level Access Control
- N/AN/A
- Single Sign-On (SSO)
- 100%10.0