Plotly Dash vs. Spotfire Data Science
Plotly Dash vs. Spotfire Data Science
| Product | Rating | Most Used By | Product Summary | Starting Price |
|---|---|---|---|---|
 Plotly Dash | N/A | Plotly headquartered in Montreal creates data visualization and UI tools for ML, data science, engineering, and the sciences with language support for Python, R, Julia, and JS. Plotly's Dash aims to empower teams to build data science and ML apps that put Python, R, and Julia in the hands of business users. The vendor states that full stack apps that would typically require a front-end, backend, and dev ops team can be built and deployed in hours by data scientists with Dash. | N/A | |
 Spotfire Data Science | N/A | Spotfire Data Science (formerly TIBCO Data Science) is a comprehensive platform for operationalizing data science, allowing users to scale data science across an organization to solve complex challenges faster and speed innovation. It is designed to enable data scientists to create innovative solutions using the latest machine learning techniques and open source developments. Create ML pipelines using a point-and-click UI or code. Orchestrate analytics using the tools, languages, and any… | N/A |
| Plotly Dash | Spotfire Data Science | |||||||||||||||
|---|---|---|---|---|---|---|---|---|---|---|---|---|---|---|---|---|
| Editions & Modules | No answers on this topic | No answers on this topic | ||||||||||||||
| Offerings |
| |||||||||||||||
| Entry-level Setup Fee | No setup fee | No setup fee | ||||||||||||||
| Additional Details | — | — | ||||||||||||||
| More Pricing Information | ||||||||||||||||
| Plotly Dash | Spotfire Data Science | |
|---|---|---|
| Top Pros | ||
| Top Cons |
|
|
| Plotly Dash | Spotfire Data Science | |||||||||||||||
|---|---|---|---|---|---|---|---|---|---|---|---|---|---|---|---|---|
| Platform Connectivity |
| |||||||||||||||
| Data Exploration |
| |||||||||||||||
| Data Preparation |
| |||||||||||||||
| Platform Data Modeling |
| |||||||||||||||
| Model Deployment |
|
| Plotly Dash | Spotfire Data Science | |
|---|---|---|
| Small Businesses |  IBM SPSS Modeler Score 7.8 out of 10 | IBM SPSS Modeler Score 7.8 out of 10 |
| Medium-sized Companies |  Mathematica Score 8.2 out of 10 | Mathematica Score 8.2 out of 10 |
| Enterprises | IBM SPSS Modeler Score 7.8 out of 10 | IBM SPSS Modeler Score 7.8 out of 10 |
| All Alternatives | View all alternatives | View all alternatives |
| Plotly Dash | Spotfire Data Science | |
|---|---|---|
| Likelihood to Recommend | 8.0 (4 ratings) | 9.0 (16 ratings) |
| Likelihood to Renew | - (0 ratings) | 6.4 (1 ratings) |
| Plotly Dash | Spotfire Data Science | |
|---|---|---|
| Likelihood to Recommend | Plotly
| Spotfire
 Thomas Young Owner, previous CEO |
| Pros | Plotly
| Spotfire
 Abigail Bowden Geologist |
| Cons | Plotly
| Spotfire
 Steve Wagner Director, Network Design and Logistics Analytics |
| Likelihood to Renew | Plotly No answers on this topic | Spotfire
|
| Alternatives Considered | Plotly | Spotfire
|
| Return on Investment | Plotly
| Spotfire
|
| ScreenShots | Spotfire Data Science Screenshots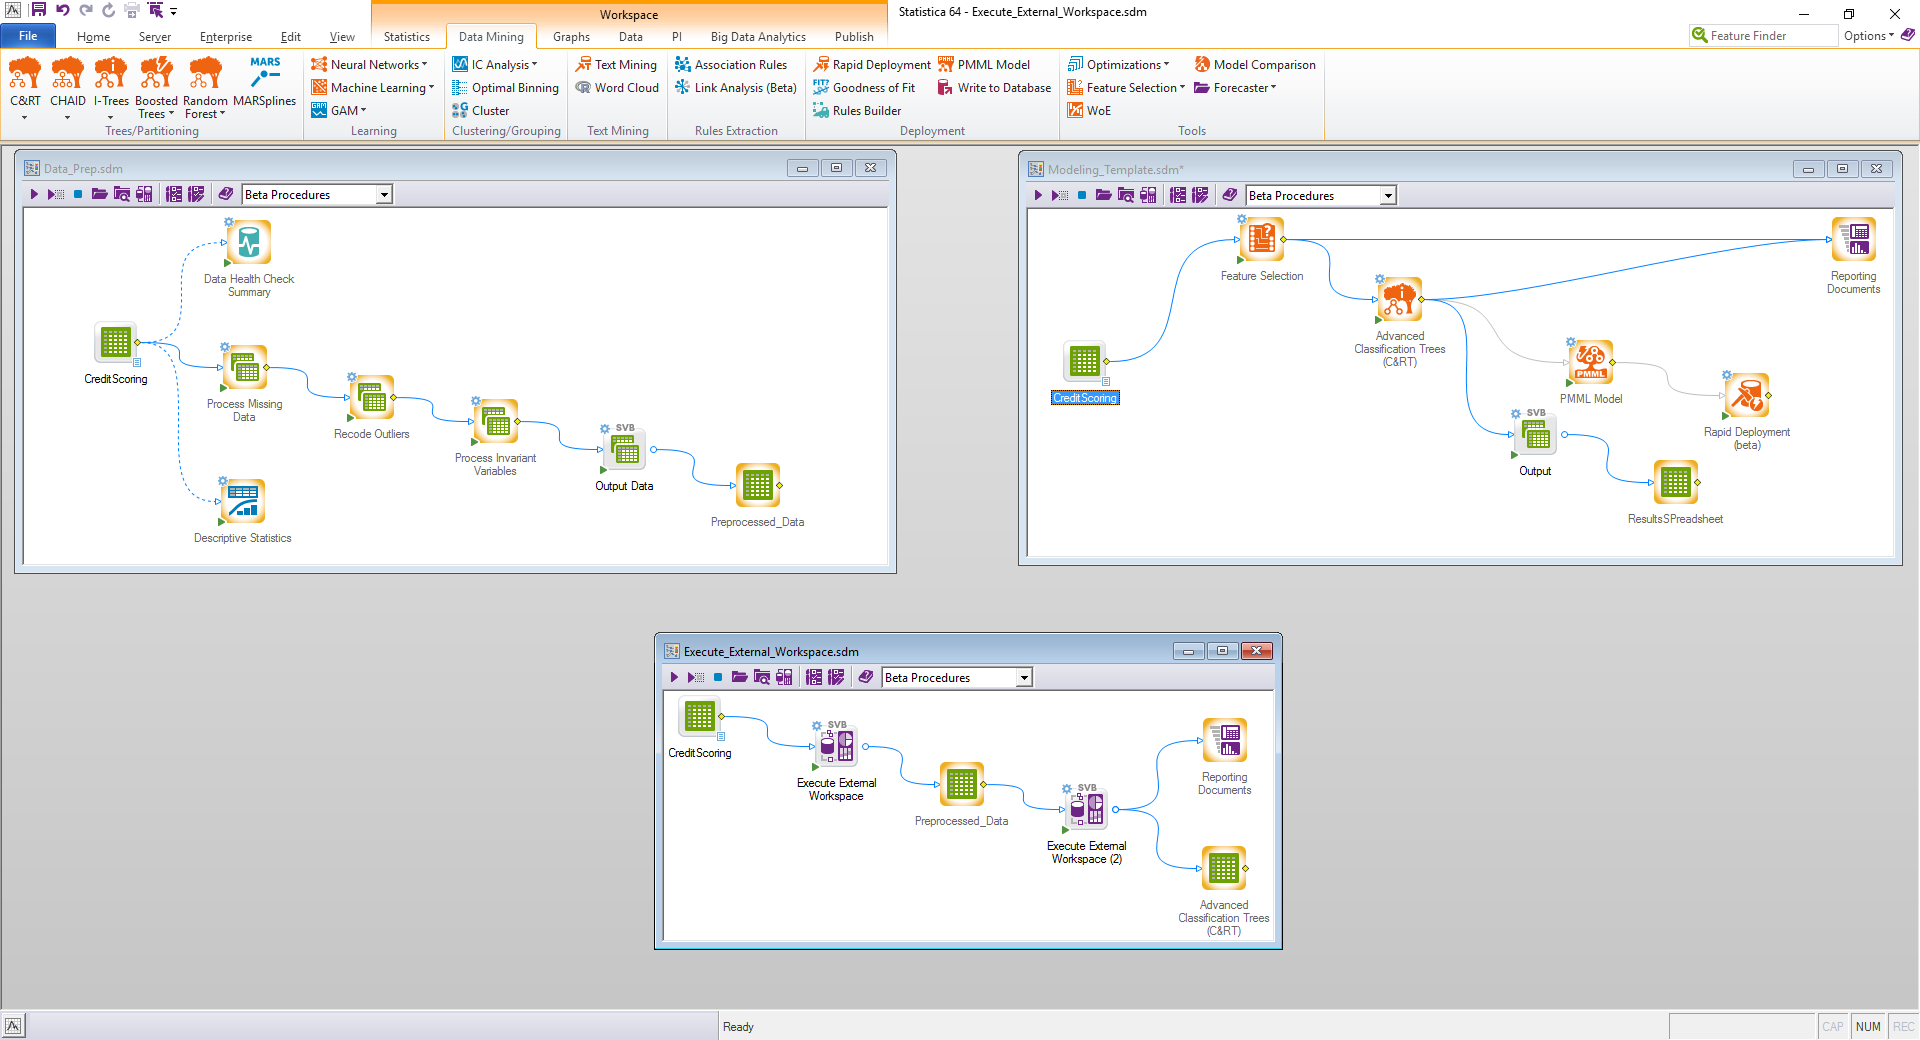 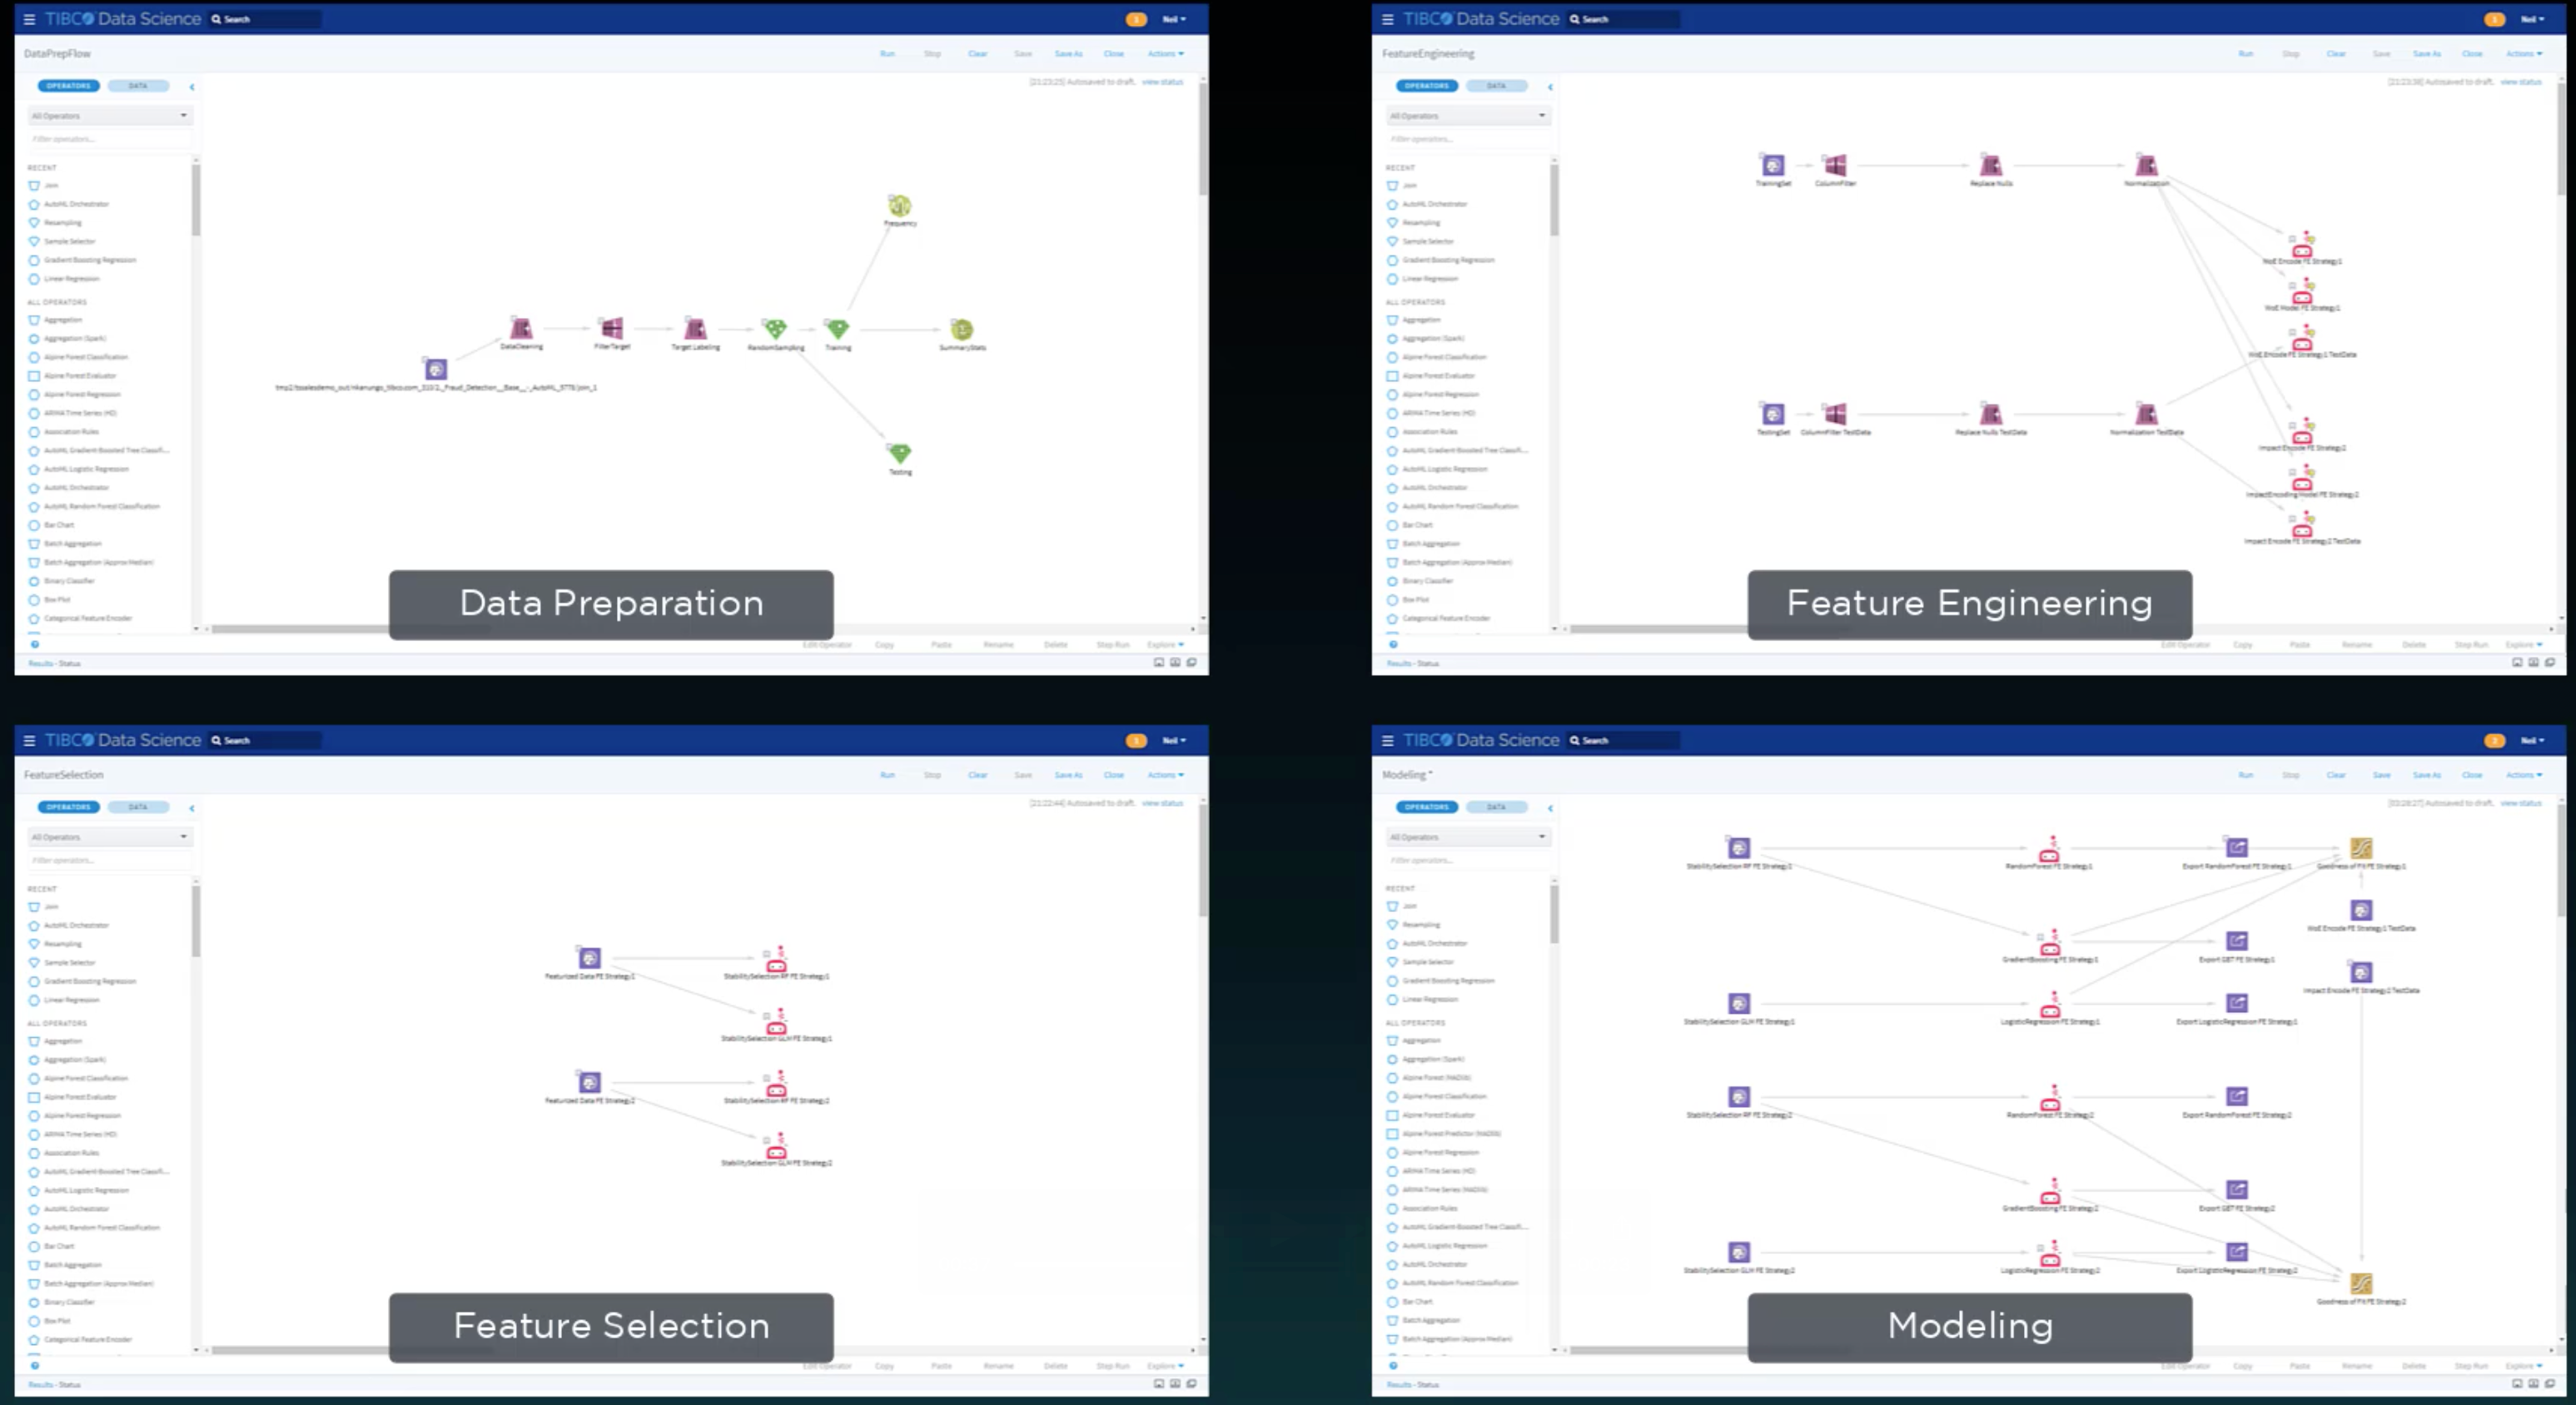   |