PRTG Network Monitor vs. SolarWinds Database Performance Monitor

Overview
ProductRatingMost Used ByProduct SummaryStarting Price
PRTG
Score 8.5 out of 10
N/A
PRTG Network Monitor is the flagship offering from German software company Paessler, for monitoring local and wide area networks (LANs & WANs), servers, websites, apps, and more.
$1,750
perpetual license
SolarWinds Database Performance Monitor
Score 8.9 out of 10
N/A
VividCortex, acquired by SolarWinds in December 2019, provides database performance monitoring designed to increase system performance, team efficiency, and infrastructure cost savings. The GDPR- and SOC 2-compliant platform offers visibility into major open-source databases—MySQL, PostgreSQL, Amazon Aurora, MongoDB, and Redis—for the engineering team at scale. Industry leaders like Etsy, GitHub, SendGrid, and Yelp rely on Database Performance Monitor for all-query monitoring and drill…N/A
Pricing
PRTG Network MonitorSolarWinds Database Performance Monitor
Editions & Modules
PRTG 500
1,750
perpetual license
PRTG 1,000
3,200
perpetual license
PRTG 2,500
6,500
perpetual license
PRTG 5,000
11,500
perpetual license
PRTG XL 1
15,500
perpetual license
PRTG Enterprise
Custom Pricing
subscription license
No answers on this topic
Offerings
Pricing Offerings
PRTGSolarWinds Database Performance Monitor
Free Trial
YesYes
Free/Freemium Version
NoNo
Premium Consulting/Integration Services
NoYes
Entry-level Setup FeeNo setup feeNo setup fee
Additional Details
More Pricing Information
Community Pulse
PRTG Network MonitorSolarWinds Database Performance Monitor
Top Pros
Top Cons
Features
PRTG Network MonitorSolarWinds Database Performance Monitor
Network Performance Monitoring
Comparison of Network Performance Monitoring features of Product A and Product B
PRTG Network Monitor
7.0
55 Ratings
16% below category average
SolarWinds Database Performance Monitor
-
Ratings
Automated network device discovery7.349 Ratings00 Ratings
Network monitoring7.554 Ratings00 Ratings
Baseline threshold calculation6.647 Ratings00 Ratings
Alerts7.555 Ratings00 Ratings
Network capacity planning6.539 Ratings00 Ratings
Packet capture analysis5.228 Ratings00 Ratings
Network mapping7.539 Ratings00 Ratings
Customizable reports7.348 Ratings00 Ratings
Wireless infrastructure monitoring7.338 Ratings00 Ratings
Hardware health monitoring6.752 Ratings00 Ratings
Best Alternatives
PRTG Network MonitorSolarWinds Database Performance Monitor
Small Businesses
NinjaOne
NinjaOne
Score 9.2 out of 10

No answers on this topic

Medium-sized Companies
Nmap
Nmap
Score 8.8 out of 10
Redgate SQL Monitor
Redgate SQL Monitor
Score 8.2 out of 10
Enterprises
Nmap
Nmap
Score 8.8 out of 10
Redgate SQL Monitor
Redgate SQL Monitor
Score 8.2 out of 10
All AlternativesView all alternativesView all alternatives
User Ratings
PRTG Network MonitorSolarWinds Database Performance Monitor
Likelihood to Recommend
8.4
(55 ratings)
8.0
(1 ratings)
Likelihood to Renew
10.0
(2 ratings)
-
(0 ratings)
Usability
9.0
(1 ratings)
-
(0 ratings)
Support Rating
8.5
(17 ratings)
-
(0 ratings)
User Testimonials
PRTG Network MonitorSolarWinds Database Performance Monitor
Likelihood to Recommend
Paessler
If there are a number of different protocols and devices to monitor PRTG is really an all in one solution. There are network specific solutions, telephony solutions, server solutions, etc - but this tool can do anything. Even if you don't use this tool as your main "monitoring solutions" every IT professional should have access to this tool for at least troubleshooting purposes. If you are looking for something specific built for a task you may be able to find [a] more direct and easy tool to use that would be easier and quicker to setup as customization is not needed.
Read full review
SolarWinds
Computing resources consumed by the DB instance, DPA queries & wait time, deadlock conditions, virtual infrastructure resources. The addition of NPM & DPA integration as well as cross-correlation in the identification of issues with the network or server or DB is all stupid-proof. Monitoring is more than just health and resource consumption, it's also performance. DB performance analysis is key to maintaining healthy DB instances.
Read full review
Pros
Paessler
  • Very, very configurable. You can create all kinds of monitors for all kinds of things. Plus it has loads of suggestions out of the box. It can get complicated but monitoring is complicated. Pretty decent interface and good support - active community.
  • I really liked how easy it was to add alerts by SMS. So easy to setup.
  • I like their sizing models (for purchase). We're actually small enough that we are free. But it's not free as in stripped down - it's free because we don't use many "sensors" and don't honestly have the need.
Read full review
SolarWinds
  • Simple to use and very easy to learn.
  • The execution engines run in parallel, can execute any syntax or query.
  • DPN can run all queries for both Oracle and SQL with no additional support.
Read full review
Cons
Paessler
  • The probe service can be quite resource-intensive. This can cause false-positive readings from some sensors sometimes.
  • The software gets updated very regularly. Whilst this is usually a good thing to fix bugs etc, it does meantime downtime of the monitoring quite often while they are installed.
  • The ability to create Maps from Libraries. Very specific issue but a lot of people have been asking for it for years and it is still not available.
Read full review
SolarWinds
  • The Reporting feature currently doesn't allow customization.
Read full review
Likelihood to Renew
Paessler
It is now an essential tool for monitoring and maintaining the health of our network and systems.
Read full review
SolarWinds
No answers on this topic
Usability
Paessler
The tool is very intuitive to use and it is Windows-based (everybody knows how to use Windows) so it's easy to get into. Every time is setup in a hierarchy so if you have a good initial hierarchy design, it will really reduce administrative effort down the road.
Read full review
SolarWinds
No answers on this topic
Support Rating
Paessler
I am giving this a 6 simply because I have never had to contact support. The online documentation is adequate for most things, and the user-maintained knowledgebase is excellent. The few times I have run into issues that were not easily resolvable with intuitive UI, I was able to find the answers that I needed either in the PRTG-provided documentation, the knowledgebase, or with a quick online web search.
Read full review
SolarWinds
No answers on this topic
Alternatives Considered
Paessler
I have deployed and tested three products for evaluation I found [PRTG Network Monitor] very easy to deploy, the deployment literally took not more than one hour including basic configuration and network discovery. After deployment few configuration changes and creation of maps, reports and little tweaking is required. [Then] it would go through its process of recommendation that took some time to complete, while [on] other hand other software's took lot of time to install and configure. And features were also missing, which resulted in decision in favor of [PRTG Network Monitor].
Read full review
SolarWinds
DPM is less expensive and more feature-rich. Also, Oracle tech support is garbage, unless you can afford to spend a day getting assistance.
Read full review
Return on Investment
Paessler
  • The ability to analyze multiple pieces of information in one place, especially with historical data, has saved our IT department time and headaches. It would be so much more difficult to trace an issue without PRTG, just relying on event logs and an open task manager window.
  • The cost is not cheap, so it's an expense that hits the bottom line like everything else. Figure in hardware costs as well, ideally a server outside of your main environment.
  • I keep saying this, but the historical data piece is worth so much. There's really no good way to collect all of that information in one place without something like PRTG. And that definitely saves time and money in the long run.
Read full review
SolarWinds
  • What is the cost of a downed DB instance? That's your ROI. DPM lets you see issues before they become critical.
Read full review
ScreenShots

SolarWinds Database Performance Monitor Screenshots
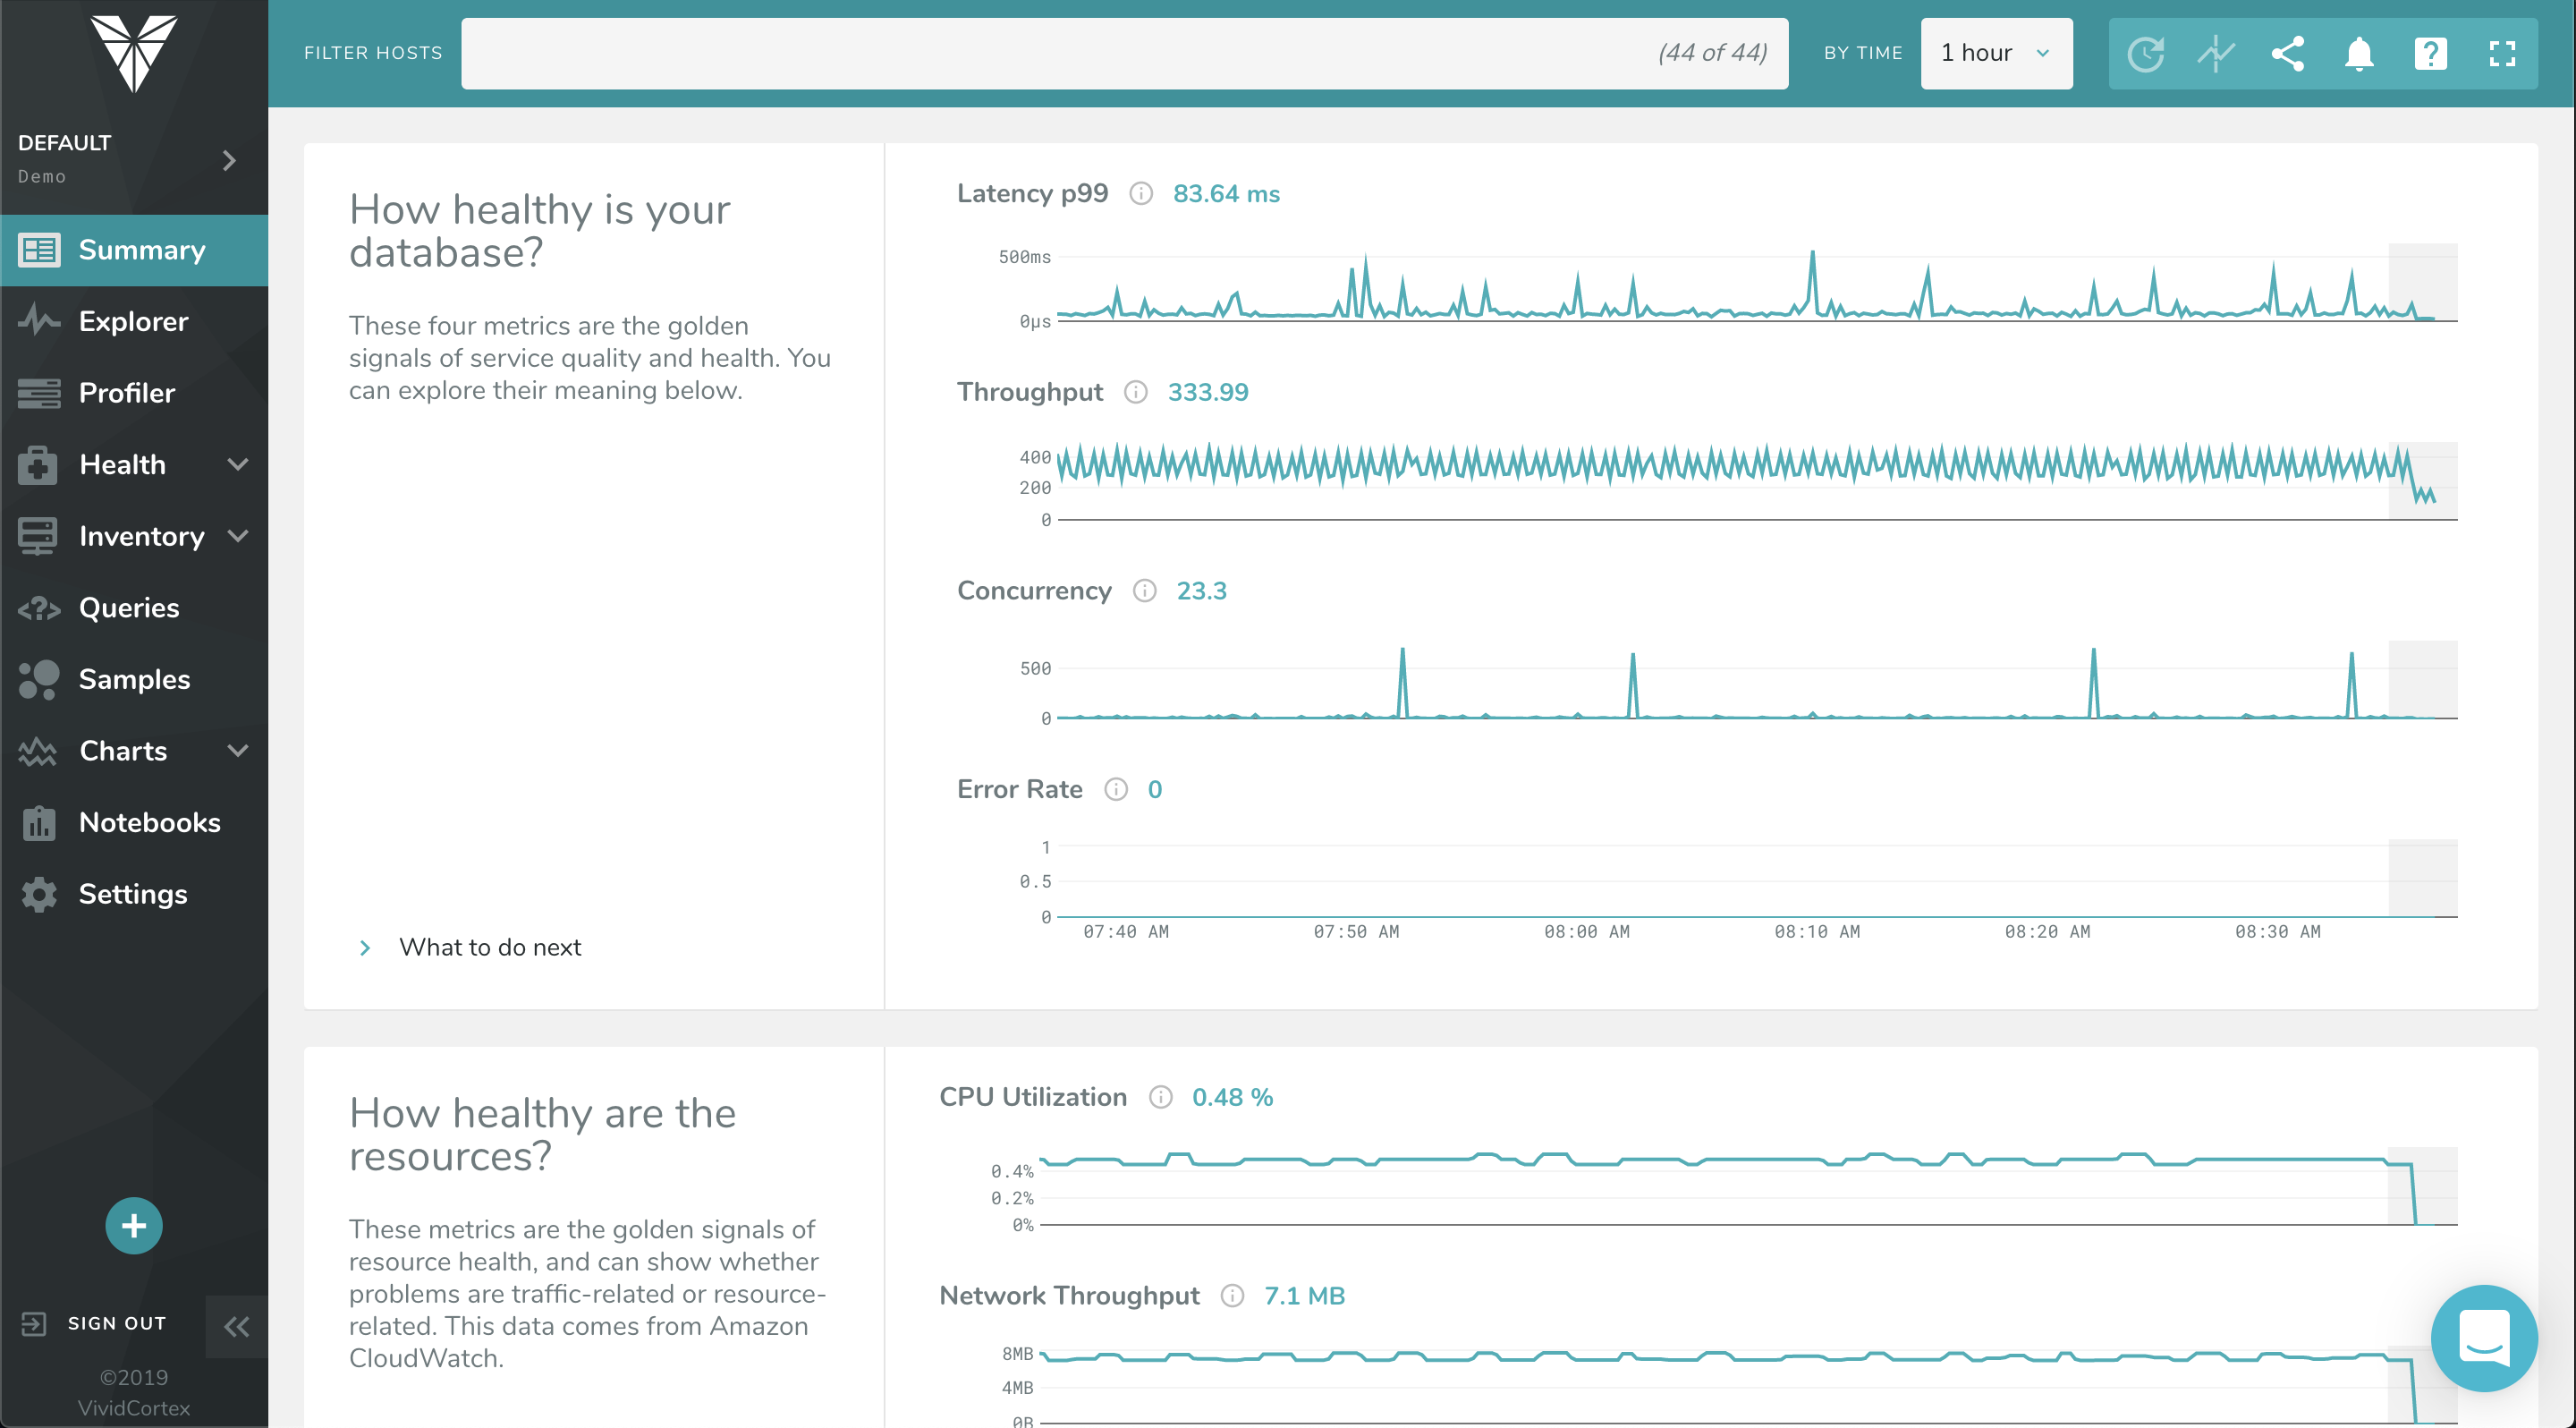
Screenshot of The Profiler Dashboard is a powerful, dynamic dashboard for ranking and filtering activity on your servers: It can instantly show you what needs attention and it provides a unified view of all your database types that VividCortex monitors. It enables you to view and understand your system by profiling it according to its most significant attributes—customized and selected by you.Screenshot of This dashboard displays a list of queries and allows you to filter them with powerful specificity. Filters can be set according to query text, host, and timeframe when the query was first seen / last active.Screenshot of VividCortex captures an enormous amount of data, and the Summary Dashboard helps users make sense of it, reducing their time-to-insight. It features widgets with automatic displays for Top 5 Queries by Total Time, Top 5 Queries by User CPU, Application Overview, Critical Events, and more.Screenshot of VividCortex monitors thousands of metrics in your system, and the Charts and Dashboard’s navigation pane allows you to toggle, customize, and enable various categories of generated charts. You can then easily navigate and examine the charts’ metrics with mouseover and zoom capabilities.