Google Charts provides a way to visualize data on your website - for free. From simple line charts to complex hierarchical tree maps, the chart gallery provides a large number of ready-to-use chart types. The most common way to use Google Charts is with simple JavaScript that you embed in your web page.
N/A
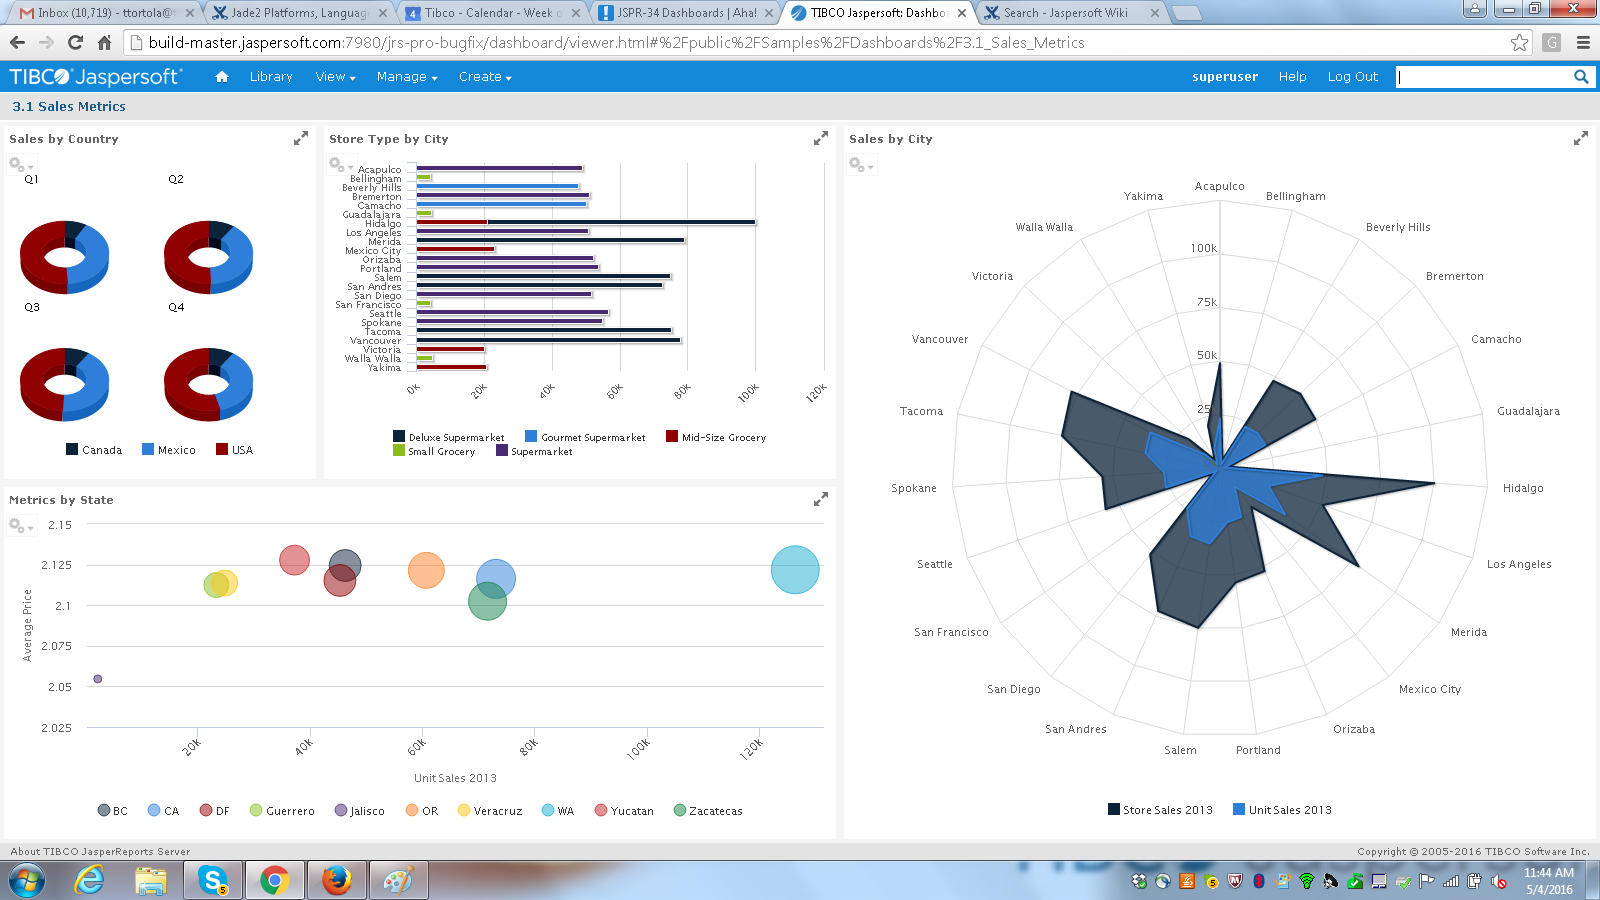
Jaspersoft
Score 6.7 out of 10
N/A
Jaspersoft commercial edition is an embedded business intelligence suite designed to be built-into SaaS products as an integrated reporting engine. It provides reports and dashboards for customer-facing applications without requiring app developers to build their own reporting engine.
N/A
Pricing
Google Charts
Jaspersoft
Editions & Modules
No answers on this topic
No answers on this topic
Offerings
Pricing Offerings
Google Charts
Jaspersoft
Free Trial
No
Yes
Free/Freemium Version
Yes
Yes
Premium Consulting/Integration Services
No
Yes
Entry-level Setup Fee
No setup fee
No setup fee
Additional Details
—
Jaspersoft offers flexible pricing for ISVs and SaaS per customer or by CPU core.
We can easily recommend Google Charts to any company that needs a way to visually represent their data. Another great thing about Google Charts is that it is free to use and does not require any membership fees. Although it requires a skilled used to be able to use the charts, the results are great and can be beneficial to any company who is looking to make better decisions.
It is well suited for the fact of scalability itself and the breadth of features this application has in order to make the migration from legacy systems to the newer different versions more seamless and effective. Data integrity and security are the main aspects of this tool which does not lose their value when doing day-to-day operations for data mapping.
they're free with Google suite and they have backing in terms of powerful Google apps which can be plugged in to perform multiple actions like using Google sheets to import raw data into Google Charts
they're the most simple app to use when it comes to creating charts and visual dashboards
ease of customization
ease of using custom APIs from developers side to help make any types of charts and dashboards you want
TIBCO Jaspersoft allows you to embed reports into your own application, which gives users the feeling they are using a single product.
TIBCO Jaspersoft Studio allows for more advanced report development, such as adding subreports, drilldown to detail reports, images, page headers, page footers, maps, and more.
TIBCO's Jaspersoft Domain Designer is very easy to use and navigate.
I would like a couple more introductory videos or a live chat option for when you run into an issue. I think this is a Google-wide problem, not only linked to Google Charts.
I have run into some issues with the Dynamic Data but also admittedly could potentially dive in deeper and investigate.
It would be great if Google Charts made it possible to integrate Google Chat into the platform.
One of the issues we found during our implementation was that the reporting software would work faster for certain data sources and not the others. Extracting CSVs and XML was slower in comparison to JSON in our experience.
Jaspersoft Studio was the main IDE we used for development. Built atop the Eclipse IDE, we found that the tool was really resource intensive and generally take long time to initialize.
Google Charts is a good product. It's widely supported with deep documentation and a large community. But for me, it wasn't customizable enough. When we started with simple charts, it was great, but as we got deeper and more complex, our needs outgrew the library. If I was going forward, I would choose a more barebones library with more freedom and extensibility.
JasperSoft has been amazing. It is well documented, fast, and transparent in how it functions. We have been very confident in JasperSoft in every aspect of our business and offerings where we've used it. On top of that, their improvements to the product have been fantastic. I am really looking forward to seeing where they take their product and how we can leverage that to please our clients
Google Charts is about as easy to use as the rest of their applications. The UI is very well thought out, allowing you to add what you need, and customize it to your exact liking. The default theme is actually really nice, which helps as most of the time, customizing is not needed.
I think it's a tool well suited for a software developer. Others with less coding skills could struggle somewhat with the tool. I find java a little unforgiving as a language for expressions and not very user friendly for the technically dis-inclined. Sometimes the numeric conversions cause issues (who knew that 0 and 0.0 would cause different things to happen). Previous experience with a reporting tool that used visual basic for its' expressions that I found much simpler to use. On the other hand, java is so widespread, you can easily google the syntax to accomplish what you need to do.
As a free tool with massively powerful, infinitely customisable charts that can be dynamically updated - Google Charts is my favourite data visualisation tool. However, my hatred of JavaScript does jade my view on it. This is the price of the tool though, and I'm glad it's available for me.
They have a great customer support ticketing system in which they always respond same-day. They offer conference calls with srcreensharing as well in order to better understand your issues.
I wish that the lower level support access came with more than just 12 cases per year though as this makes us less likely to reach out for questions on things that we then instead try to solve ourselves which results in loss of time in trying to acquire new features and or solve a problem.
It did the job of getting us to our deadline we set for ourselves for initial launch. The customer we launched the product for was also there to learn about it at the same in order to better understand the capabilities. This helped greatly so that the customer was on the same page on what was possible when using jaspersoft. I think most people would not want their customers aware the product they are using is third-party but in this case it was a new experience for us both and so as we learned more about jaspersoft, we both had better communication on what the future road map was for their business needs in BI.
Resources available in the TIBCO Knowledge Base are covering almost everything. They are well organized, and covering almost every possibility. There is always the change to get back to the TIBCO support or to the dedicated Customer Success Manager whenever something very specific or bound to a customization is not covered.
Having just completed an upgrade to the latest version of Jaspersoft, I am happy to say their support was very good. There were a couple of small challenges which were not easily resolved, but they were primarily related to the fact that we had skipped updates for a couple of versions. The current update procedures assumed we were upgrading from the prior latest version (6.4) to to the new version (7.1).
Google Charts stacks up better since it is free and does not have the constant pressure for cost overruns, add-ons, annual maintenance and implementation services. The speed of using Google Charts is quick, saving users potentially weeks in getting up and going. For the readers of websites with limited resources, the application shows up nicely is look and feel with charts. Great way of showing data visually.
When looking at the different features of these reporting engines, and what we were going to be using it for, the answer seemed clear. Jasper offered exactly what we were looking for, and did so for a price that we were happy with. For a scalable, feature-rich reporting engine that doesn't break the bank, Jaspersoft is the way to go.
When we demo our Jaspersoft environment to potential clients, their eyes light up and they sit up in their chairs a bit more. A lot of our meetings have ended with with the client very interested in our product due to Jaspersoft.
Our existing clients have been very satisfied with the adhoc features of Jaspersoft. We've been able to provide them better access to their data on their terms instead of ours. Of course this turns into a huge win for us.
We've always used SQL Server Reporting Services to deliver our reports to our clients. Converting to Jaspersoft has allowed us to generate the reporting layer that our clients demand. They no longer feel like they are settling for what we offer.