Datadog is a monitoring service for IT, Dev and Ops teams who write and run applications at scale, and want to turn the massive amounts of data produced by their apps, tools and services into actionable insight.
$0
Up to 5 hosts
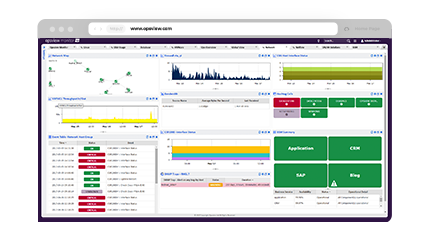
Opsview Monitor
Score 8.8 out of 10
N/A
Opsview Monitor is an IT infrastructure and application monitoring solution. It monitors the infrastructure, applications, and endpoints of a network, and supports add-ons for automation and data exporting. Opsview also offers a free version of Monitor.
I am listing how Datadog is better than below chosen NotSensu - Datadog has more integrations and easy to use UI. Prometheus - Datadog Integration are more in number than, simple installation process
DataDog Is well suited to all of the Infrastructure Monitoring Solutions, DB monitoring, and other Network monitoring also. It's not well suited because it cannot give perfect Infrastructure recommendations for our use case but also For example: If we are using AWS DB to monitor performance insights then Datadog is less effective there because AWS gives very niche recommendations.
If you know Nagios or Nagios-like monitoring systems, OpsView will be really easy for you to learn and manage. Migrations process will be relatively easy. You're getting great U/I that will speed up adding new objects to the system and present data in a clear, organized way. In addition it's easy to create dedicated dashboards for your clients.
APIs, the ability to interact with the data we pull into data dog is key. We port the information over to Servicenow, so the ability to pull everything into DataDog, then Servicenow, is a key component of our success here at Wayfair.
Simple Interface - clean, useful, effective. Allows users to use DataDog for one reason, get work done.
We had a couple "integrations" that had some issues during setup, but Support addressed them very quickly
Unnecessary alerts about DataDog components...by the time I see them, they're almost always also fixed
I wish there was a DataDog mobile app that would have dedicated alerts (configurable per alert to override Do Not Disturb setting) instead of relying on emails notifications that could be overlooked in the midst of many incoming emails around the same time.
The support team usually gets it right. We did have a rather complicate issue setting up monitoring on a domain controller. However, they are usually responsive and helpful over chat. The downside would be I don’t think they have any phone support. If that is important to you this might not be a good fit.
We are still trying other products, but people still like Datadog. After setting up a dashboard, it's great for monitoring instances on Datadog. Also, the DevOps team had a good time setting up Datadog. It means Datadog was way easier to set up compared to those others.