Rational BI vs. SAS Visual Analytics

Overview
ProductRatingMost Used ByProduct SummaryStarting Price
Rational BI
Score 7.7 out of 10
Enterprise companies (1,001+ employees)
Rational BI provides analytics, data science and business intelligence in an analytical platform that connects to databases, data files and cloud drives including AWS and Azure data sources, enabling users to explore and visualize data. Users can build real-time notebook-style reports directly in a web browser with JavaScript and SQL with direct and live connections to data. Filter and query data with an SQL database embedded in the client, without network…
$0
single user
SAS Visual Analytics
Score 8.3 out of 10
Enterprise companies (1,001+ employees)
SAS Visual Analytics provides a complete platform for analytics visualization, enabling users to identify patterns and relationships in data that weren't initially evident. Interactive, self-service BI and reporting capabilities are combined with out-of-the-box advanced analytics so everyone can discover insights from any size and type of data, including text.
$0
Annual By Users: 5, 10, 20
Pricing
Rational BISAS Visual Analytics
Editions & Modules
Free
$0
single user
Professional
$129
single user
Enterprise
Varies
single user
SAS Visual Analytics for SAS Cloud
Annual By Users: 5, 10, 20
Offerings
Pricing Offerings
Rational BISAS Visual Analytics
Free Trial
YesYes
Free/Freemium Version
YesNo
Premium Consulting/Integration Services
YesYes
Entry-level Setup FeeOptionalNo setup fee
Additional DetailsAdditional cost per extra user (varies by edition)SAS Visual Statistics and SAS Office Analytics are also available as add-ons.
More Pricing Information
Features
Rational BISAS Visual Analytics
BI Standard Reporting
Comparison of BI Standard Reporting features of Product A and Product B
Rational BI
8.3
4 Ratings
1% below category average
SAS Visual Analytics
8.3
12 Ratings
1% above category average
Pixel Perfect reports7.63 Ratings8.012 Ratings
Customizable dashboards8.74 Ratings8.012 Ratings
Report Formatting Templates8.54 Ratings9.011 Ratings
Ad-hoc Reporting
Comparison of Ad-hoc Reporting features of Product A and Product B
Rational BI
8.3
4 Ratings
3% above category average
SAS Visual Analytics
8.8
13 Ratings
8% above category average
Drill-down analysis7.73 Ratings9.013 Ratings
Formatting capabilities8.24 Ratings8.013 Ratings
Integration with R or other statistical packages8.03 Ratings8.011 Ratings
Report sharing and collaboration9.24 Ratings10.012 Ratings
Report Output and Scheduling
Comparison of Report Output and Scheduling features of Product A and Product B
Rational BI
9.0
4 Ratings
7% above category average
SAS Visual Analytics
9.2
13 Ratings
10% above category average
Publish to Web9.03 Ratings9.012 Ratings
Publish to PDF9.04 Ratings9.013 Ratings
Report Versioning8.63 Ratings9.010 Ratings
Report Delivery Scheduling9.24 Ratings10.012 Ratings
Delivery to Remote Servers9.33 Ratings9.07 Ratings
Data Discovery and Visualization
Comparison of Data Discovery and Visualization features of Product A and Product B
Rational BI
8.2
4 Ratings
0% above category average
SAS Visual Analytics
9.7
11 Ratings
18% above category average
Pre-built visualization formats (heatmaps, scatter plots etc.)8.24 Ratings10.010 Ratings
Location Analytics / Geographic Visualization8.33 Ratings10.011 Ratings
Predictive Analytics8.03 Ratings9.010 Ratings
Access Control and Security
Comparison of Access Control and Security features of Product A and Product B
Rational BI
-
Ratings
SAS Visual Analytics
8.3
12 Ratings
3% below category average
Multi-User Support (named login)00 Ratings9.012 Ratings
Role-Based Security Model00 Ratings8.011 Ratings
Multiple Access Permission Levels (Create, Read, Delete)00 Ratings8.012 Ratings
Single Sign-On (SSO)00 Ratings8.08 Ratings
Mobile Capabilities
Comparison of Mobile Capabilities features of Product A and Product B
Rational BI
-
Ratings
SAS Visual Analytics
8.3
10 Ratings
4% above category average
Responsive Design for Web Access00 Ratings10.010 Ratings
Mobile Application00 Ratings9.08 Ratings
Dashboard / Report / Visualization Interactivity on Mobile00 Ratings9.09 Ratings
Application Program Interfaces (APIs) / Embedding
Comparison of Application Program Interfaces (APIs) / Embedding features of Product A and Product B
Rational BI
-
Ratings
SAS Visual Analytics
9.2
6 Ratings
15% above category average
REST API00 Ratings10.05 Ratings
Javascript API00 Ratings9.05 Ratings
iFrames00 Ratings9.05 Ratings
Java API00 Ratings9.05 Ratings
Themeable User Interface (UI)00 Ratings9.05 Ratings
Customizable Platform (Open Source)00 Ratings9.03 Ratings
Best Alternatives
Rational BISAS Visual Analytics
Small Businesses
IBM SPSS Modeler
IBM SPSS Modeler
Score 7.8 out of 10
BrightGauge
BrightGauge
Score 8.9 out of 10
Medium-sized Companies
Mathematica
Mathematica
Score 8.2 out of 10
Reveal
Reveal
Score 9.9 out of 10
Enterprises
IBM SPSS Modeler
IBM SPSS Modeler
Score 7.8 out of 10
Jaspersoft Community Edition
Score 9.7 out of 10
All AlternativesView all alternativesView all alternatives
User Ratings
Rational BISAS Visual Analytics
Likelihood to Recommend
7.7
(4 ratings)
9.0
(18 ratings)
Likelihood to Renew
-
(0 ratings)
9.3
(3 ratings)
Usability
8.7
(4 ratings)
6.0
(1 ratings)
Support Rating
7.7
(4 ratings)
8.0
(3 ratings)
User Testimonials
Rational BISAS Visual Analytics
Likelihood to Recommend
Rational BI
Definitely well suited for small companies, but again many of their competitors are also well suited in this segment. We were in general happy with the solution provided, but I'm not blown away by their solution or support. If you want to get more data-driven visual boards with data displayed in nice graphics is in my opinion a good start, and here Rational BI delivers what it should.
Read full review
SAS
I was in a meeting with the client and there I have to show them some analytic data to them. But I was confused about how I will manage to show big data to clients with accuracy. But then the SAS Visual Analytics software helps me in presenting accurate data at the moment and it was very presentable and through that, I got the deal for that business.
Read full review
Pros
Rational BI
  • Arrange data.
  • Dashboard.
  • Automatic reports.
Read full review
SAS
  • Provides the flexibility to the end user to slice and dice the data.
  • Anyone can make predictive models with the help of in-built algorithms without the need to write a single line of code or knowledge of what's under the hood of algorithms.
  • The feature to simply ask a question related to data and getting a response in form of text, chart or graph is amazing.
Read full review
Cons
Rational BI
  • Not seeing anything at this time, comprehensive product.
Read full review
SAS
  • SAS is relatively expensive when compared to other BI tools and requires a large amount of upfront fee which becomes an issue for smaller organizations.
  • UI for the dashboards looks a little date in comparison to competitors like Tableau and Microstrategy.
  • Integration with other open source software like Python needs to be built in.
Read full review
Likelihood to Renew
Rational BI
No answers on this topic
SAS
SAS really is the cutting edge in Business Intelligence. That is all they do! They are constantly coming out with new products, product upgrades, and their tech support is second to none. In addition, their support of Education has made our ability to acquire their product possible.
Read full review
Usability
Rational BI
Overall Rational BI is a valuable enterprise reporting tool for any data driven organization. It offers great depth and breadth of features for reporting and analytics that can lead to better business outcomes. Its easy to use and highly configurable to evolve to changing reporting needs of organizations of any scale.
Read full review
SAS
SAS BI is good for creating reports and dashboards and then sharing it with the users. It also has ability to manage access to the reports and dashboards but somehow with most of the world moving to open source languages R, Python and Julia, SAS BI feels to be archaic in terms of feature set and integrations it allow[s]. Also, comparing it with other Business Intelligence tools like Tableau and Microsoft BI, the functionality of SAS BI is very limited and doesn't justify the pricing.
Read full review
Support Rating
Rational BI
I haven't used the support myself, but my colleagues have been satisfied with the support. As I have understood from my colleagues the support is as you could expect. Still, the documentation could be better and that could avoid the need to contact their support, but overall we're still happy with the support as well.
Read full review
SAS
When you call tech support, you are immediately routed to a person who can answer your question. Often they can answer on the spot. However, if they cannot, you are given a track number and then followed up with. There have been times when I have had multiple track numbers open and they will actually TRACK YOU DOWN to ensure that your problem has been resolved. Issues do not fall into black holes with SAS. They are also willing to do a WebEx with you to diagnose the problem by seeing your environment, which is always helpful.
Read full review
Alternatives Considered
Rational BI
Rational BI allows a deeper data analysis with respect to the other software I experimented with. The velocity to perform the analysis is similar to the other one. The predictive analysis could be very useful, but at the moment I do not use it in my activities. Dashboards are nice and easy to understand.
Read full review
SAS
SAS Business Intelligence is not the cream of the crop for business intelligence applications, but it is not far behind. The software is generally easier to apply than most other business intelligence software. Additionally, SAS Business Intelligence runs smoothly in the background when making real-time updates. With that said, the software is not as efficient of many of the other business intelligence software applications that have been on the market for longer than this one.
Read full review
Return on Investment
Rational BI
  • Allows folks to work on other items as reporting is done in the background.
  • Scheduling and delivery of reports with one click.
  • Single pane of management.
  • Ease of use.
Read full review
SAS
  • SAS Visual Analytics licensing cost should be reduced to enable users to use it in mass scale.
  • More statistical and mathematical equations and theories should be converted into SAS functions for reusing.
  • Because of enriched ETL and reporting capabilities SAS Visual Analytics is most preferred by business users.
Read full review
ScreenShots

Rational BI Screenshots

Screenshot of Modern Business IntelligenceScreenshot of Drag-and-drop InsightsScreenshot of Accessible for everyone, power when you need itScreenshot of Beautiful analytics on every screen and deviceScreenshot of Scheduled reporting: Broadcast your findings to everyoneScreenshot of Connect all your data no matter where it lives

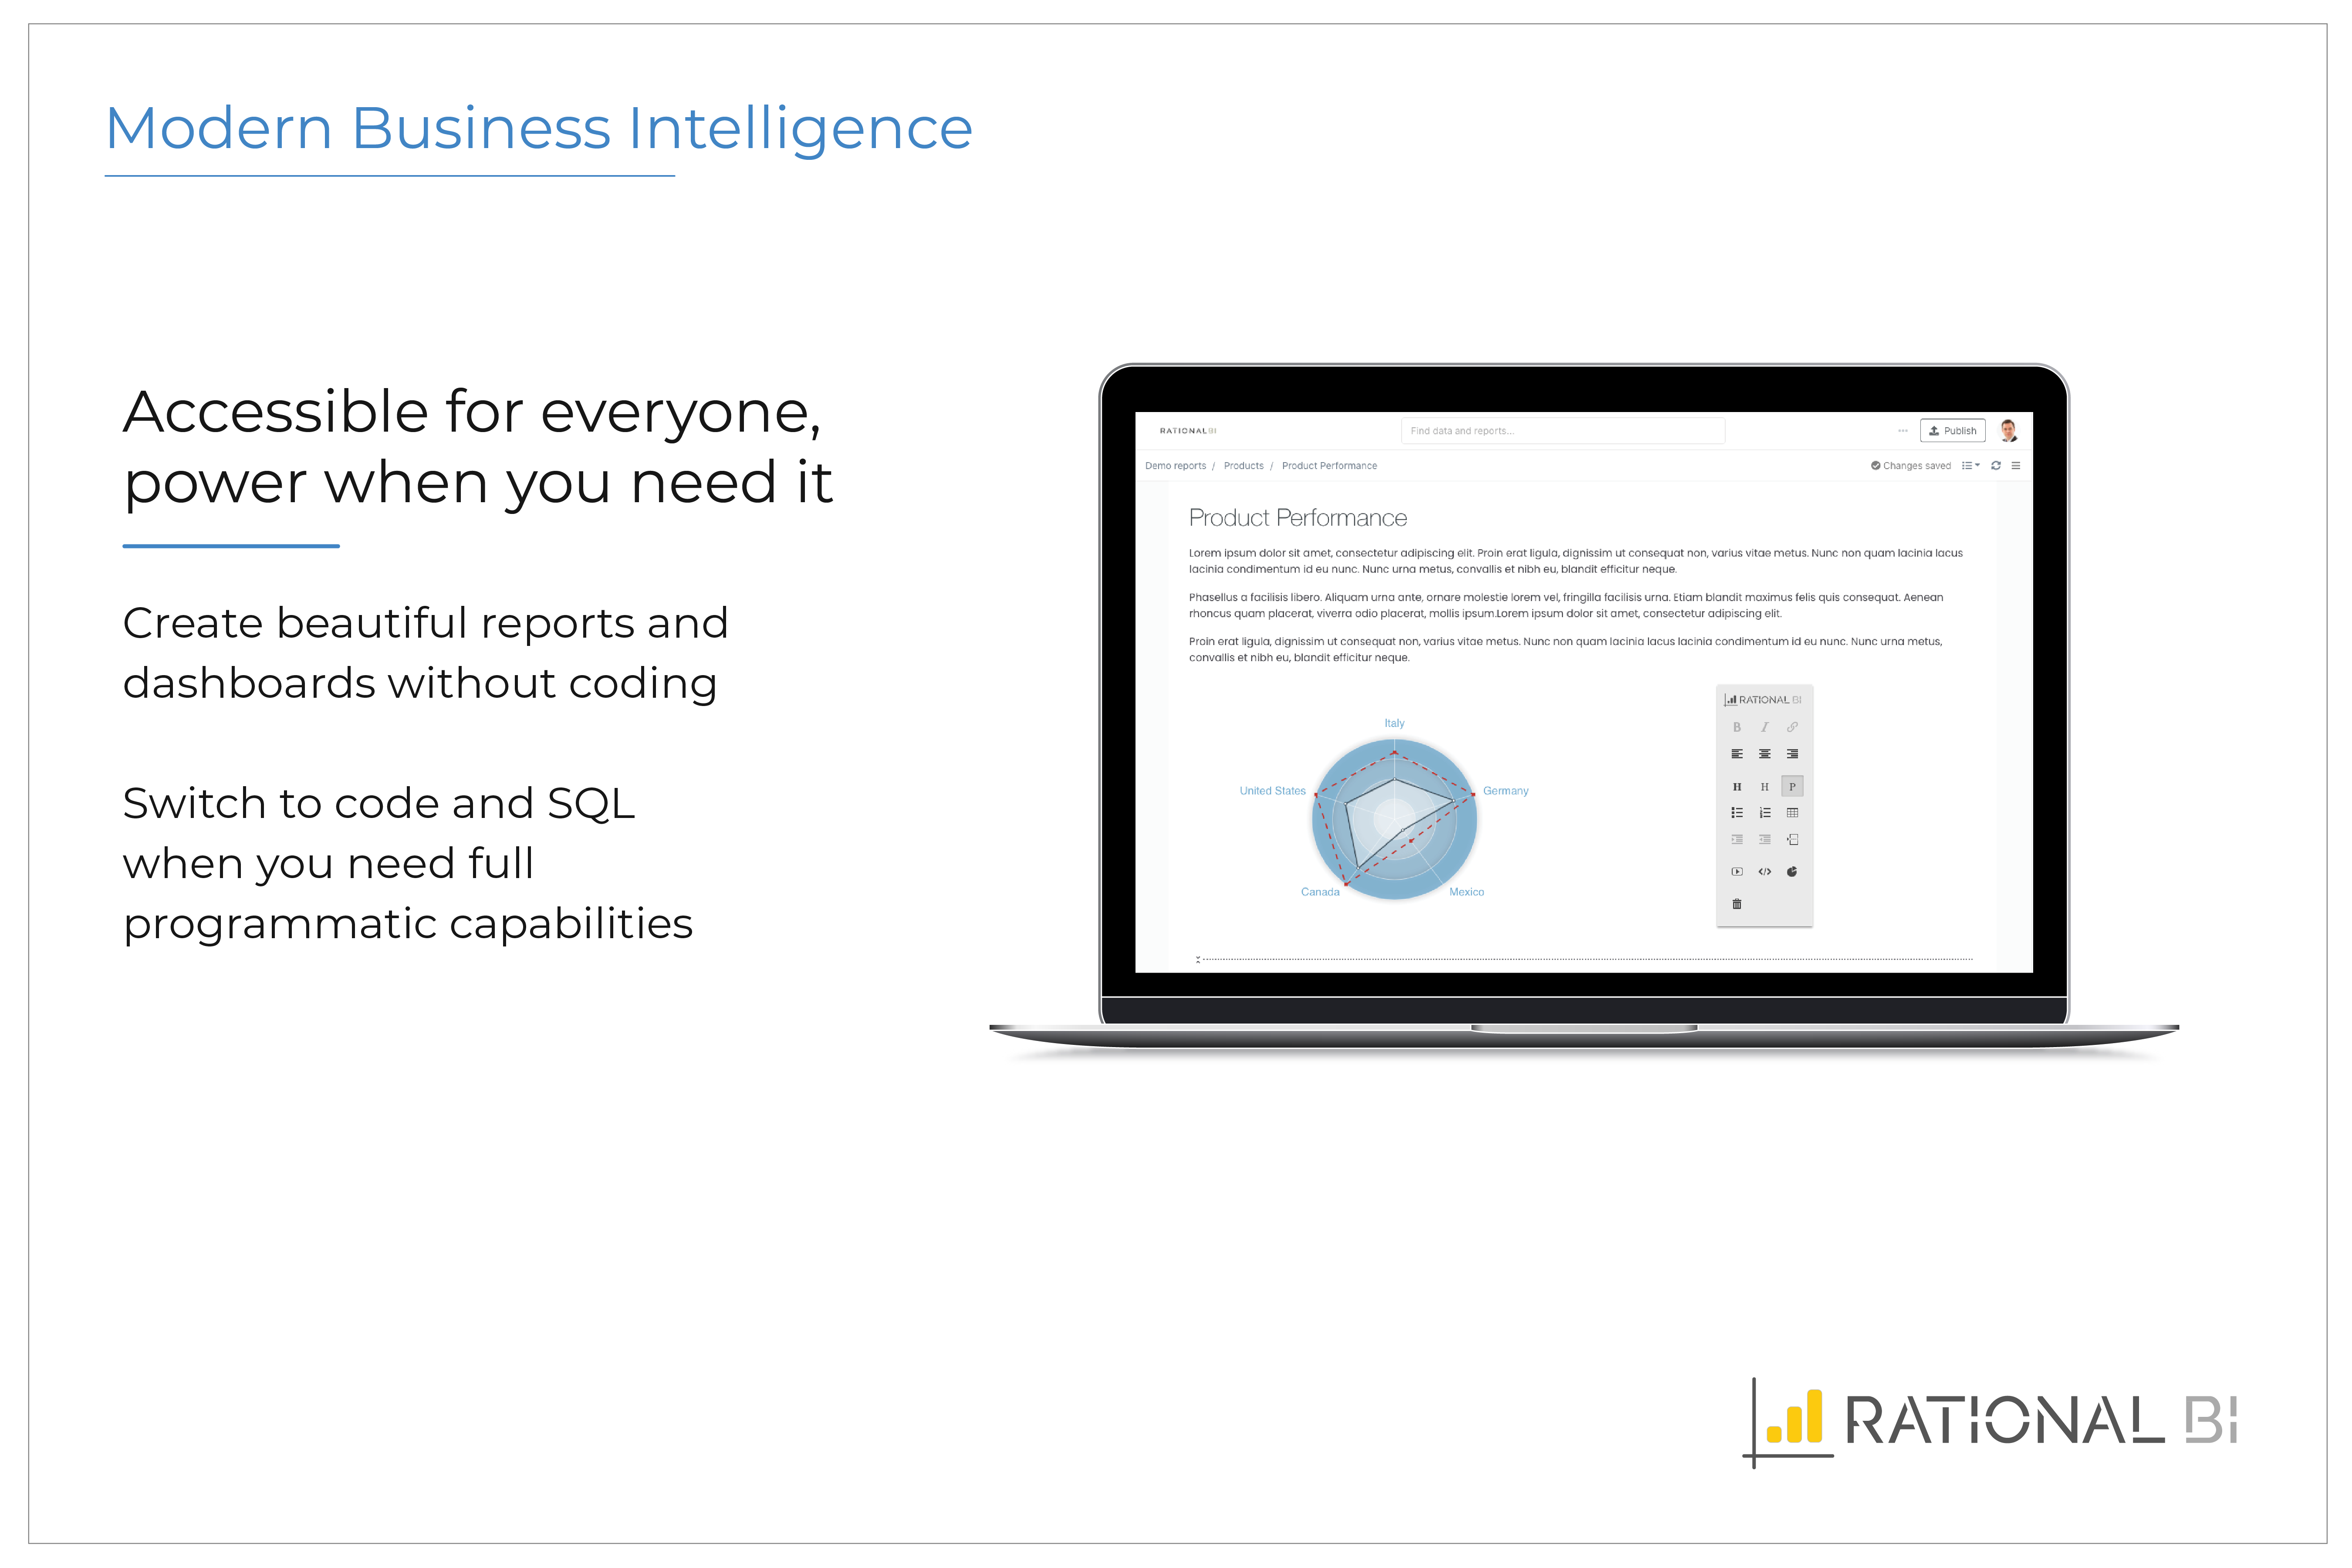
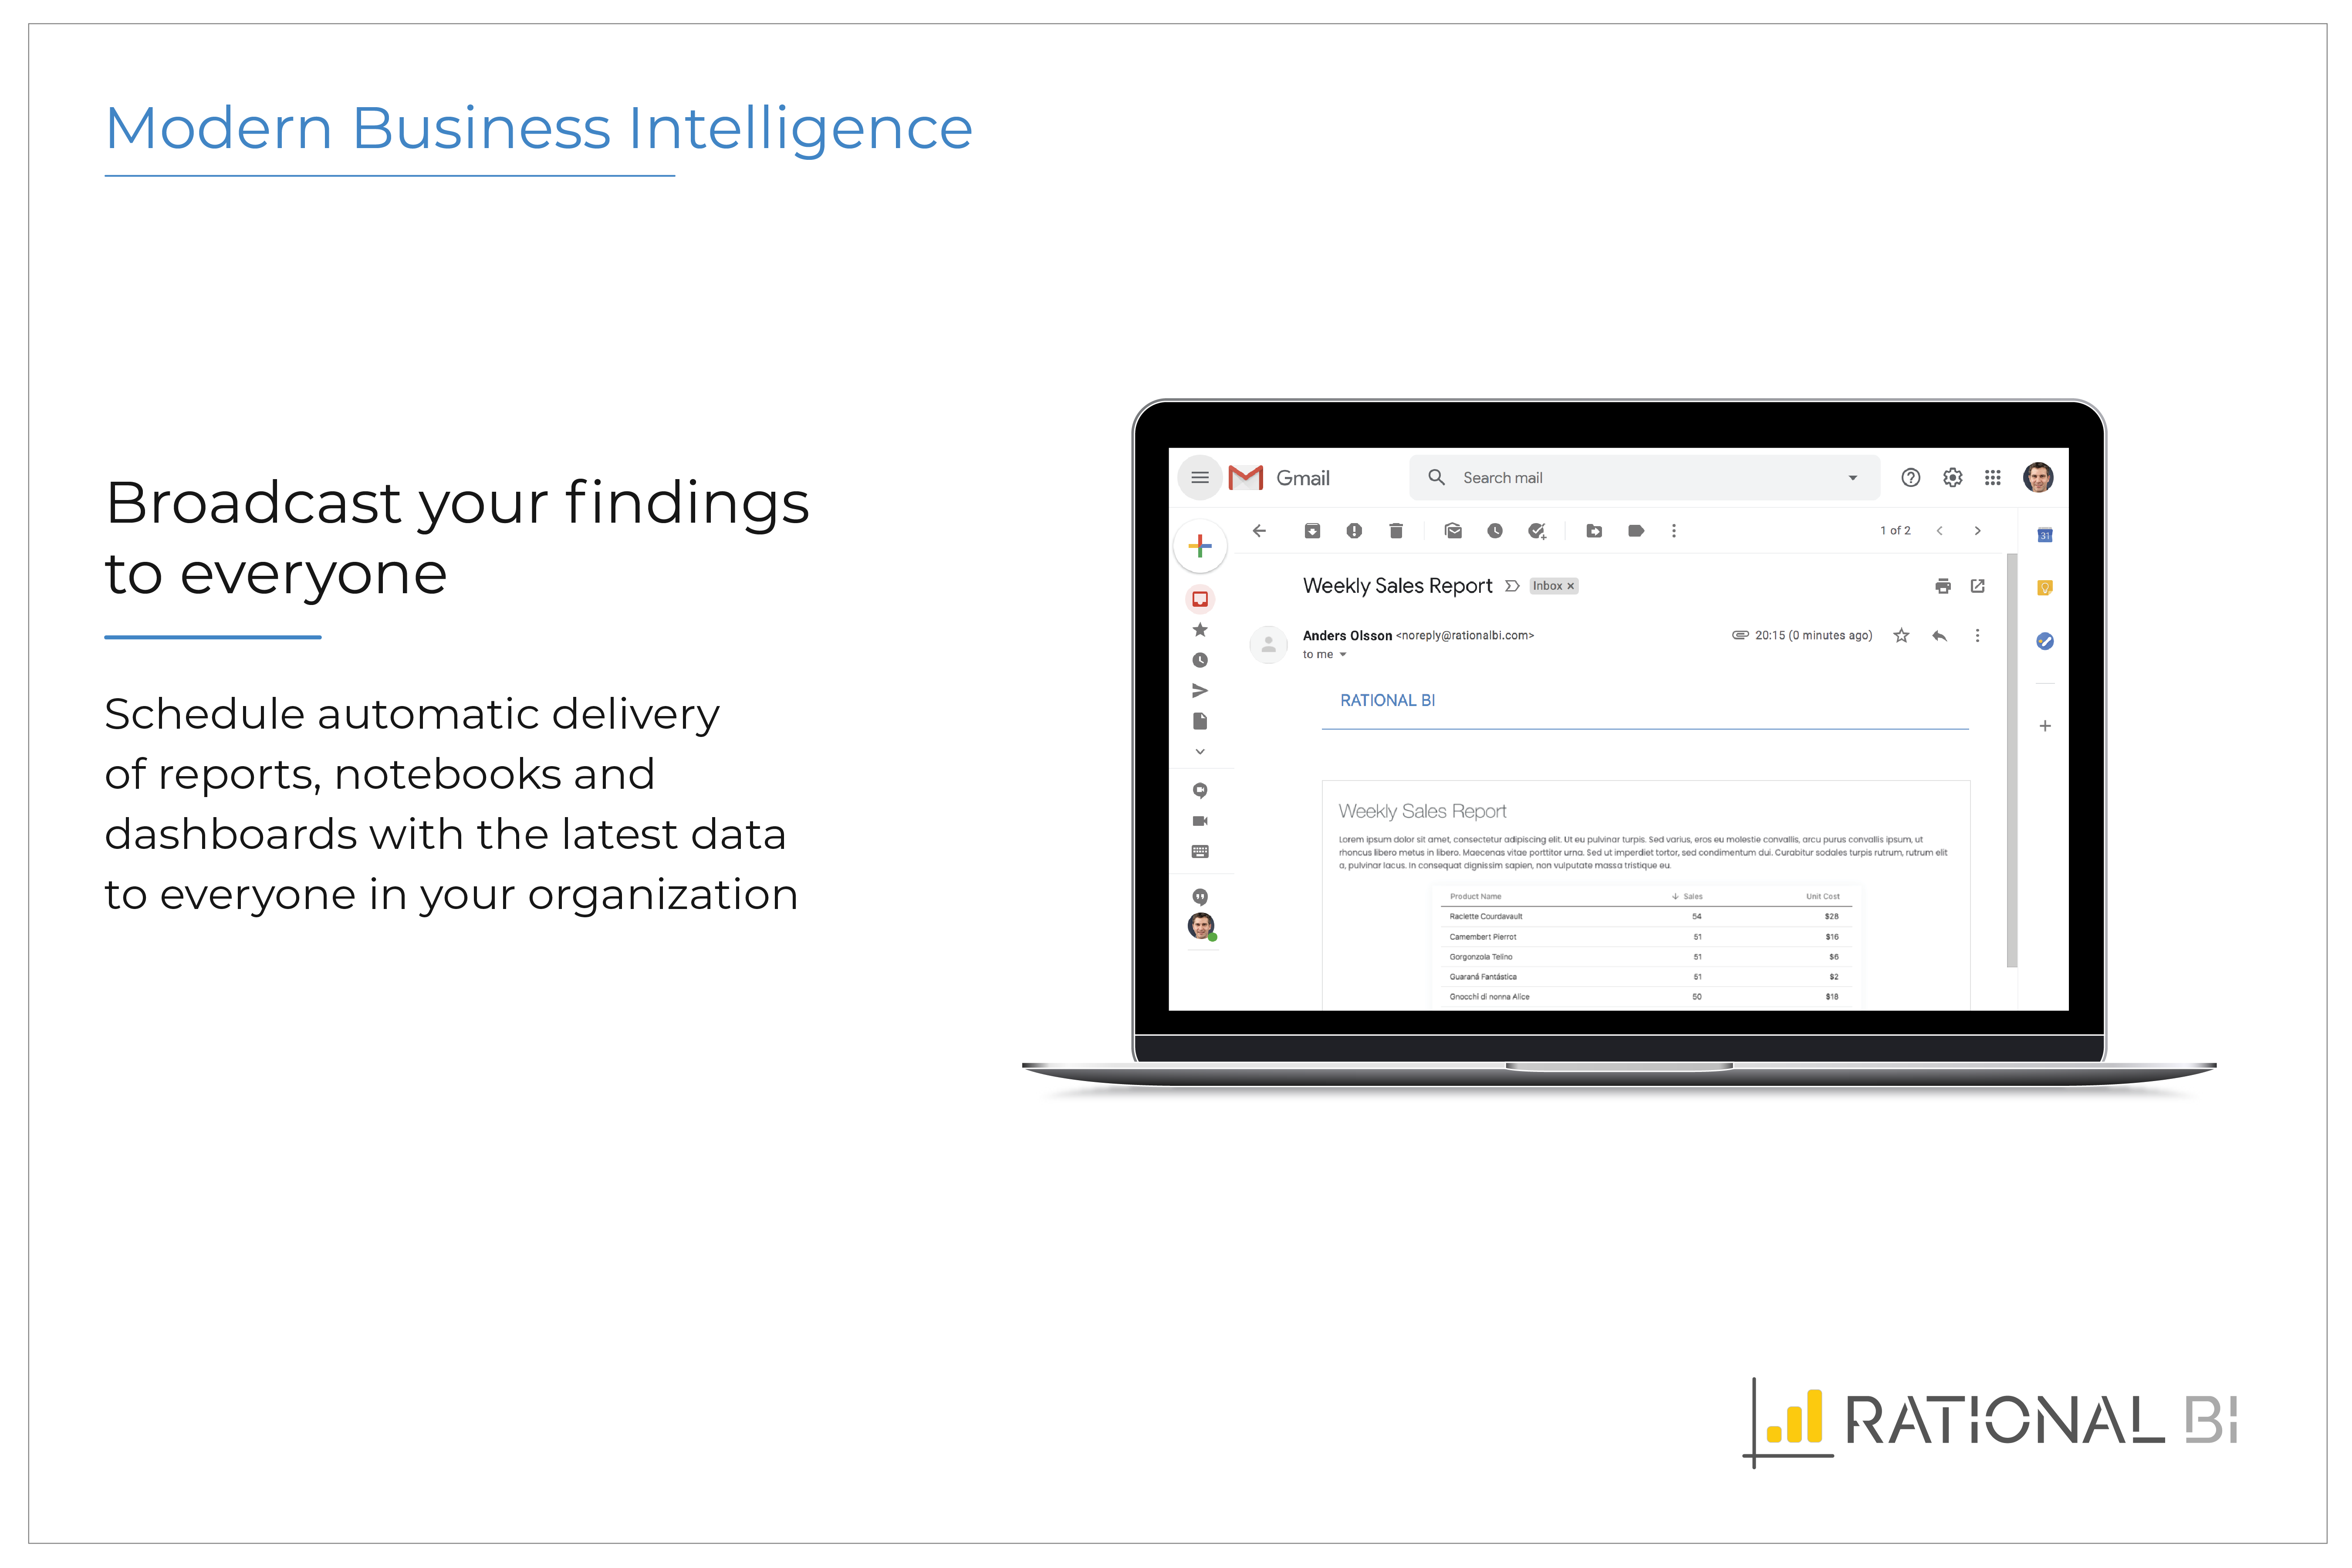
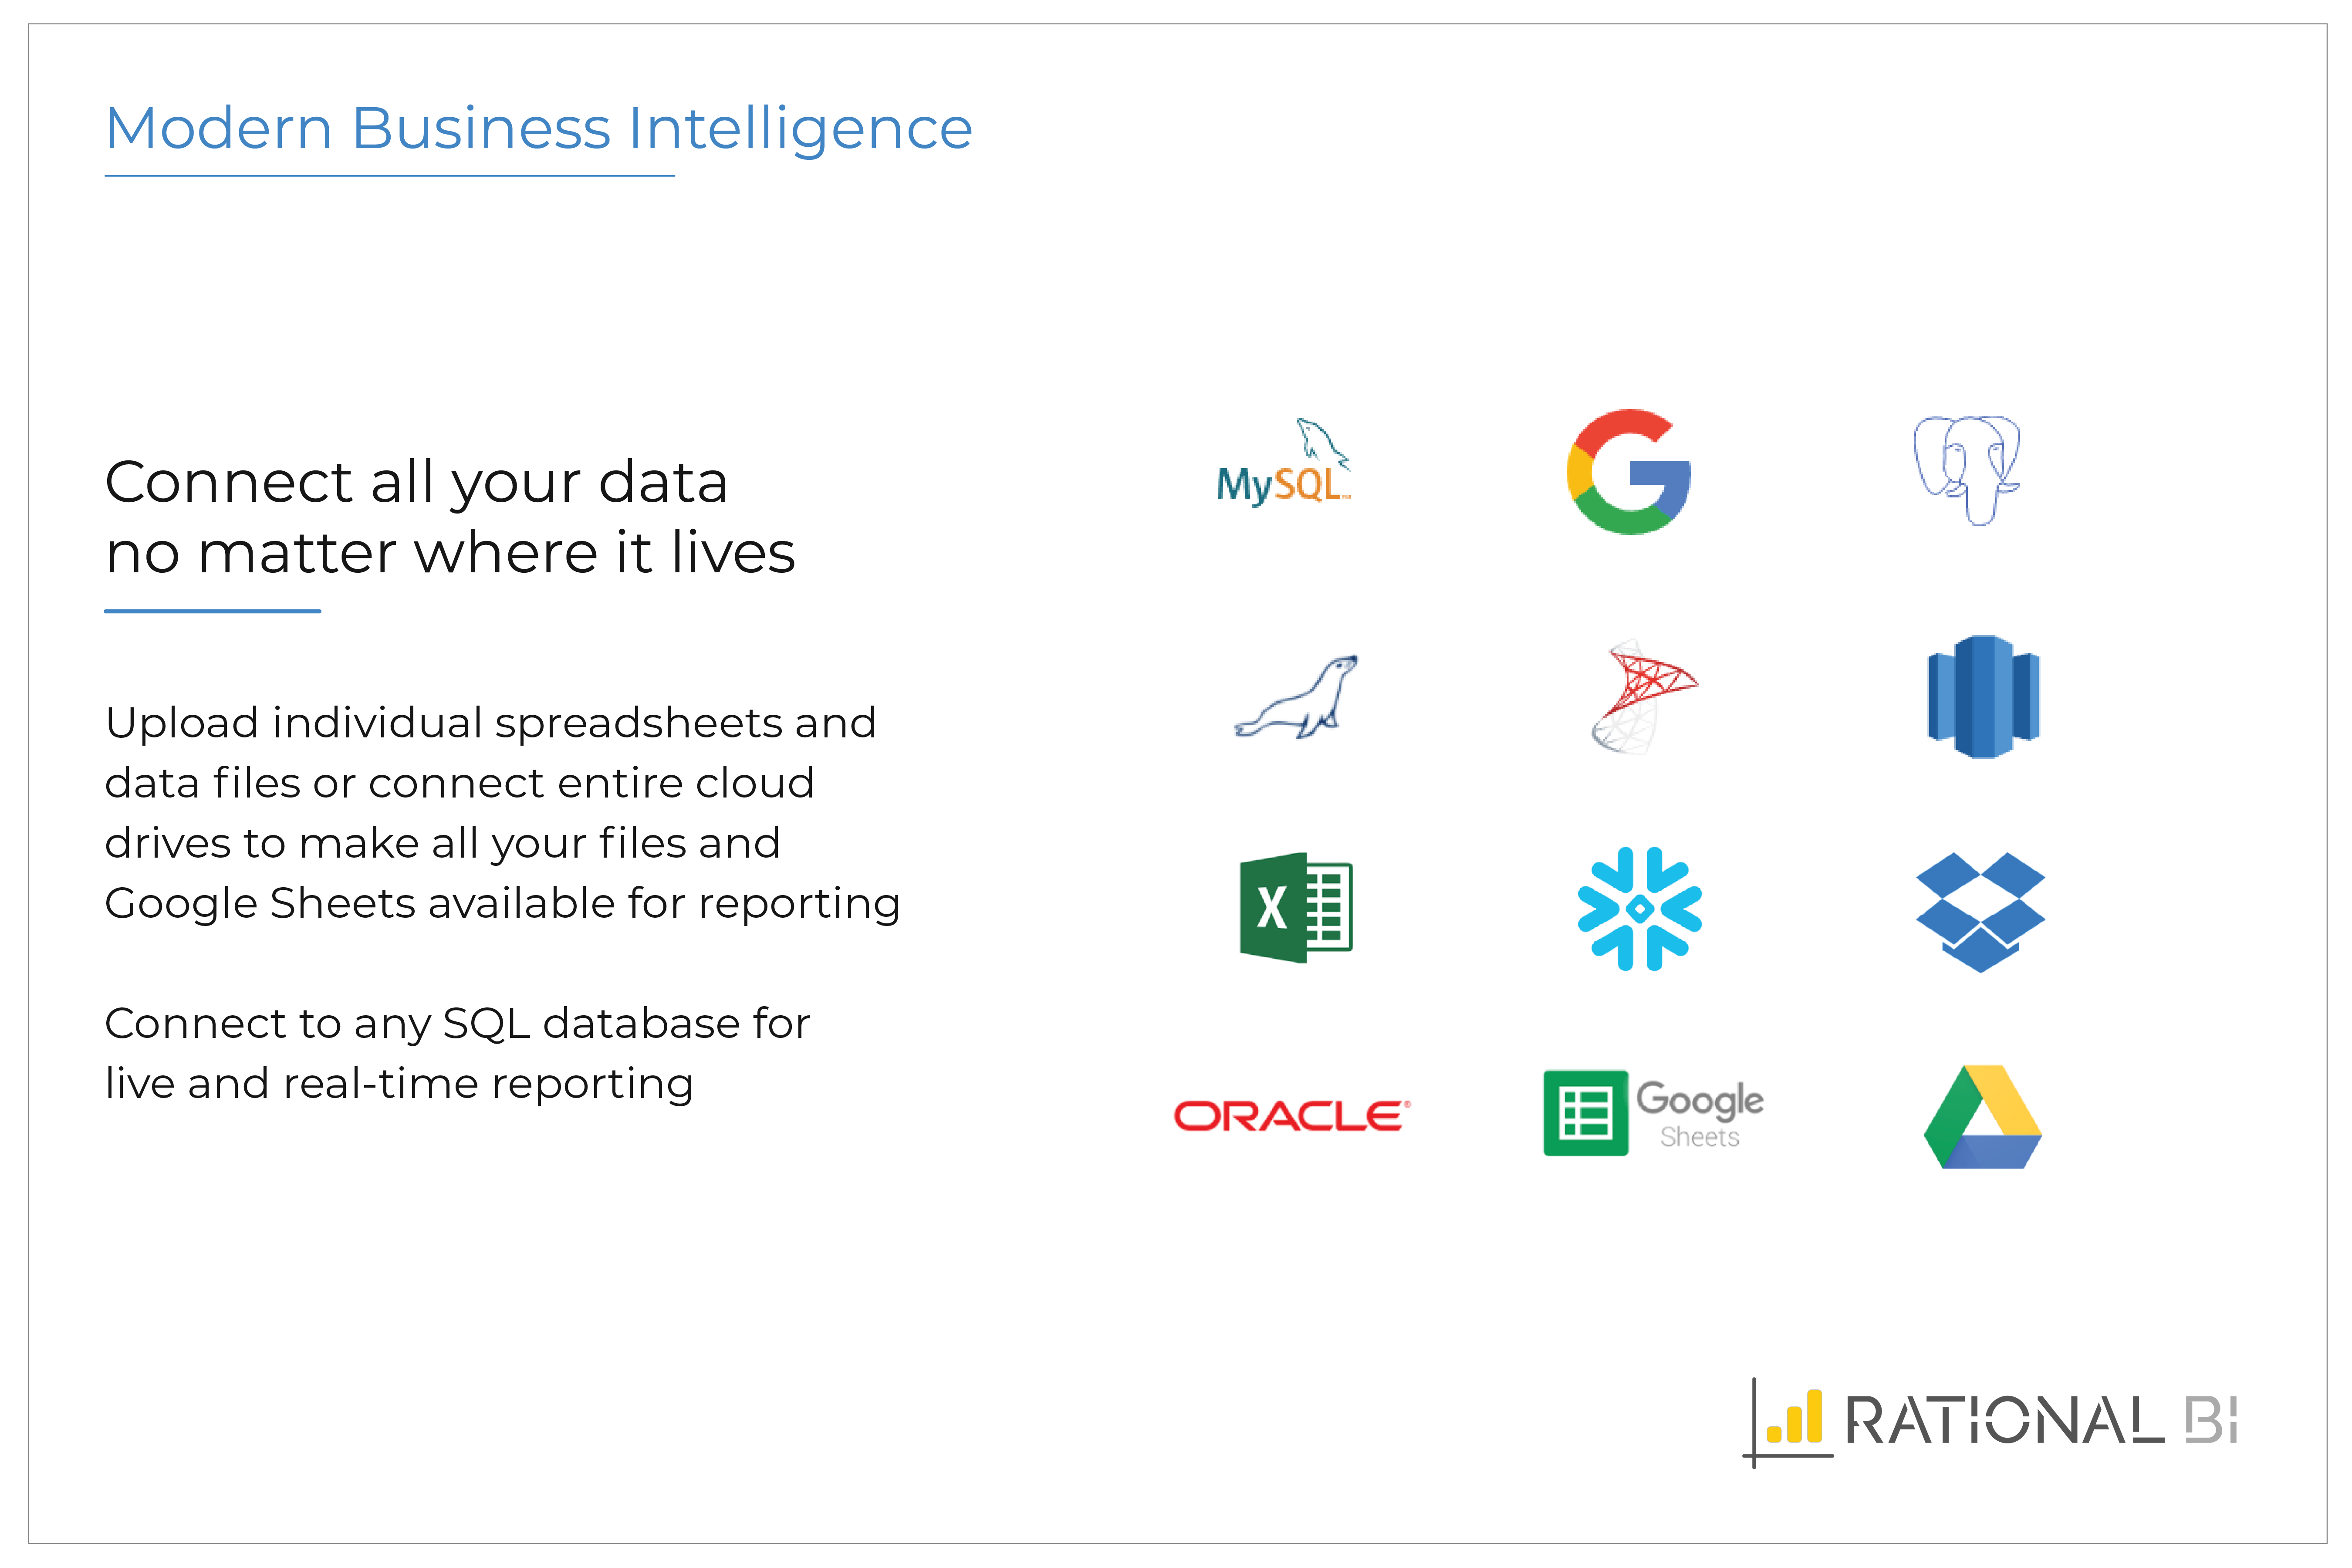
SAS Visual Analytics Screenshots

Screenshot of Explore your data using analytics and interactive data visualizations.