Foglight vs. Kemp Flowmon NPMD Solution
Foglight vs. Kemp Flowmon NPMD Solution
| Product | Rating | Most Used By | Product Summary | Starting Price |
|---|---|---|---|---|
 Foglight | N/A | Foglight is a database performance management suite from Quest, with modules to perform cloud analytics, network performance monitoring and virtualization management, scaling to a broad, cloud / virtualization focused IT infrastructure monitoring solution. | N/A | |
 Kemp Flowmon NPMD Solution | N/A | The Flowmon Solution provides IT operations with an understanding of networks and applications. Boasting performance, scalability and ease of use, Flowmon delivers monitoring, diagnostics and analytics for optimizing performance of infrastructure. With Network Behavior Analysis included, Flowmon aims to help eliminate suspicious activities, attacks and advanced threats that bypass traditional security solutions. | N/A |
| Foglight | Kemp Flowmon NPMD Solution | |||||||||||||||
|---|---|---|---|---|---|---|---|---|---|---|---|---|---|---|---|---|
| Editions & Modules | No answers on this topic | No answers on this topic | ||||||||||||||
| Offerings |
| |||||||||||||||
| Entry-level Setup Fee | No setup fee | No setup fee | ||||||||||||||
| Additional Details | — | Capacity-based licensing per amount of monitored traffic. | ||||||||||||||
| More Pricing Information | ||||||||||||||||
| Foglight | Kemp Flowmon NPMD Solution | |
|---|---|---|
| Top Pros | ||
| Top Cons |
|
|
| Foglight | Kemp Flowmon NPMD Solution | |
|---|---|---|
| Small Businesses | No answers on this topic |  NinjaOne Score 9.2 out of 10 |
| Medium-sized Companies |  Redgate SQL Monitor Score 8.2 out of 10 |  PingPlotter Score 9.4 out of 10 |
| Enterprises |  Redgate SQL Monitor Score 8.2 out of 10 |  Nmap Score 8.8 out of 10 |
| All Alternatives | View all alternatives | View all alternatives |
| Foglight | Kemp Flowmon NPMD Solution | |
|---|---|---|
| Likelihood to Recommend | 9.0 (5 ratings) | - (0 ratings) |
| Foglight | Kemp Flowmon NPMD Solution | |
|---|---|---|
| Likelihood to Recommend |  Quest Software
|  Kemp Technologies No answers on this topic |
| Pros |  Quest Software
|  Kemp Technologies No answers on this topic |
| Cons |  Quest Software
|  Kemp Technologies No answers on this topic |
| Alternatives Considered |  Quest Software |  Kemp Technologies No answers on this topic |
| Return on Investment |  Quest Software
|  Kemp Technologies No answers on this topic |
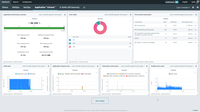
| ScreenShots | Kemp Flowmon NPMD Solution Screenshots |


