Grist vs. Sigma Computing
Grist vs. Sigma Computing
| Product | Rating | Most Used By | Product Summary | Starting Price |
|---|---|---|---|---|
 Grist | N/A | Grist combines the capabilities of spreadsheets, databases and app builders. Using a familiar spreadsheet interface, information can be organized as a relational database, and dashboards built using drag-and-drop. Solving spreadsheet problems Ensures data is well-structured and stored in one place with no duplication, no spreadsheet-wrangling, no merging documents. Collaboration on sensitive data Data is protected… | $8 per month per user | |
 Sigma | N/A | Sigma Computing headquartered in San Francisco provides a suite of data services such as code free data modeling, data search and explorating, and related BI and data visualization services. | N/A |
| Grist | Sigma Computing | |||||||||||||||
|---|---|---|---|---|---|---|---|---|---|---|---|---|---|---|---|---|
| Editions & Modules |
| No answers on this topic | ||||||||||||||
| Offerings |
| |||||||||||||||
| Entry-level Setup Fee | No setup fee | Optional | ||||||||||||||
| Additional Details | — | Contact us for pricing. | ||||||||||||||
| More Pricing Information | ||||||||||||||||
| Grist | Sigma Computing | |
|---|---|---|
| Top Pros | ||
| Top Cons |
|
|
| Grist | Sigma Computing | ||||||||||||||||||
|---|---|---|---|---|---|---|---|---|---|---|---|---|---|---|---|---|---|---|---|
| BI Standard Reporting |
| ||||||||||||||||||
| Ad-hoc Reporting |
| ||||||||||||||||||
| Report Output and Scheduling |
| ||||||||||||||||||
| Data Discovery and Visualization |
|
| Grist | Sigma Computing | |
|---|---|---|
| Small Businesses |  Microsoft Excel Score 8.9 out of 10 |  BrightGauge Score 8.9 out of 10 |
| Medium-sized Companies | Microsoft Excel Score 8.9 out of 10 |  Reveal Score 9.9 out of 10 |
| Enterprises | Microsoft Excel Score 8.9 out of 10 |  Jaspersoft Community Edition Score 9.7 out of 10 |
| All Alternatives | View all alternatives | View all alternatives |
| Grist | Sigma Computing | |
|---|---|---|
| Likelihood to Recommend | 9.9 (2 ratings) | 8.8 (164 ratings) |
| Likelihood to Renew | - (0 ratings) | 8.0 (5 ratings) |
| Usability | - (0 ratings) | 7.3 (48 ratings) |
| Availability | - (0 ratings) | 8.2 (2 ratings) |
| Performance | - (0 ratings) | 9.1 (2 ratings) |
| Support Rating | - (0 ratings) | 8.9 (45 ratings) |
| Implementation Rating | - (0 ratings) | 9.1 (2 ratings) |
| Configurability | - (0 ratings) | 7.3 (1 ratings) |
| Ease of integration | - (0 ratings) | 9.1 (1 ratings) |
| Product Scalability | - (0 ratings) | 8.2 (2 ratings) |
| Vendor post-sale | - (0 ratings) | 7.3 (1 ratings) |
| Grist | Sigma Computing | |
|---|---|---|
| Likelihood to Recommend | Grist Labs
| Sigma Computing
|
| Pros | Grist Labs
| Sigma Computing
|
| Cons | Grist Labs
| Sigma Computing
|
| Likelihood to Renew | Grist Labs No answers on this topic | Sigma Computing
|
| Usability | Grist Labs No answers on this topic | Sigma Computing
|
| Reliability and Availability | Grist Labs No answers on this topic | Sigma Computing
 Siddique Chaudhry, CCSK Program Manager, Information Security |
| Performance | Grist Labs No answers on this topic | Sigma Computing
Siddique Chaudhry, CCSK Program Manager, Information Security |
| Support Rating | Grist Labs No answers on this topic | Sigma Computing
|
| Implementation Rating | Grist Labs No answers on this topic | Sigma Computing
|
| Alternatives Considered | Grist Labs
| Sigma Computing
 Tyler Lawson Director of Analytics |
| Scalability | Grist Labs No answers on this topic | Sigma Computing
Siddique Chaudhry, CCSK Program Manager, Information Security |
| Return on Investment | Grist Labs
| Sigma Computing
|
| ScreenShots | Grist Screenshots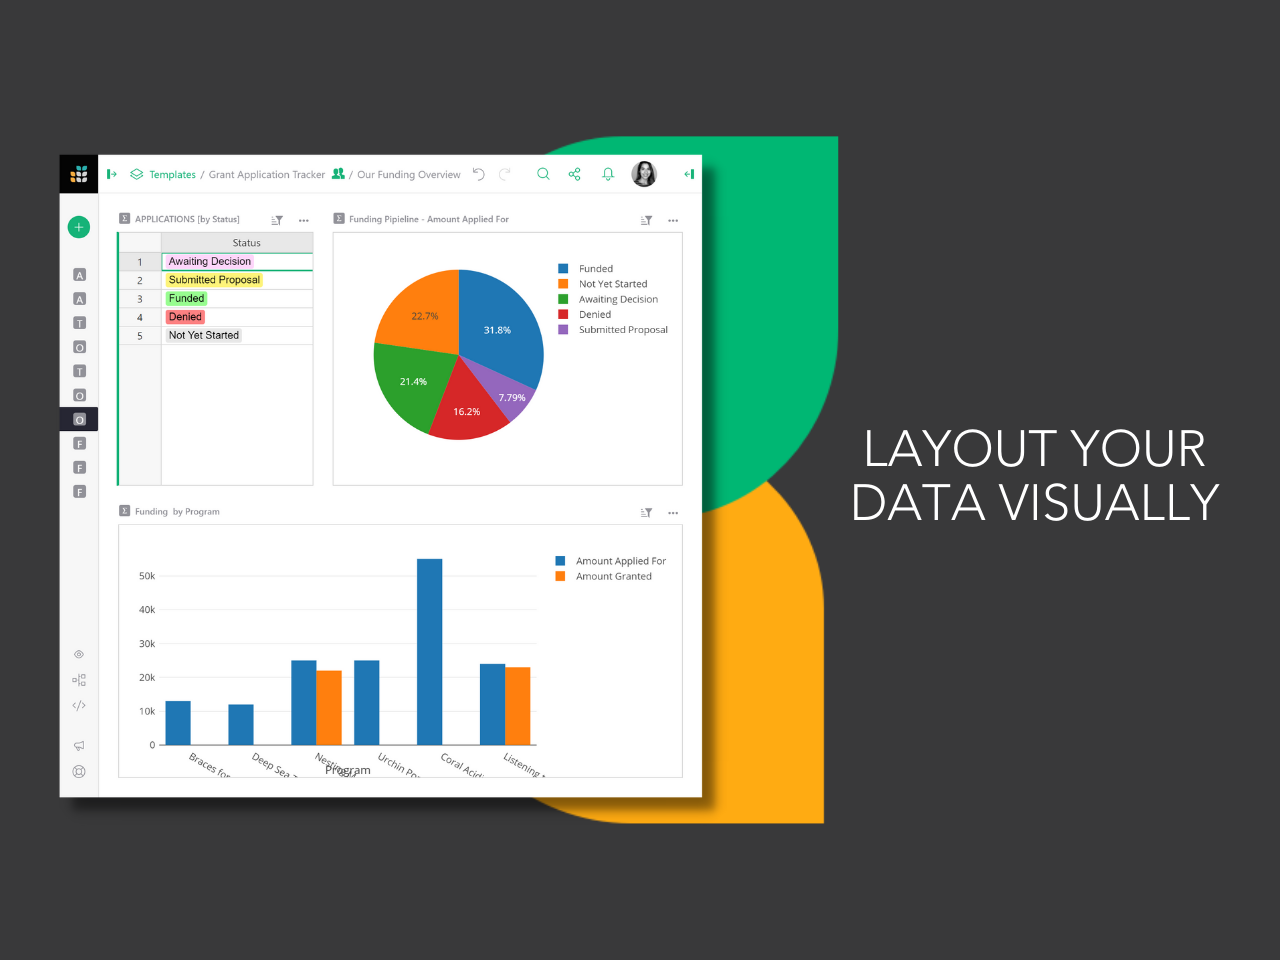  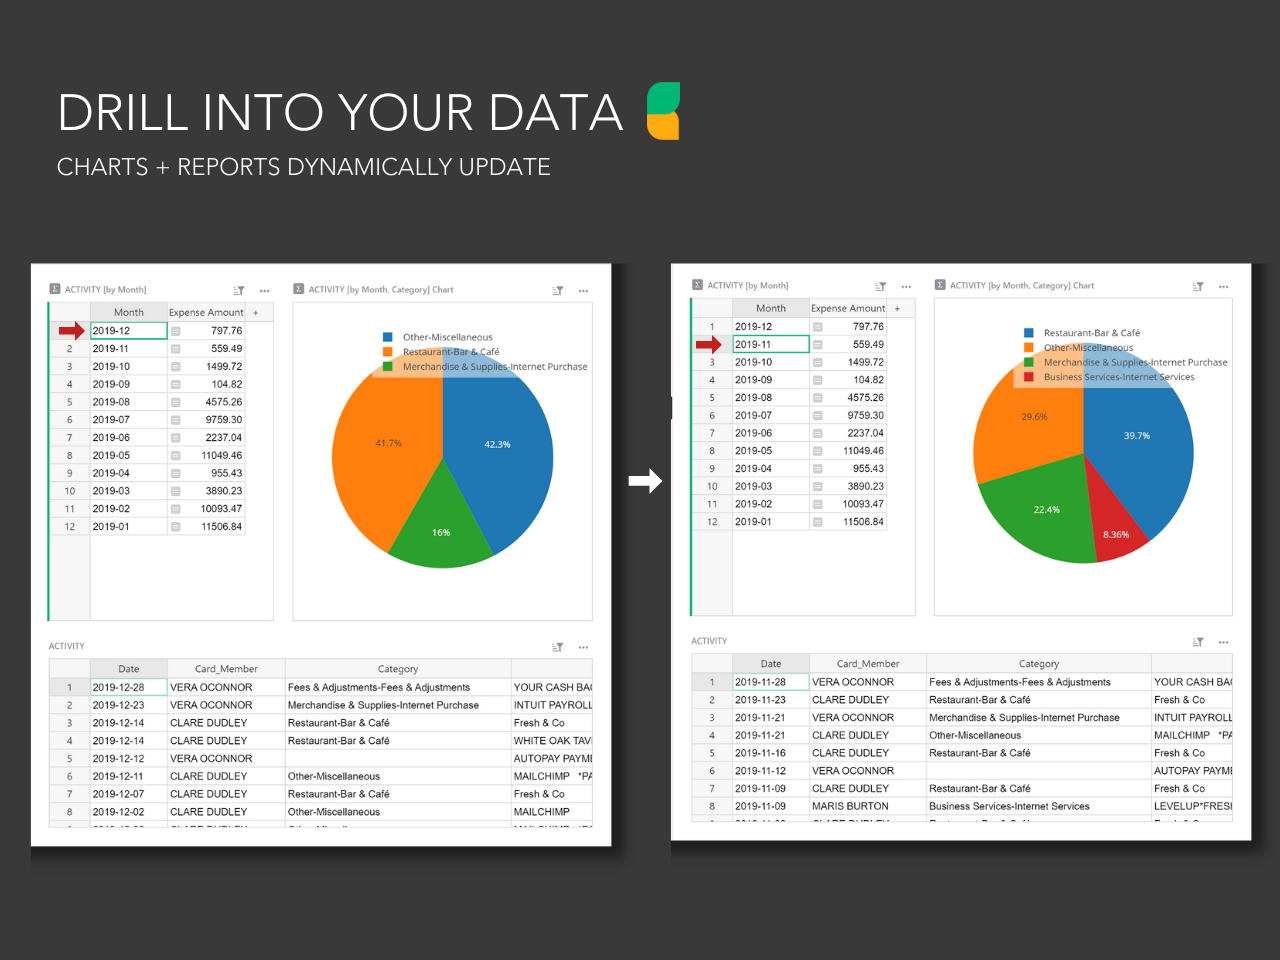  | Sigma Screenshots  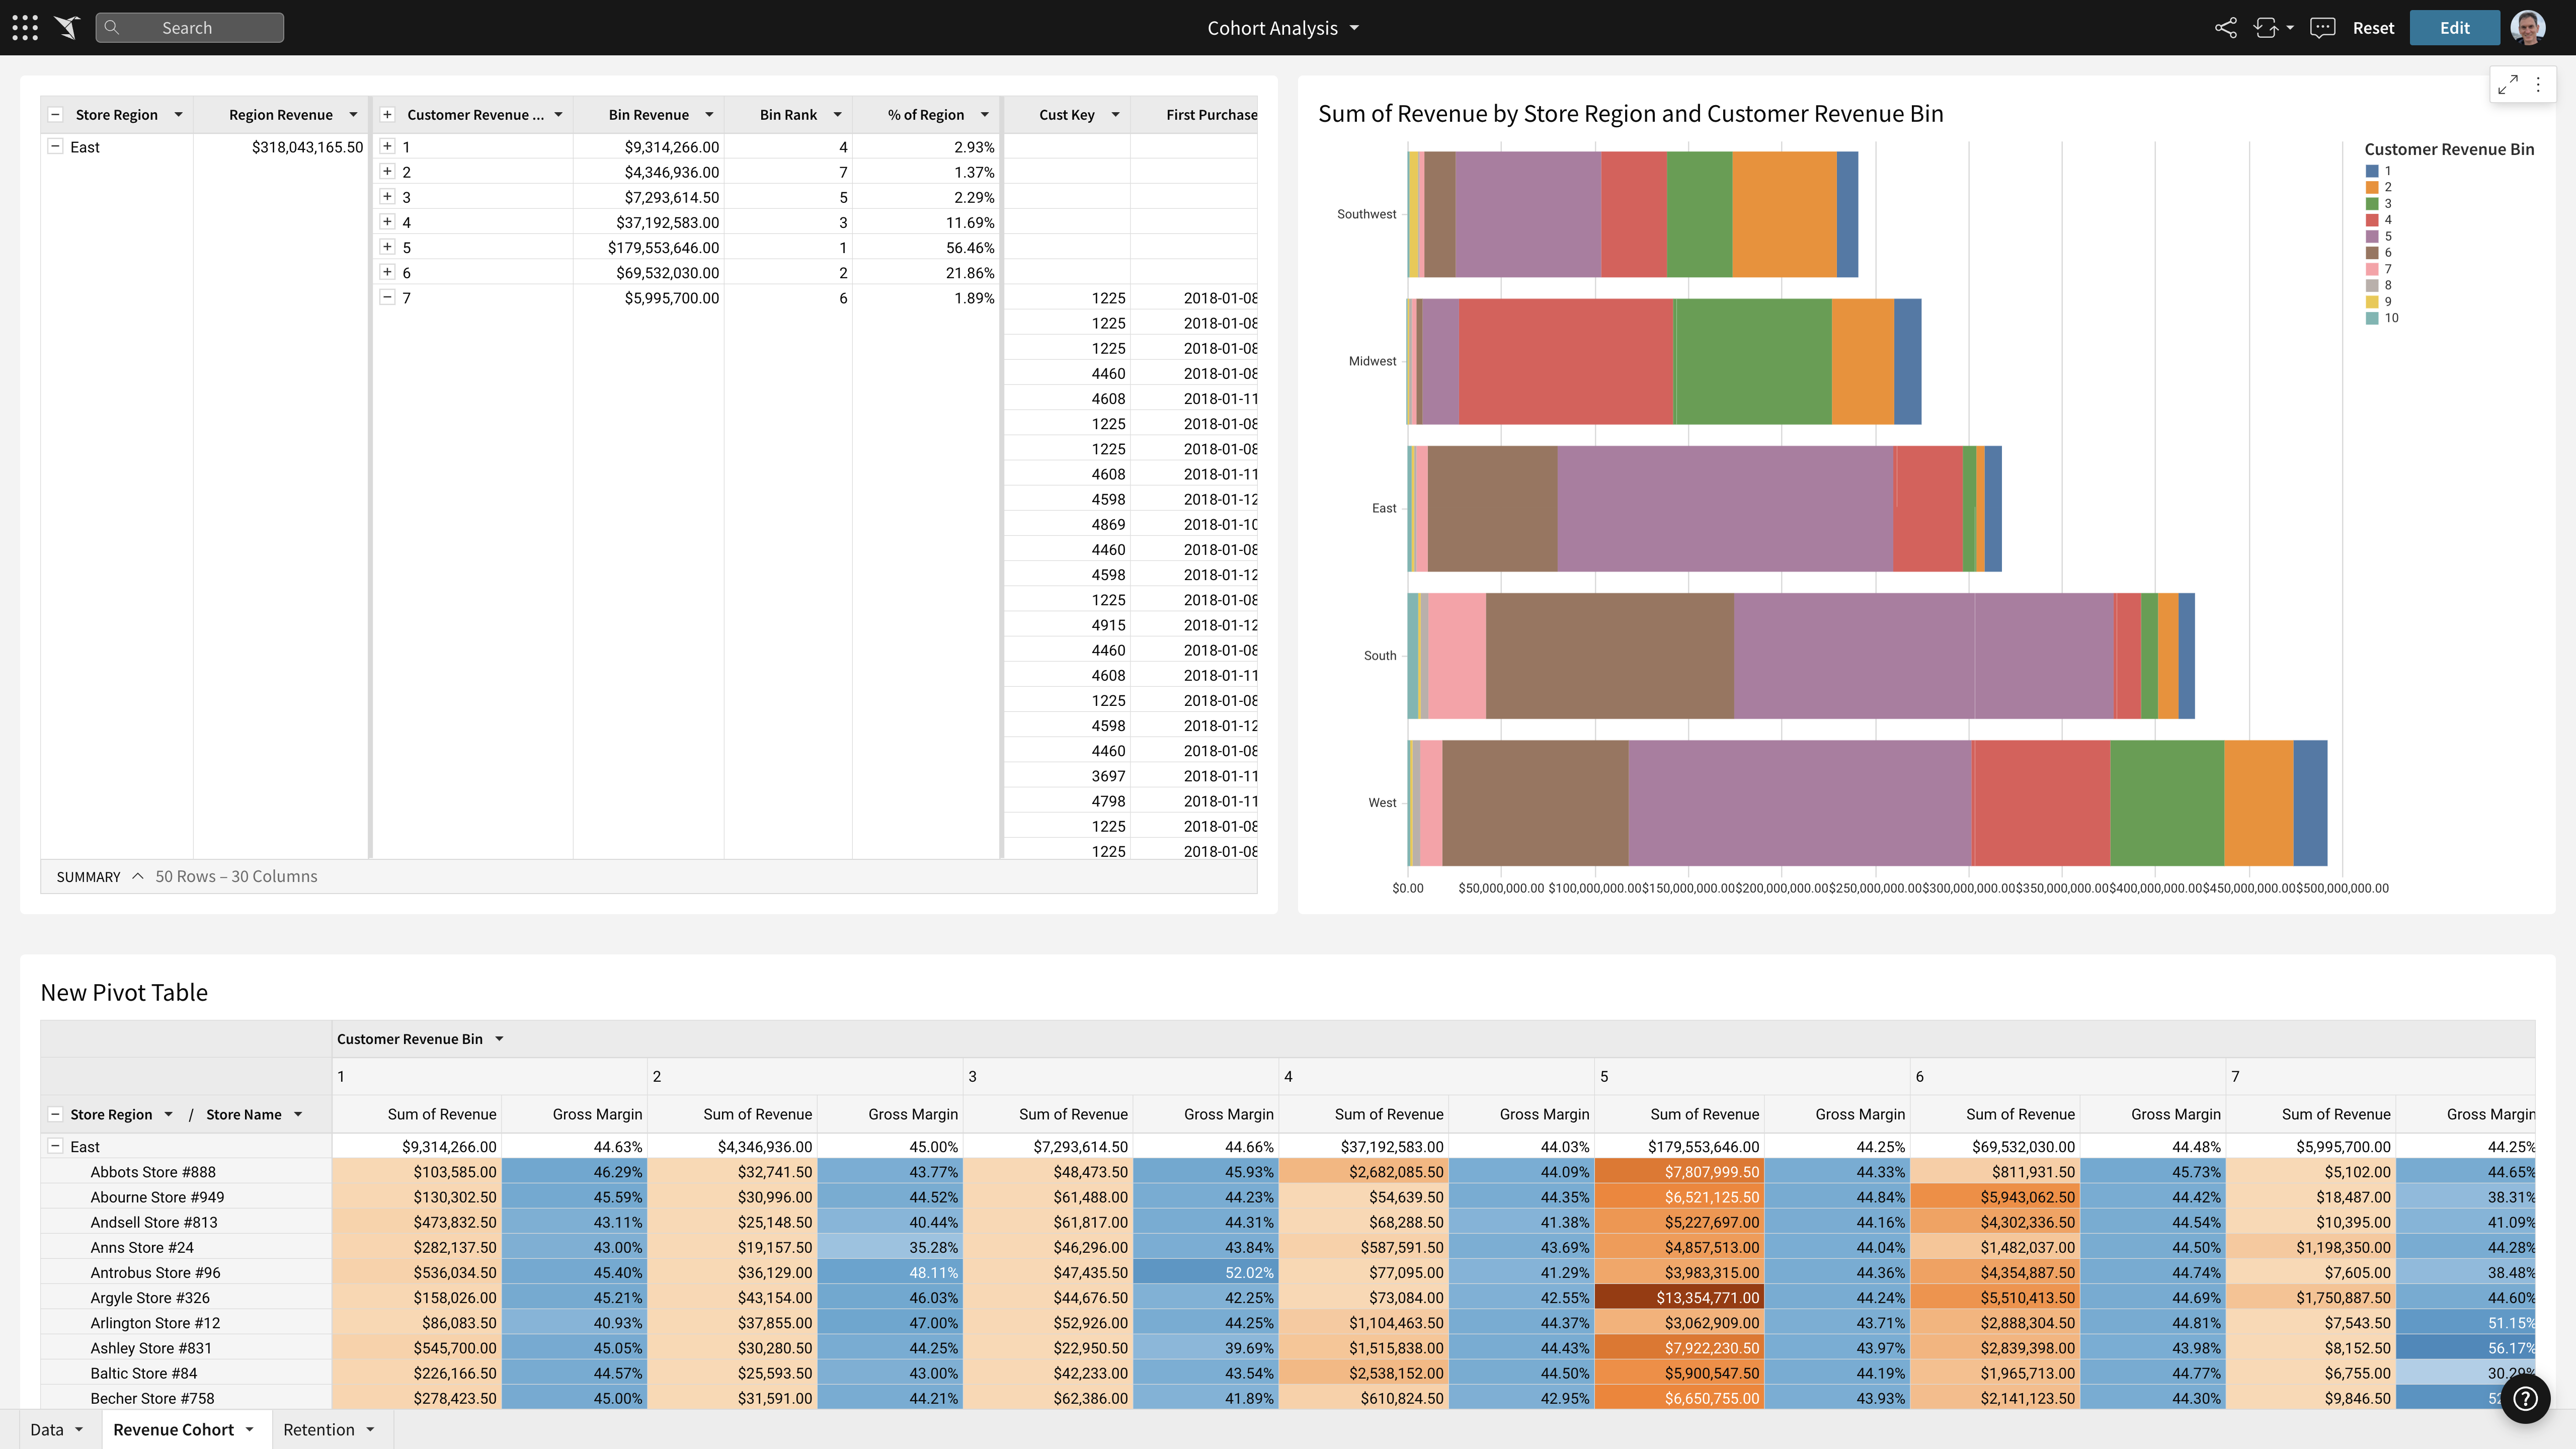 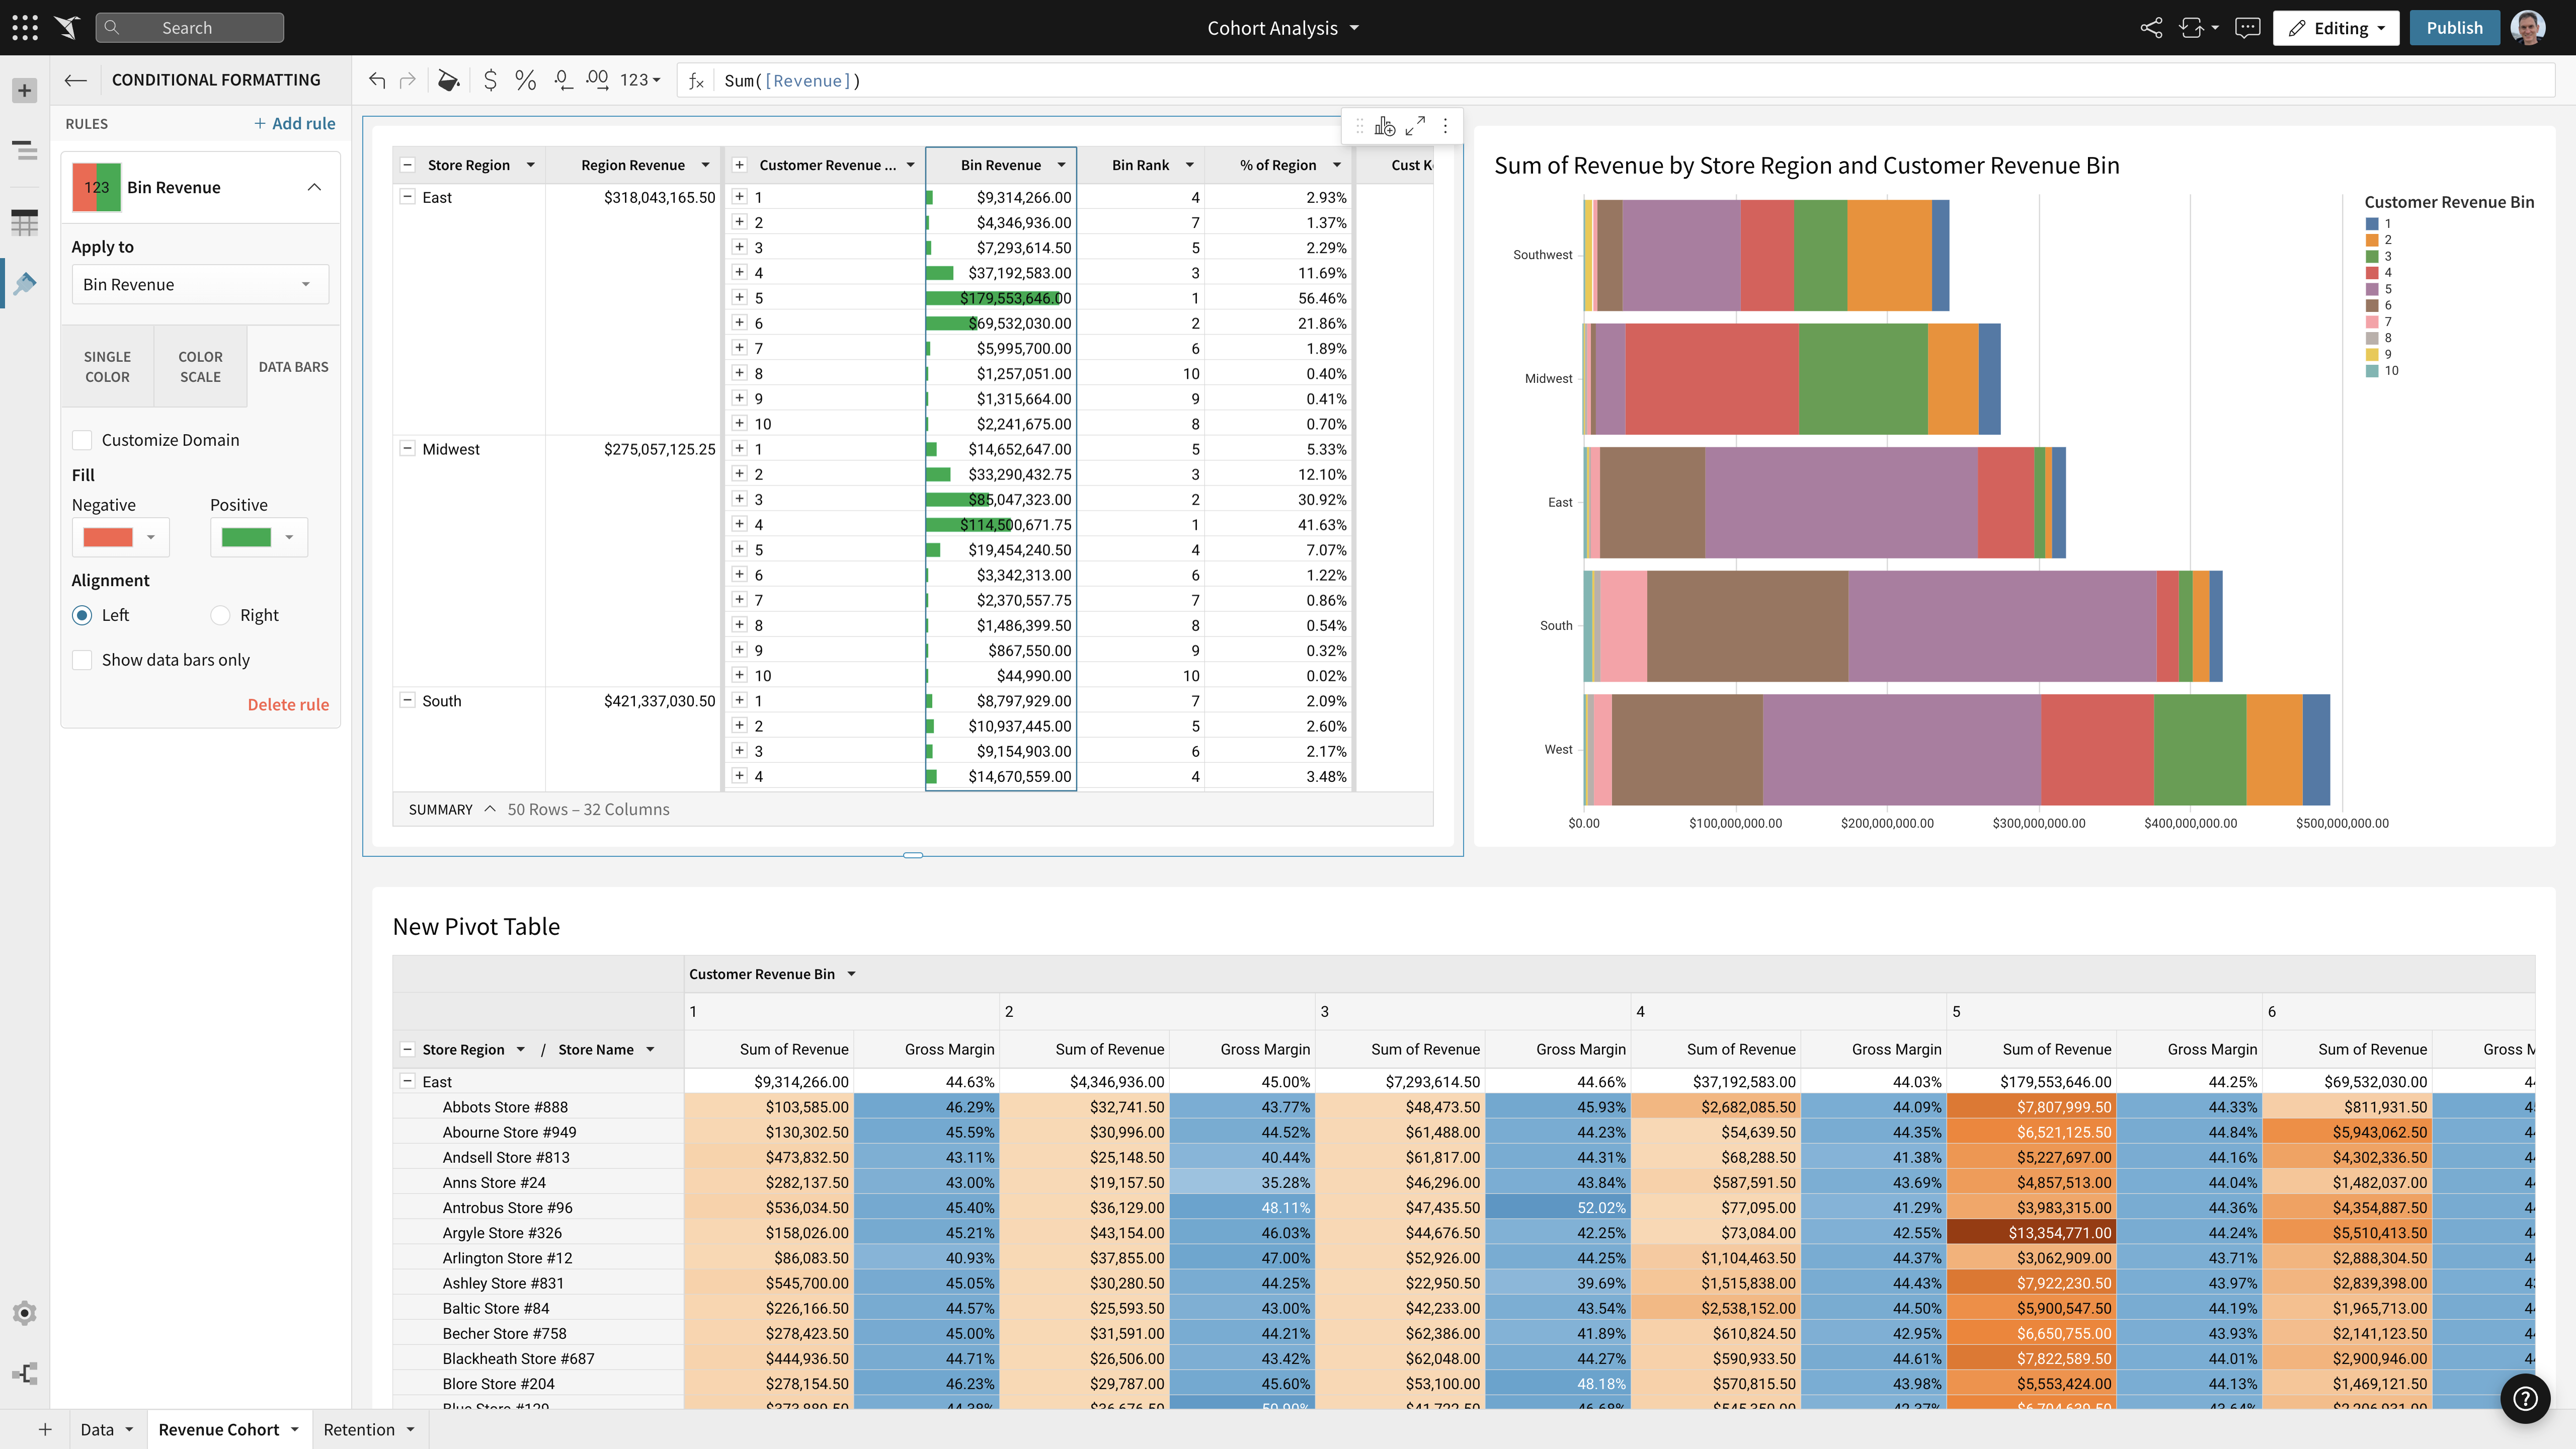   |