Noetix is a business intelligence software offering from Noetix.
N/A
Sigma
Score 9.1 out of 10
N/A
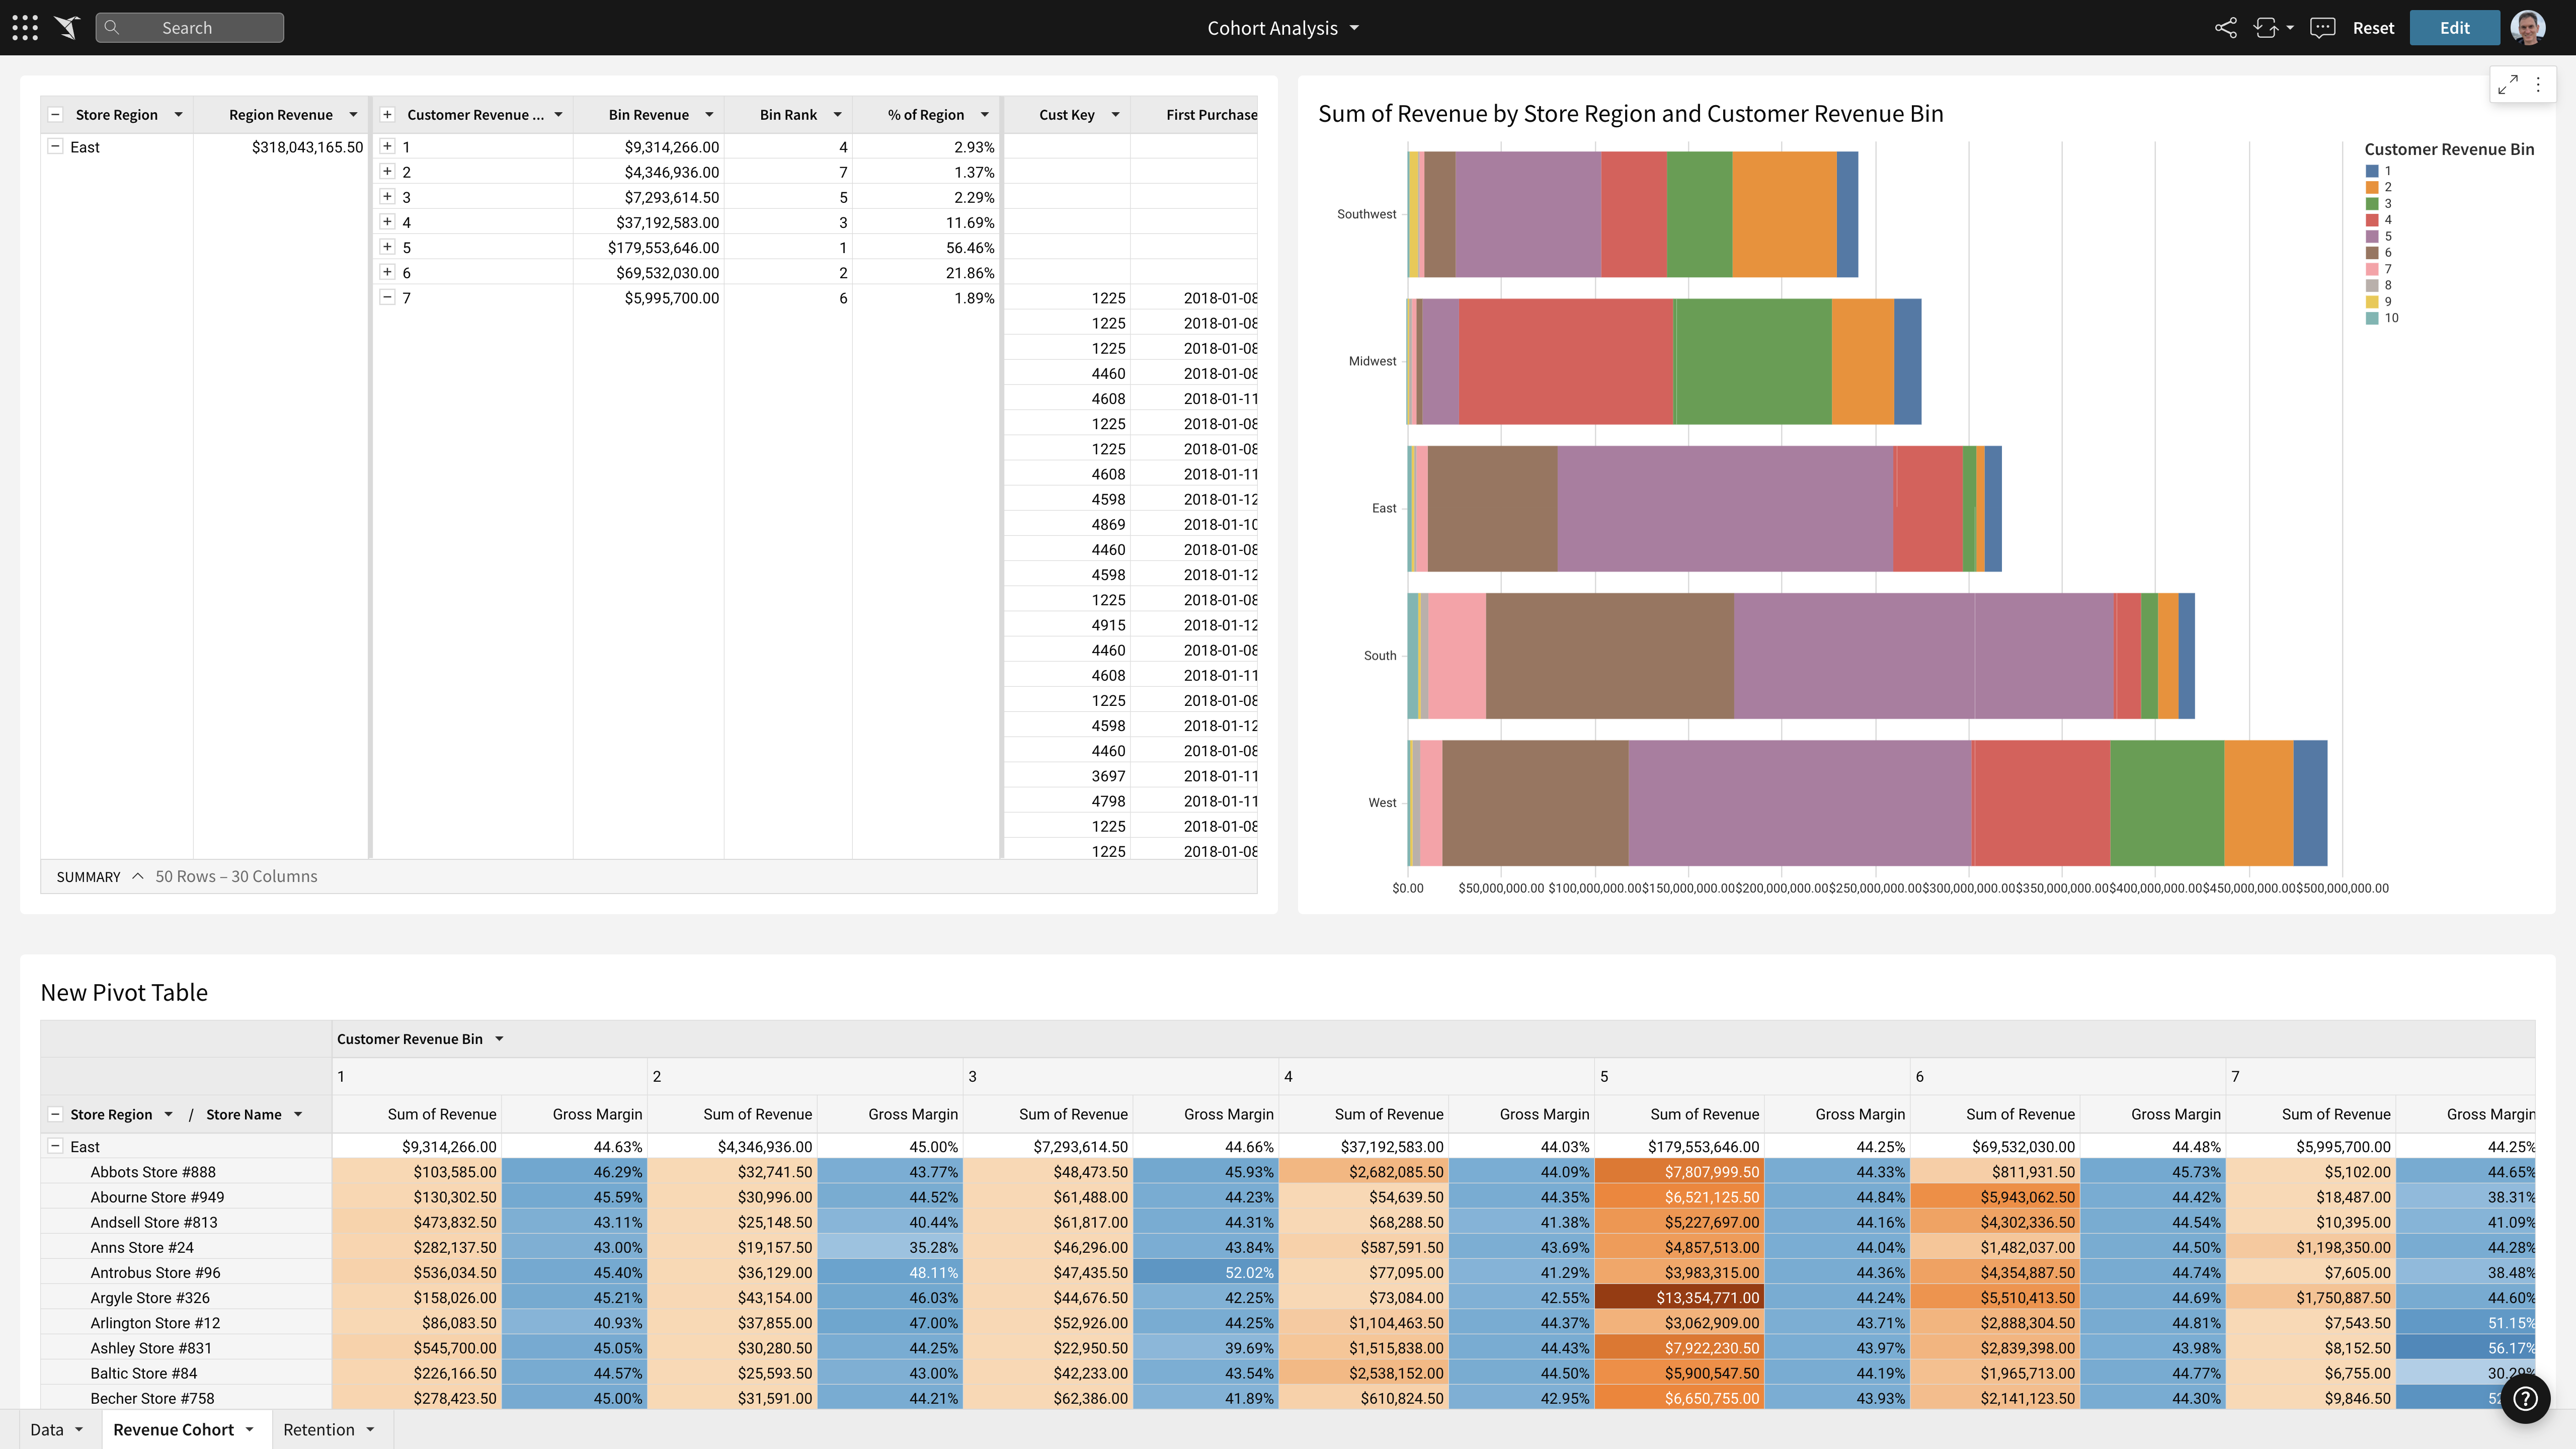
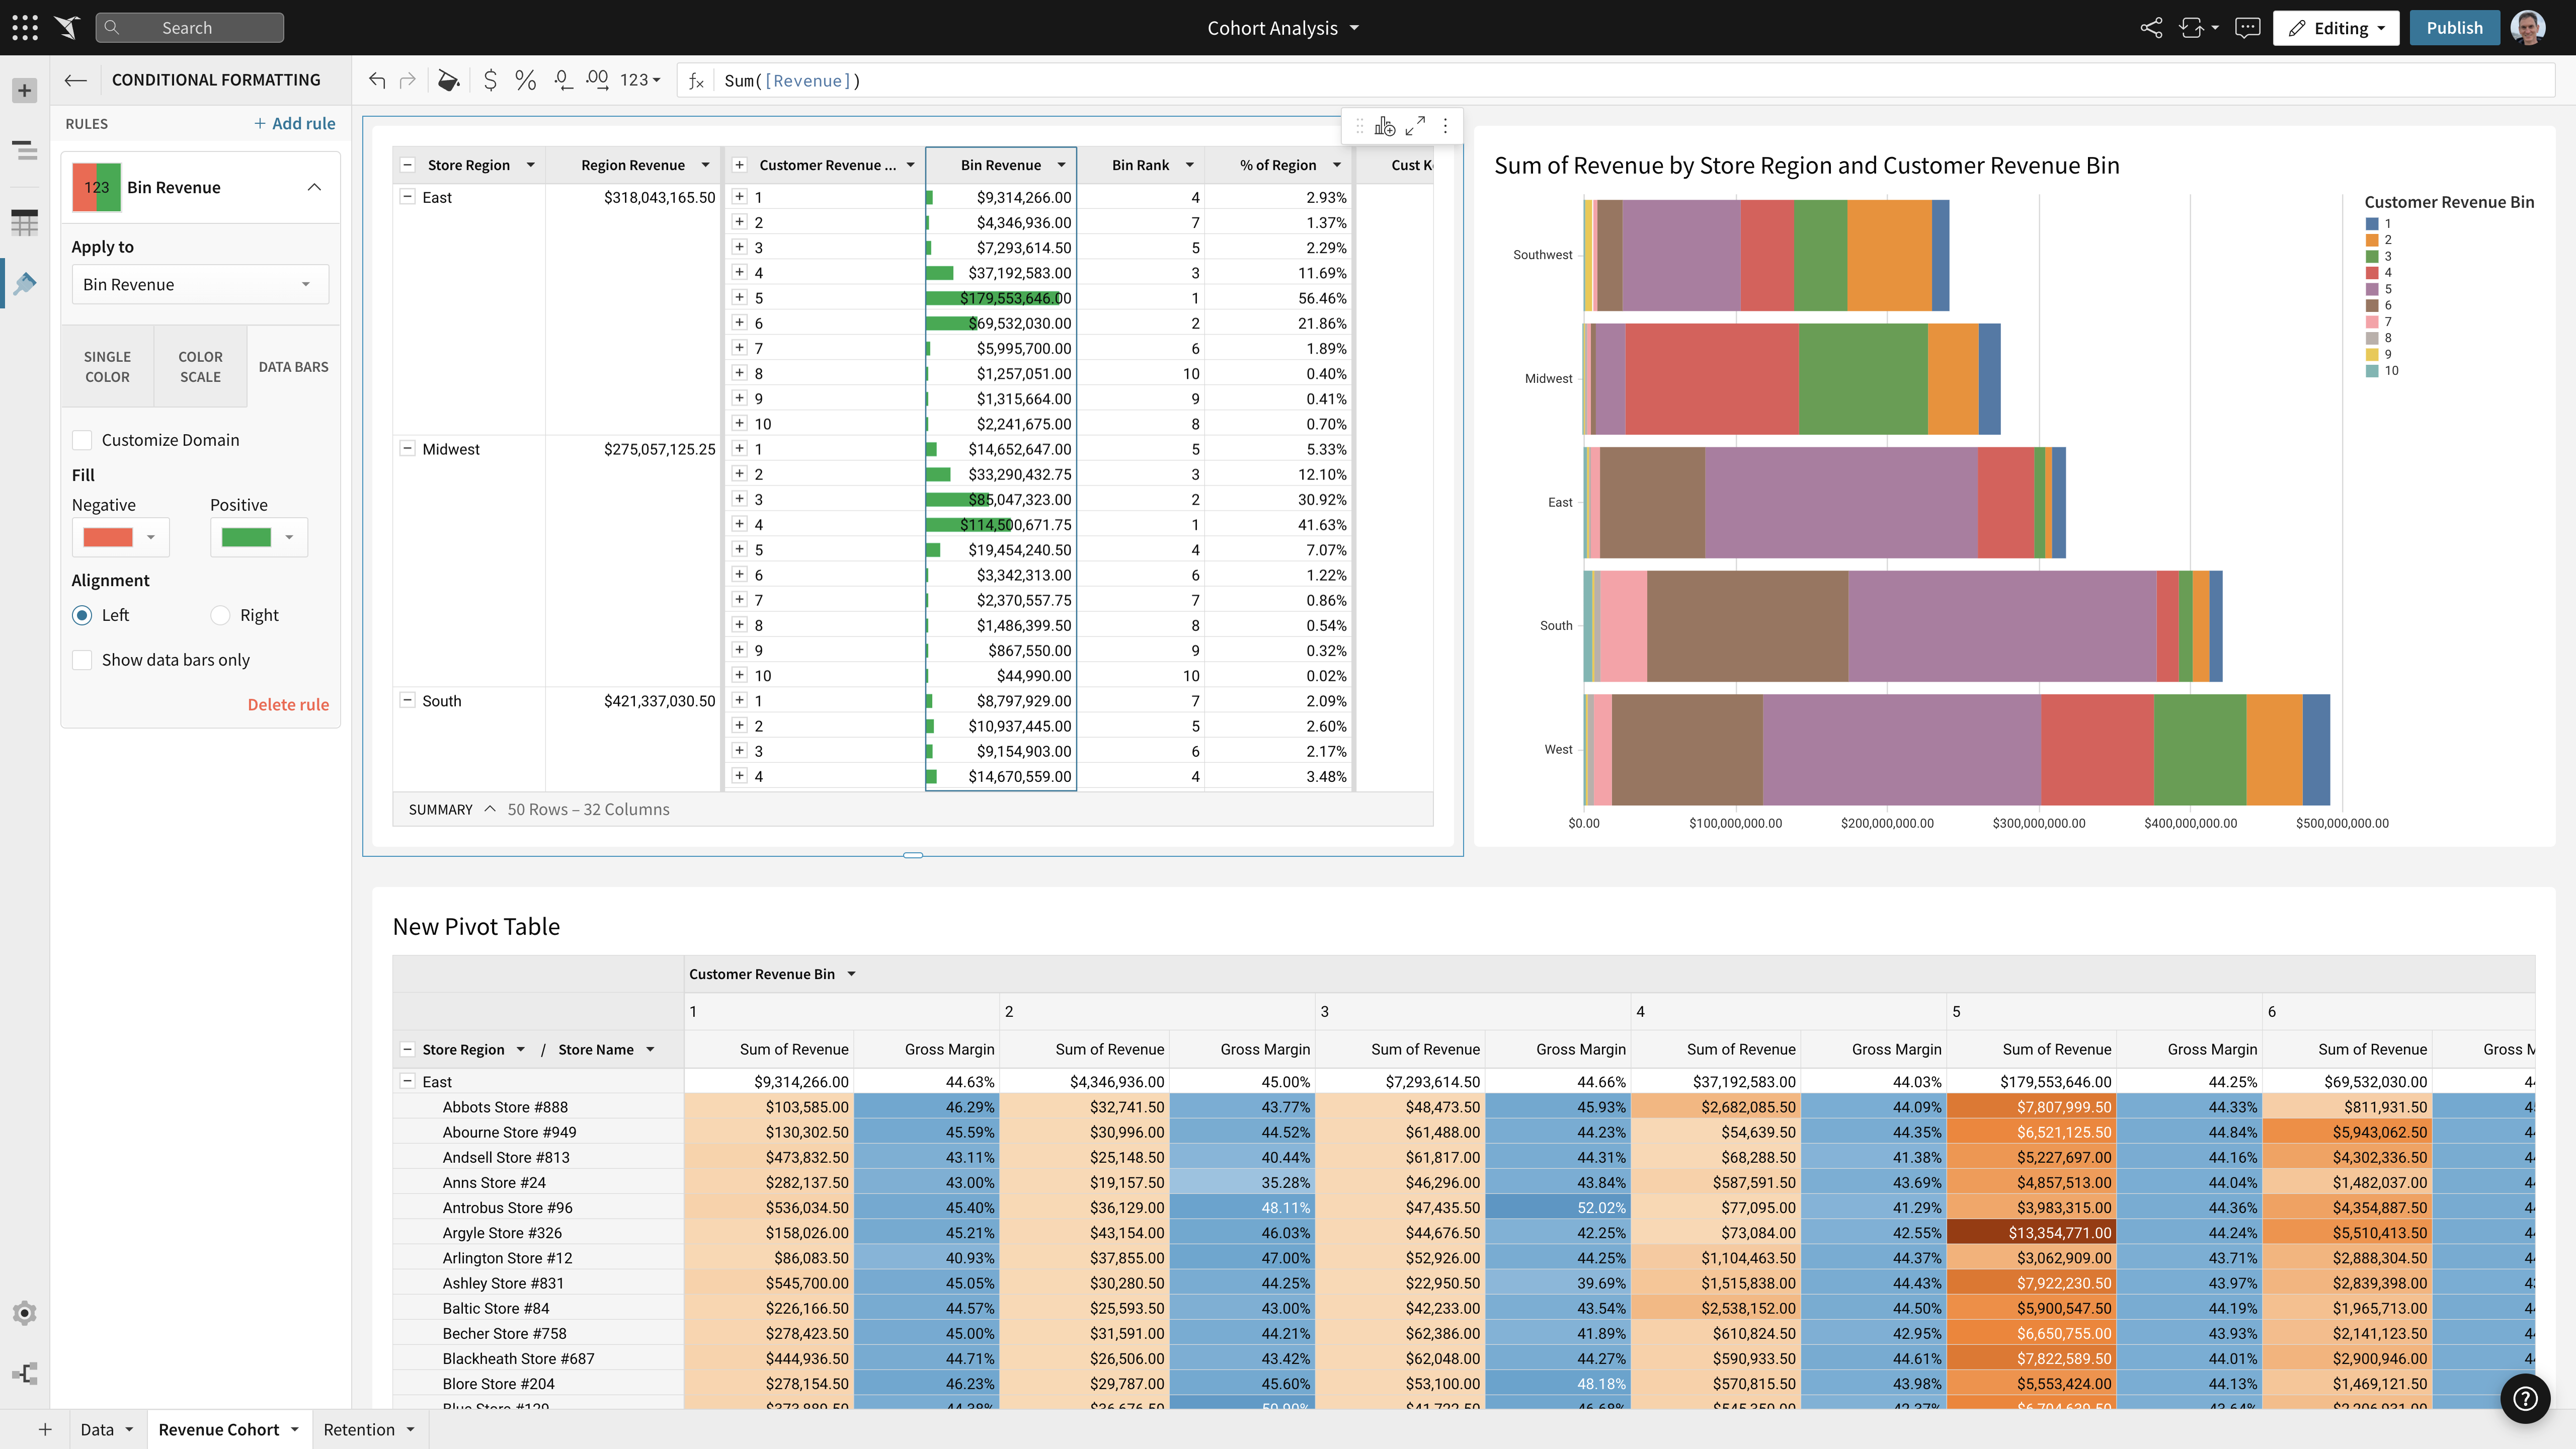
Sigma Computing headquartered in San Francisco provides a suite of data services such as code free data modeling, data search and explorating, and related BI and data visualization services.
If you desire to 'empower' employees to create or edit their own reports, Noetix is a great tool, though I am not particularly an 'empowerment' person. In my experience most people have enough work of their own, so to tell them they now have to create their own reports can cause problems. If someone is available, like I am, to create the reports based on user requirements, then the report can be shared with the user and they can make changes as needed. I have several users who use the same report over and over for slightly different applications, and they are happy to make the small alterations, but creating whole new reports can seem like a daunting task. I tell my users I don't want them to become frustrated. If they want to try on their own, fine, but don't waste more than half an hour, and if you start to get frustrated, stop and IM me. Ninety-nine times out of 100 I already have a report that will give them exactly what they need. I've done extensive training, and find it's quite easy for users to pick up
Its a great tool to have. The ability to come in the morning and by using the report being able see how the day will go. Seeing the goal and the current inventory and also to be able to adjust as the day goes on. With the report updates the report as changes to the inventory happen live or if any issues arise. being able to see that live and being to react quickly.
Noetix makes reporting easy. Users can combine vtables (the Noetix term for its views), add or delete columns, add filters or parameters, sort, add totals to columns, all from an easy to use interface. It comes with a very large number of already written reports for all areas of Oracle reporting, but it also allows for custom vtables to be written, for Oracle or any database, to expand the number of available reports.
Noetix has an Excel add-in that is marvelous. It eliminates the need to run a report in the web application and export to Excel. The add-in can run very large reports, up to a million lines. Once a report is run in Excel, it can be saved, and then refreshed whenever needed. It's a really good tool.
Noetix is flexible. Joins can be added to existing Noetix vtables and also to custom vtables, to give users a large amount of data configurations to choose from. It also allows users to create calculated fields to any report.
Noetix is easy to administer. Users can be added or removed and grouped by the level of permission. Although, in our case, it validates against Oracle, the level of security is dictated by Noetix.
I like the fact that the output is standard, but I would like to be able to move columns around on the output screen, rather than having to go back to the editing screen, move the columns, then rerun the report.
Drag and drop of columns would be nice on the edit screen. Currently if you add a column to a report, it automatically goes to the bottom. Relocation of the column has to be done a line at a time. I would prefer to be able to grab the field I want from those available, and drop it into the report where I want it.
When adding a filter (or parameter), the available fields automatically come up in alphabetical order, but on the columns screen, they don't. They come up in the order they actually are in the query. That means, when creating custom vtables, to have the fields in alphabetical order, one must put them that way. It would be nice if Noetix put the fields in alphabetical order for the user.
Viewer level license is quite limited. These users can't download data or even add filters on datasets. Something to keep in mind.
Directly querying the underlying data warehouse will lead to increased usage. Not a big deal on something like Redshift, but your Snowflake consumption will increase, potentially by a lot.
Sigma has helped us a lot and has become an integral part of our daily workflow. It would be difficult to switch to another platform and have to rebuild the numerous metrics and performance reports that we have already established
It has a clean and modern interface. However, it is not completely intuitive. I think it would be better and easier to navigate with more Windows style drop down menus and/or tabls. There is a significant learning curve, but that may be due in part to the technical nature of this type of software tool.
Support team is helpful in answering questions and providing help with using the UI. There are knowledgeable people within the support team. There are also good online support tools. There are significant community support resources available. There is however lack of a live support. It would be useful to have live phone number or chat to use.
I believe Noetix is much easier to use than either Crystal Reports or InfoMaker. When I worked with InfoMaker I used to say it took 5 minutes to get the data and 5 hours (and sometimes days) to make it look good. The same can be true for Crystal Reports. Noetix has a standard format, and most people export to Excel anyway. Who prints reports? So formatting is not all that important.
Sigma is by far the best. It is easiest to learn and easiest to use on a day to day basis. I never have to wait for dashboards to load and it's very easy to understand the variables that are going into my visualizations. Best of all I can manipulate the data within Sigma very easily. In these other platforms data manipulation is difficult or must be done in the data warehouse
Monitoring health of cloud platform has allowed the company to anticipate issues before they affect customers – Sigma prompted us building a canary monitoring process that provides customer container health.
Customer success has used an activity report to discover customers running runaway processes that they were unaware of, creating an alert to contact the customer and prevent an embarrassing situation.
Customer success uses the activity report to prompt conversations regarding increases or declines in behavior that led to increasing contract limits or addressing churn concerns.